Upstream Regulator Analysis
Combine ChIP-Atlas binding with DE to find driver TFs.
Overview
Problem. A pile of changed genes — which TF drives them?
Learning goals
- Binding + expression = regulatory evidence
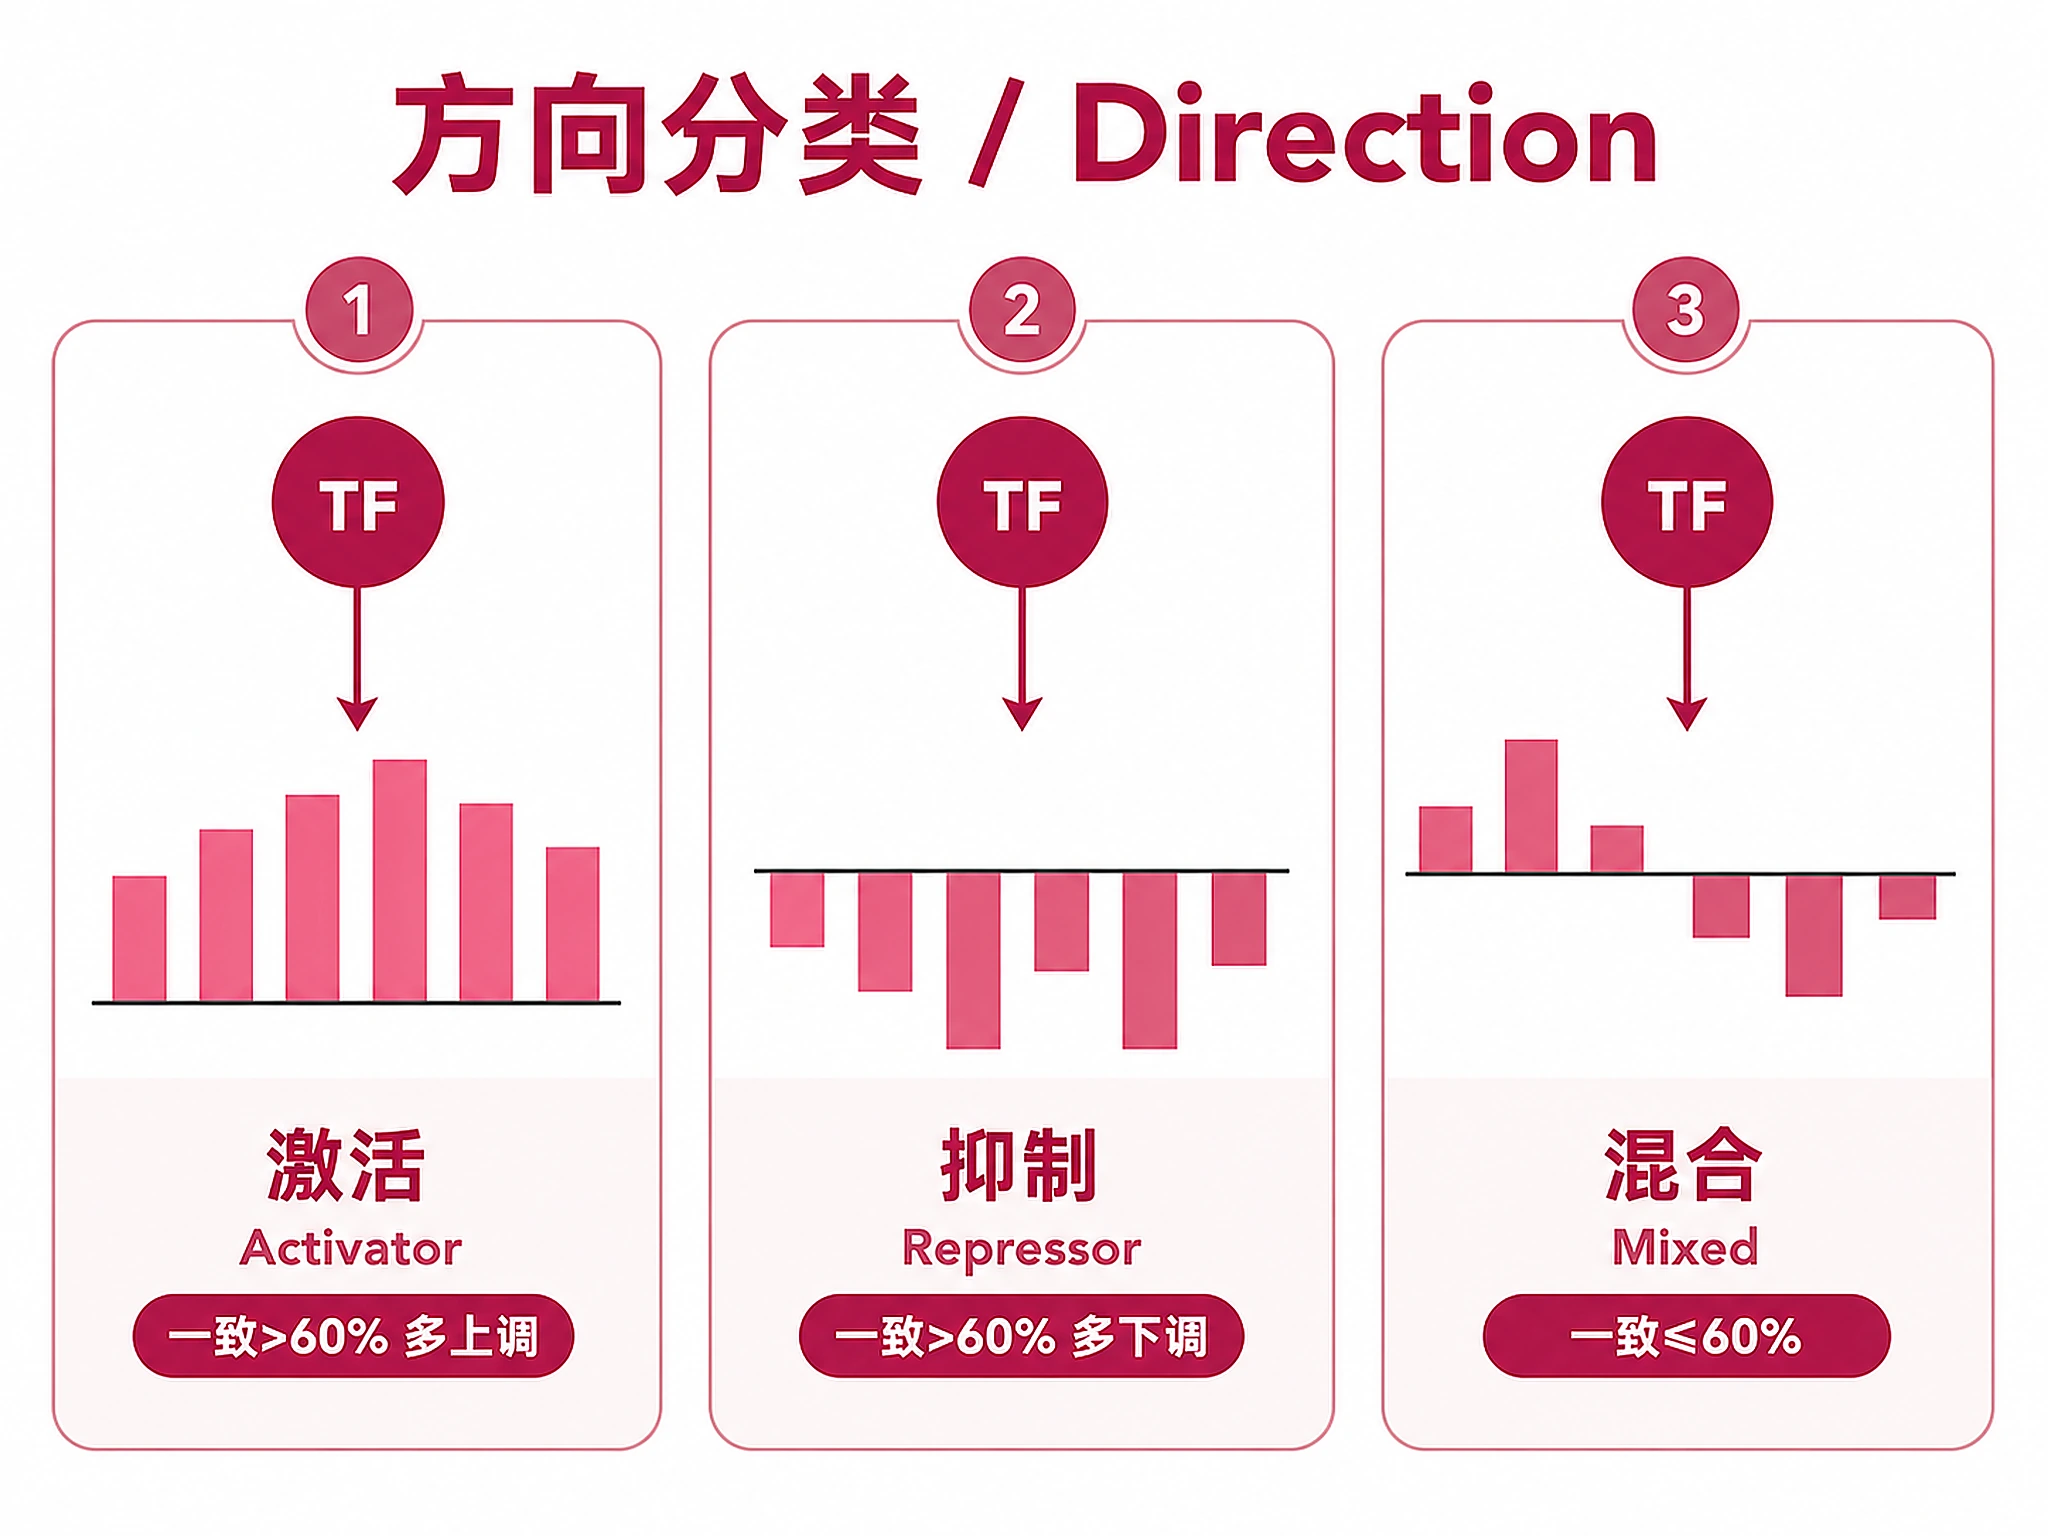
- Direction tells activator from repressor
Figures
Tutorial
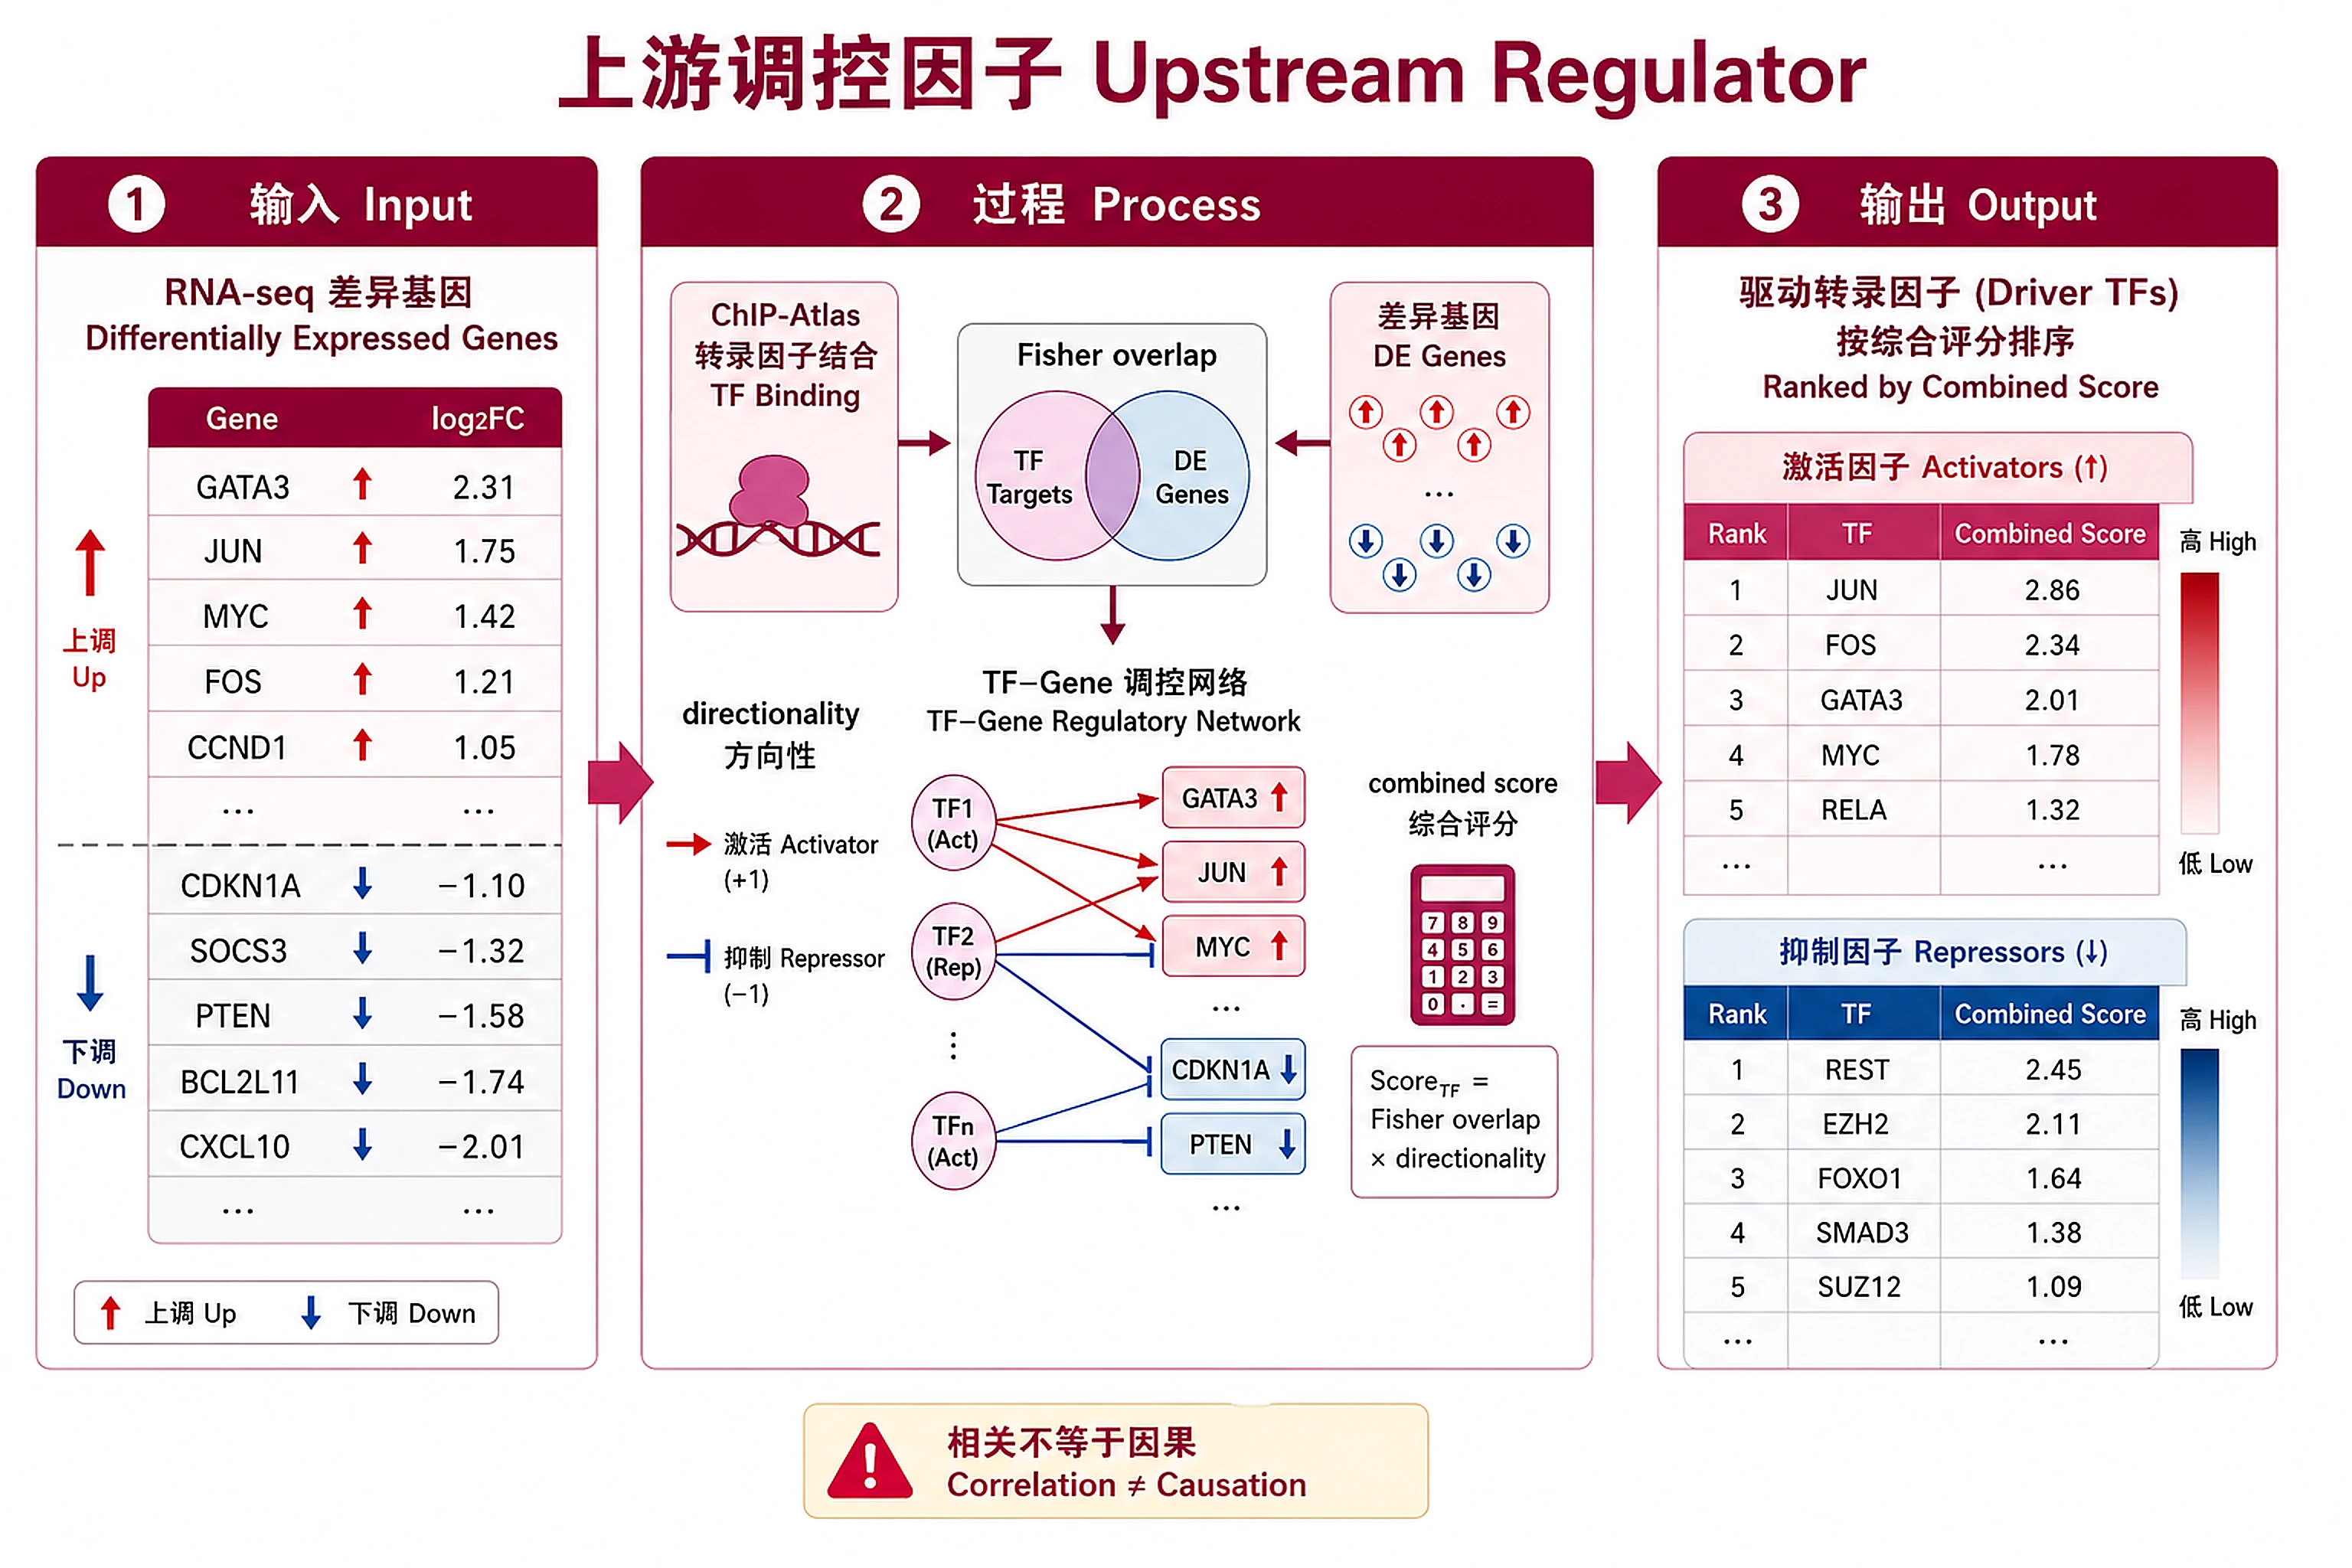
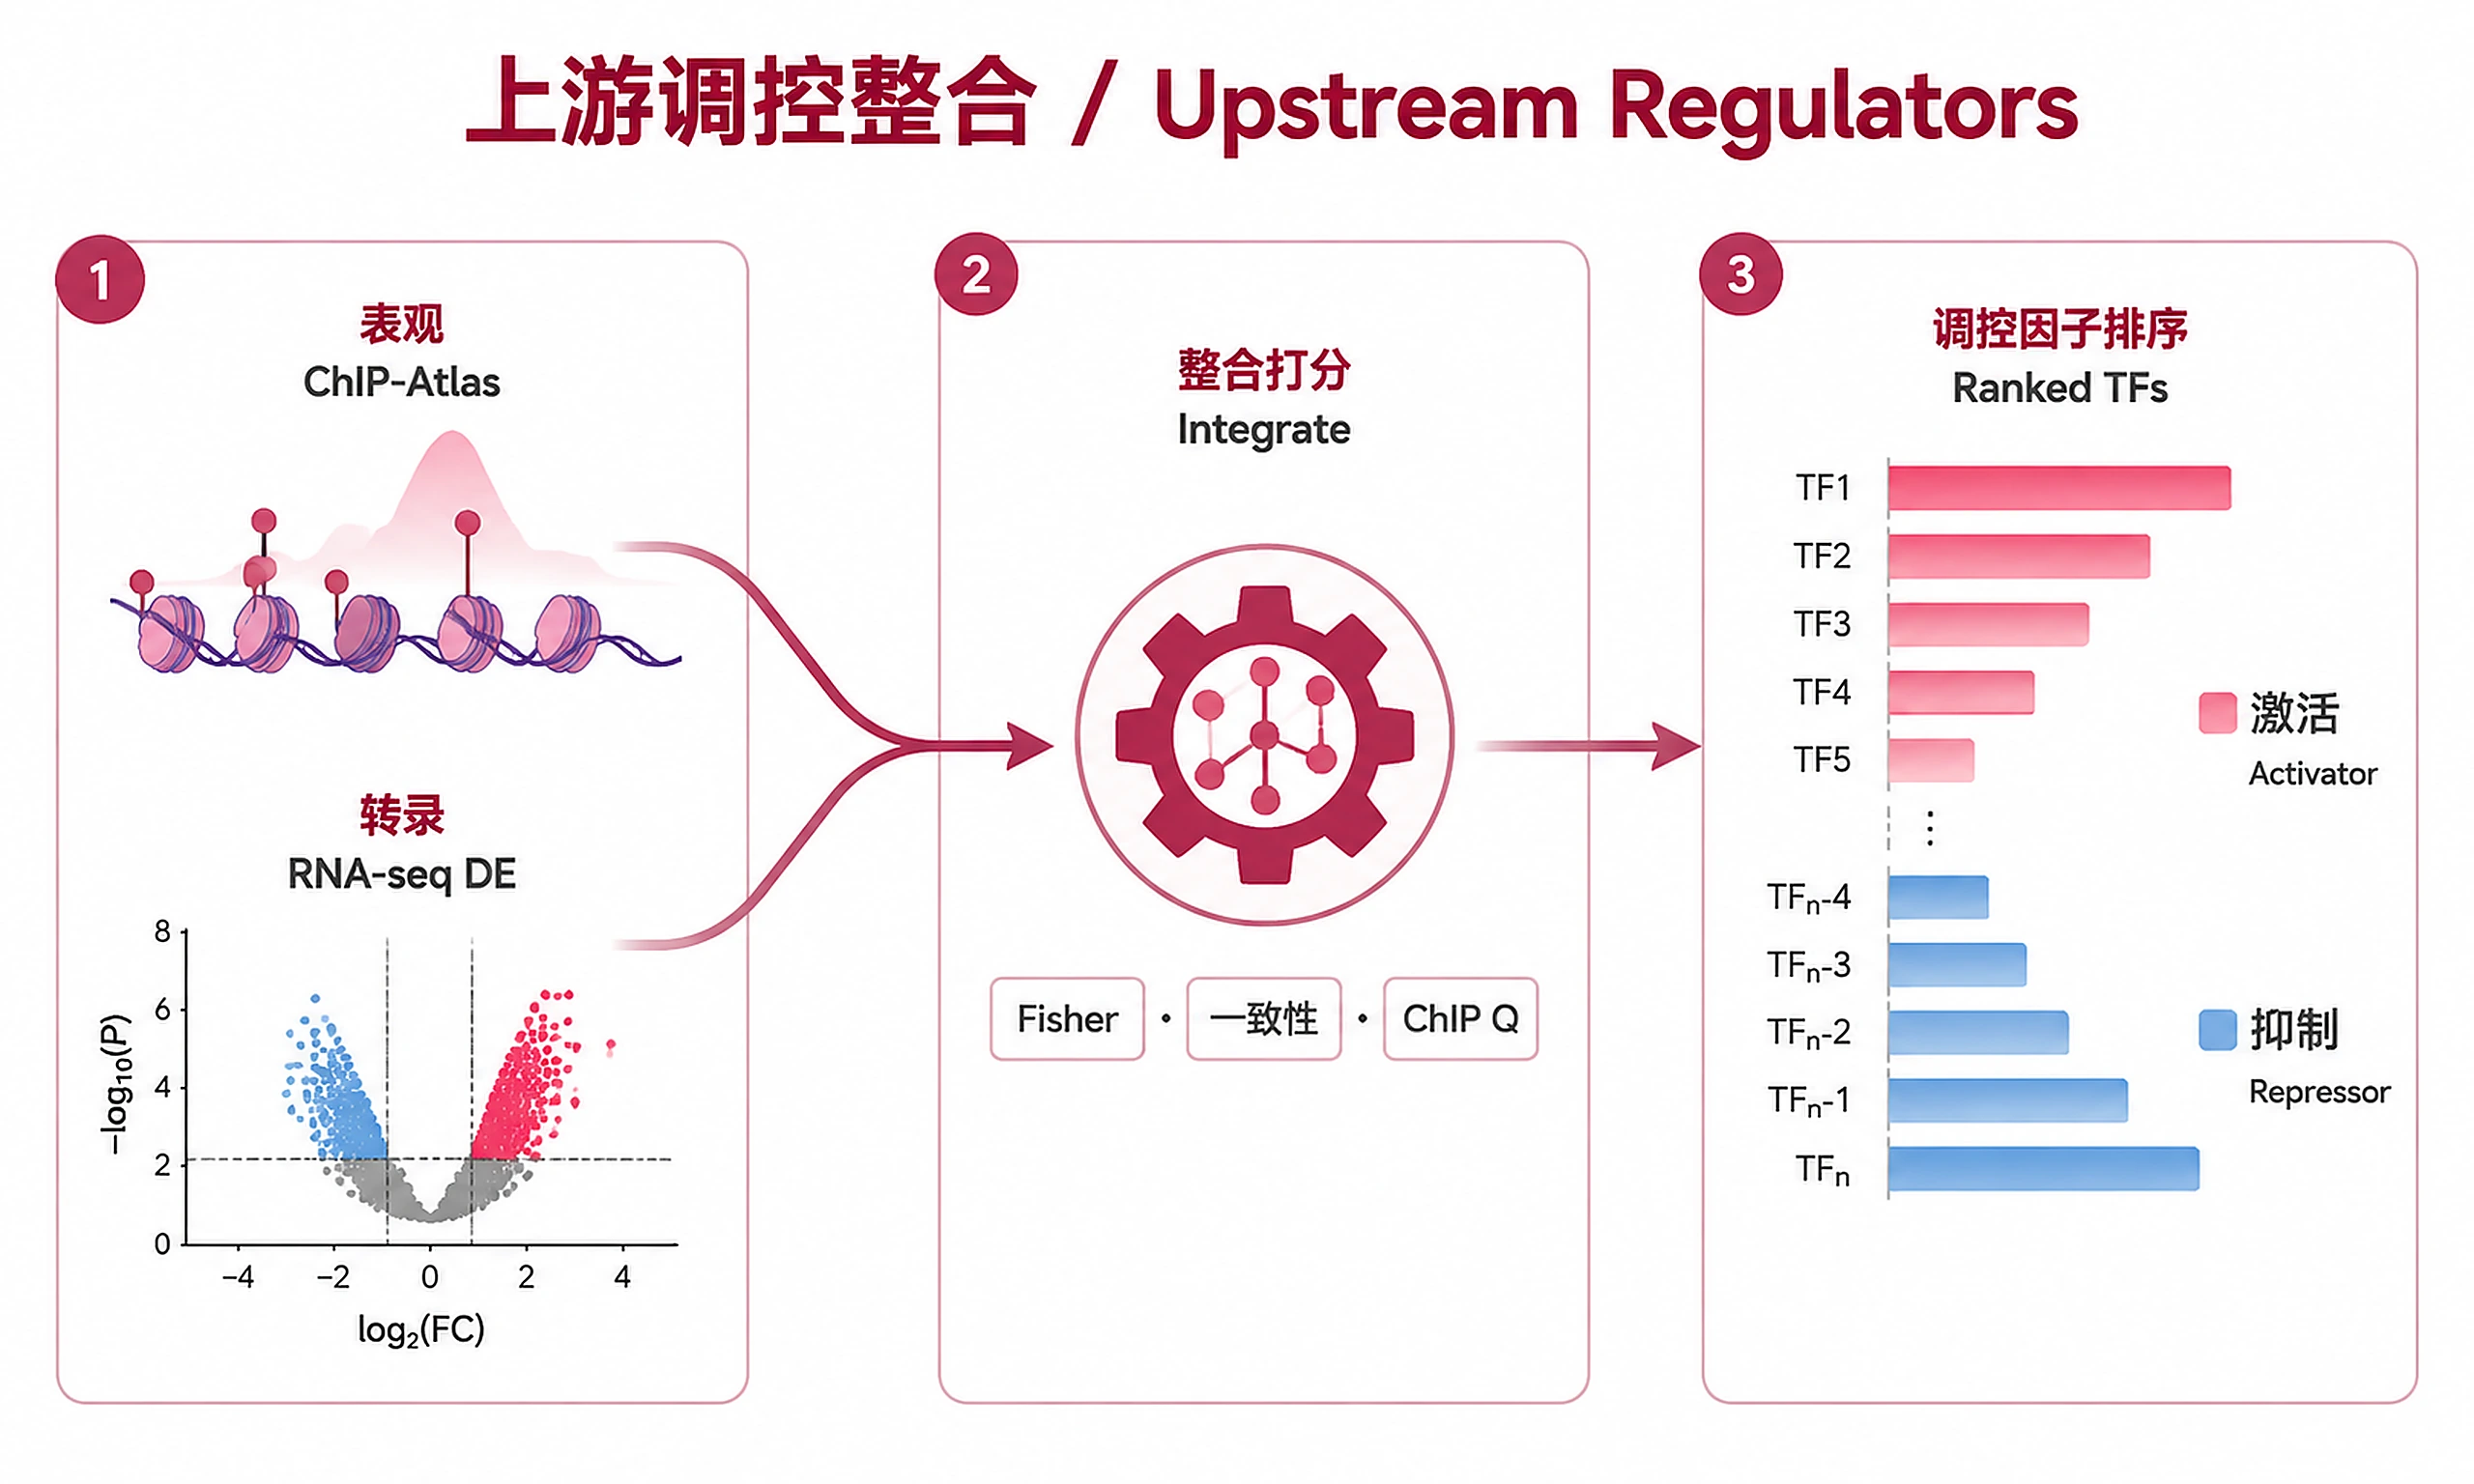
Identify transcription factors (TFs) driving observed differential expression by integrating ChIP-Atlas TF binding data (epigenomics) with RNA-seq DE results (transcriptomics). Ranks TFs by a combined regulatory score incorporating binding enrichment, target-DE overlap (Fisher's exact test), and directional concordance (activator vs repressor).
When to Use This Skill
Use when you:
- Have DE results and want to identify TFs driving expression changes
- Need to go beyond simple gene list enrichment to mechanistic TF-level evidence
- Want to distinguish activators (targets upregulated) from repressors (targets downregulated)
- Want to integrate epigenomics (ChIP-seq) with transcriptomics (RNA-seq) in one analysis
Don't use for:
- Single-cell DE results (designed for bulk RNA-seq DE)
- Organisms not in ChIP-Atlas (see supported genomes below)
- Histone mark analysis (use
chip-atlas-peak-enrichmentdirectly) - When you only need TF binding enrichment without target gene integration
Requires: Internet access (ChIP-Atlas API + data server). Runtime: 15-25 minutes (API polling + target gene downloads).
Installation
pip install pandas numpy scipy requests matplotlib seaborn reportlab
| Package | Version | License | Commercial Use |
|---|---|---|---|
| pandas | ≥1.5 | BSD-3 | ✅ Permitted |
| numpy | ≥1.21 | BSD-3 | ✅ Permitted |
| scipy | ≥1.9 | BSD-3 | ✅ Permitted |
| requests | ≥2.28 | Apache-2.0 | ✅ Permitted |
| matplotlib | ≥3.6 | PSF | ✅ Permitted |
| seaborn | ≥0.12 | BSD-3 | ✅ Permitted |
| reportlab | ≥3.6 | BSD | ✅ Permitted |
Sibling skill dependencies: Requires chip-atlas-peak-enrichment and chip-atlas-target-genes directories at the same level.
Inputs
- DE results CSV/TSV with columns: gene symbol, log2 fold change, adjusted p-value
- Supports DESeq2 (
log2FoldChange,padj), edgeR (logFC,FDR), limma (logFC,adj.P.Val) - Column names auto-detected; override with parameters if needed
- Genome: hg38, hg19, mm10, mm9, rn6, dm6, dm3, ce11, ce10, sacCer3
Outputs
Analysis objects:
analysis_object.pkl- Complete analysis for downstream use- Load with:
import pickle; obj = pickle.load(open('analysis_object.pkl', 'rb')) - Contains: regulon_scores, enrichment results, target gene data, DE data, parameters
CSV results:
regulon_scores_all.csv- All scored TFs with regulatory score, Fisher's p-value, concordance, directionregulon_scores_top.csv- Top 20 TFstarget_overlaps.csv- Per-TF target gene overlap with DE status (up/down)enrichment_up.csv/enrichment_down.csv- ChIP-Atlas peak enrichment results
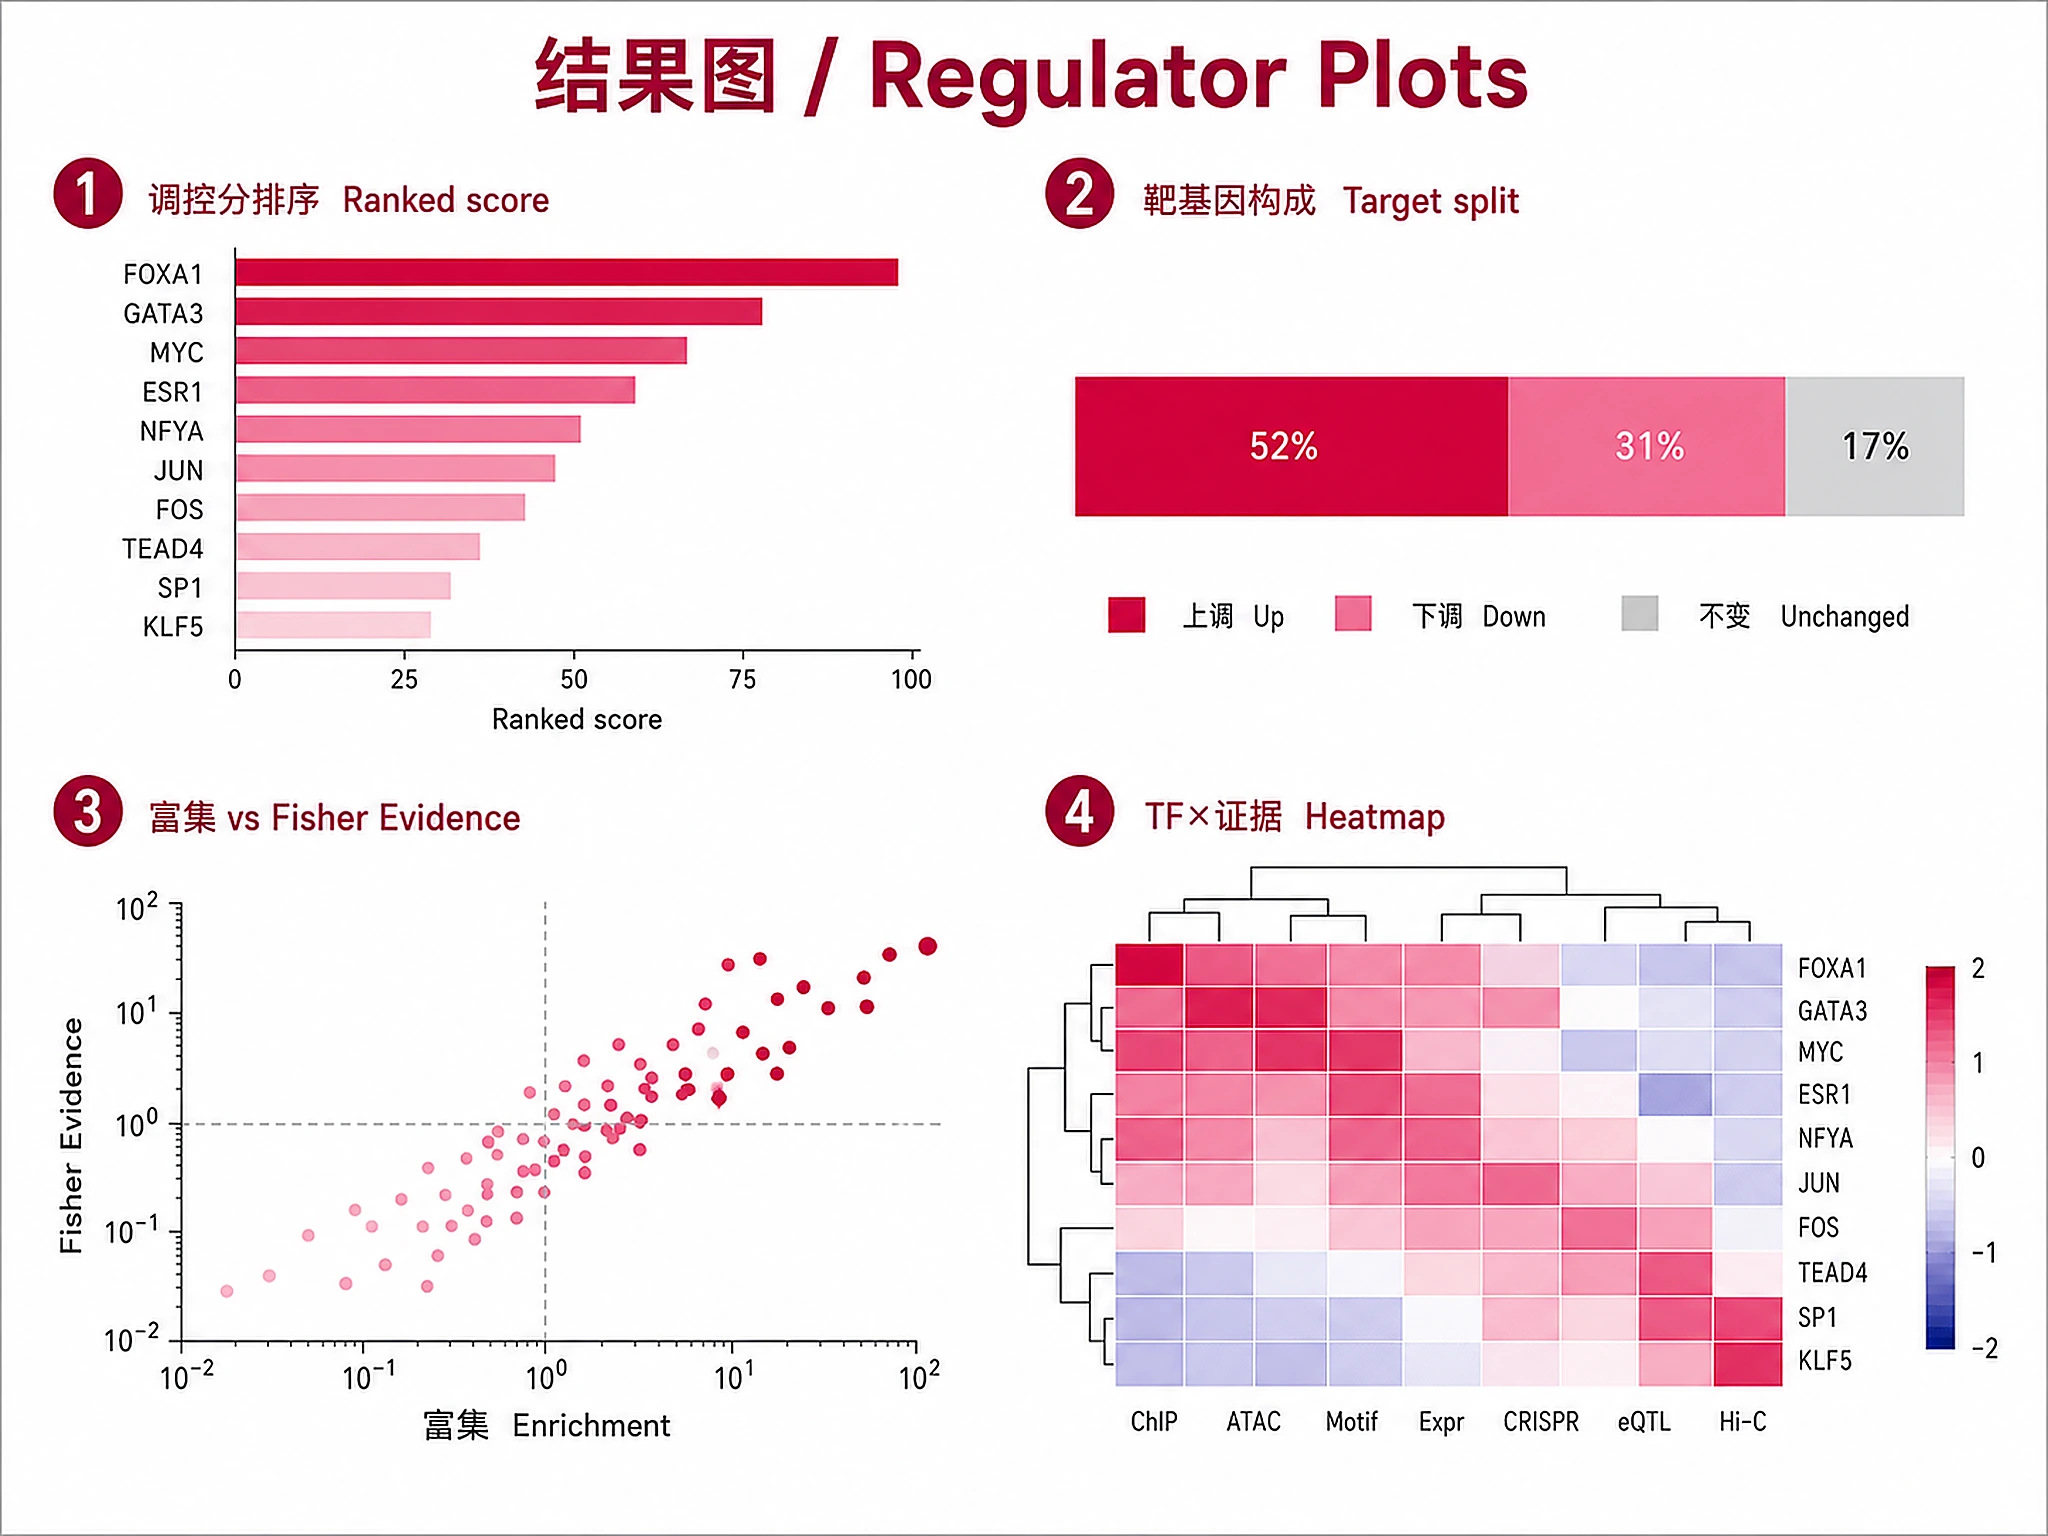
Visualizations (PNG + SVG):
upstream_regulators_top_regulators- Bar chart: TFs ranked by regulatory scoreupstream_regulators_target_overlap- Stacked bar: TF targets classified as up/down/unchangedupstream_regulators_evidence_scatter- Scatter: ChIP enrichment vs Fisher significanceupstream_regulators_heatmap- Clustermap: TFs × regulatory evidence metrics
Reports:
summary_report.md- Human-readable analysis summaryanalysis_report.pdf- Publication-quality PDF with Introduction, Methods, Results, Conclusions- Requires:
pip install reportlab(optional — markdown report generated regardless)
Clarification Questions
-
Input Files (ASK THIS FIRST):
- Do you have DE results (CSV/TSV) to analyze?
- If uploaded: Is this the DE results file you'd like to find upstream regulators for?
- Expected columns: gene symbol + log2FoldChange + adjusted p-value
- Or use example data? Three options:
- a) Estrogen/MCF7 dataset (recommended) — real DE results from GSE51403 (estradiol-treated MCF7 breast cancer cells, ~58K genes). Expected top regulator: ESR1
- b) Airway dataset — real DE results from GSE52778 (dexamethasone-treated airway smooth muscle cells, ~58K genes). Expected top regulator: NR3C1
- c) Synthetic TP53-driven data (~200 genes, fast, offline)
-
Analysis Options:
- (If using example data) Choose analysis parameters:
- a) Standard analysis (top 10 TFs, q < 0.05) (recommended)
- b) Comprehensive analysis (top 15 TFs, q < 0.1)
- (If using your own data) What species/genome?
- a) Human (hg38)
- b) Human (hg19)
- c) Mouse (mm10)
- d) Other (specify)
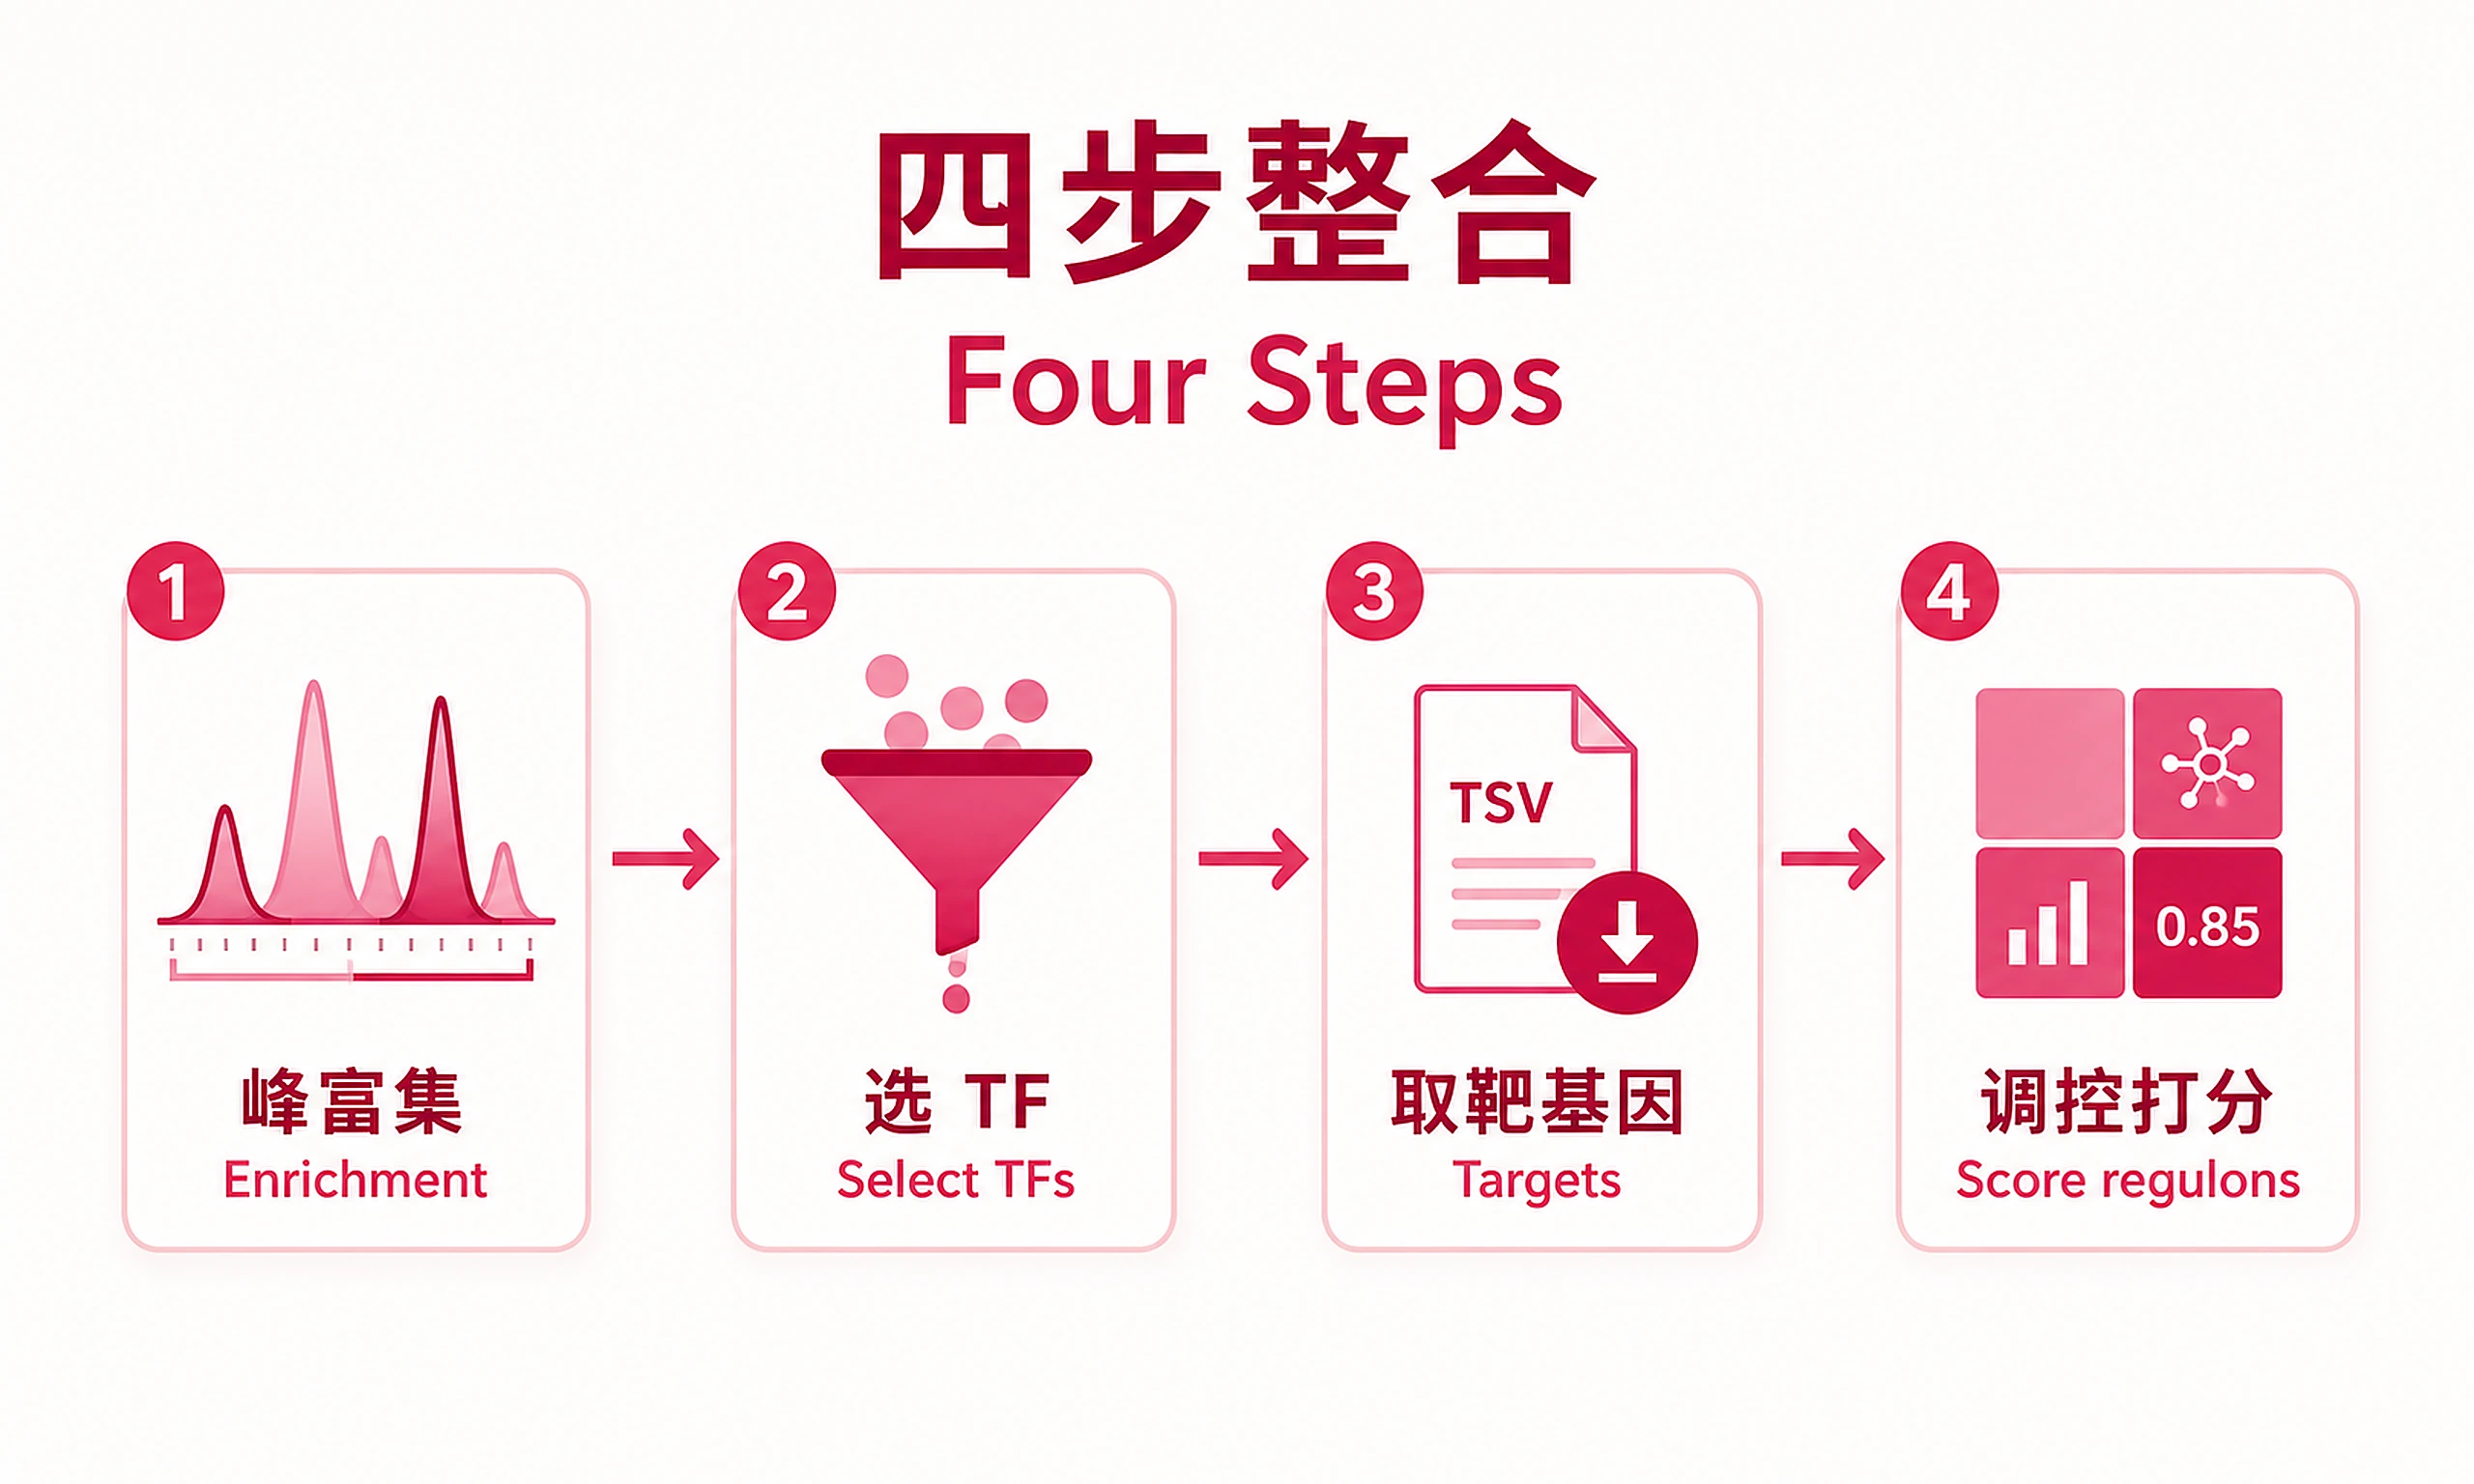
Standard Workflow
🚨 MANDATORY: USE SCRIPTS EXACTLY AS SHOWN - DO NOT WRITE INLINE CODE 🚨
Step 1 - Load data:
# For example data (real estrogen/MCF7 dataset, downloads from EBI Expression Atlas):
from scripts.load_example_data import load_example_data
de_data = load_example_data(source="estrogen")

# Alternative: airway dataset (dexamethasone, real data):
de_data = load_example_data(source="airway")

# For synthetic data (offline, fast, TP53-driven):
de_data = load_example_data(source="synthetic")

# For user data:
from scripts.load_de_results import load_de_results
de_data = load_de_results("path/to/de_results.csv")
✅ VERIFICATION: "✓ Data loaded successfully: N total genes, M DE genes (X up, Y down)"
Step 2 - Run integration analysis:
from scripts.run_integration_workflow import run_integration_workflow
results = run_integration_workflow(de_data, genome="hg38", output_dir="regulator_results")
DO NOT write inline API code or custom scoring. Just call the workflow function.
⏱️ This step takes 15-25 minutes (ChIP-Atlas API polling + target gene downloads).
✅ VERIFICATION: "✓ Integration analysis completed successfully!"
Step 3 - Generate visualizations:
from scripts.generate_all_plots import generate_all_plots
generate_all_plots(results, output_dir="regulator_results")
DO NOT write inline plotting code (ggplot, ggsave, etc.). Just use the script.
✅ VERIFICATION: "✓ All visualizations generated successfully!"
Step 4 - Export results:
from scripts.export_all import export_all
export_all(results, output_dir="regulator_results")
DO NOT write custom export code. Use export_all().
✅ VERIFICATION: "=== Export Complete ==="
⚠️ CRITICAL - DO NOT:
- ❌ Write inline API code → STOP: Use
run_integration_workflow() - ❌ Write inline plotting code → STOP: Use
generate_all_plots() - ❌ Write custom export code → STOP: Use
export_all() - ❌ Write custom Fisher's test code → STOP: Built into
score_regulons()
⚠️ IF SCRIPTS FAIL - Script Failure Hierarchy:
- Fix and Retry (90%) - Install missing package, re-run script
- Modify Script (5%) - Edit the script file itself, document changes
- Use as Reference (4%) - Read script, adapt approach, cite source
- Write from Scratch (1%) - Only if genuinely impossible, explain why
NEVER skip directly to writing inline code without trying the script first.
Common Issues
| Error | Cause | Solution |
|---|---|---|
| ImportError: sibling skill not found | Missing chip-atlas-peak-enrichment or chip-atlas-target-genes | Ensure both sibling skills are installed at the same directory level |
| API 400 error | Empty cellClass or invalid parameters | Use cell_class="All cell types" (must be non-empty) |
| Both enrichment analyses failed | Too few DE genes per direction | Need ≥3 genes in at least one direction (up or down) |
| No TFs passed enrichment threshold | Stringent cutoff or few DE genes | Try min_enrichment_qvalue=0.1 or add more DE genes |
| Target gene download timeout | Large TF file or slow connection | Script retries; if persistent, reduce max_tfs |
| No TFs with target gene data | Enriched TFs are histone marks | Filter with antigen_class="TFs and others" (default) |
| SVG export failed | Missing svglite/cairo | Normal - PNG always generated; SVG is optional |
Interpretation Guidelines
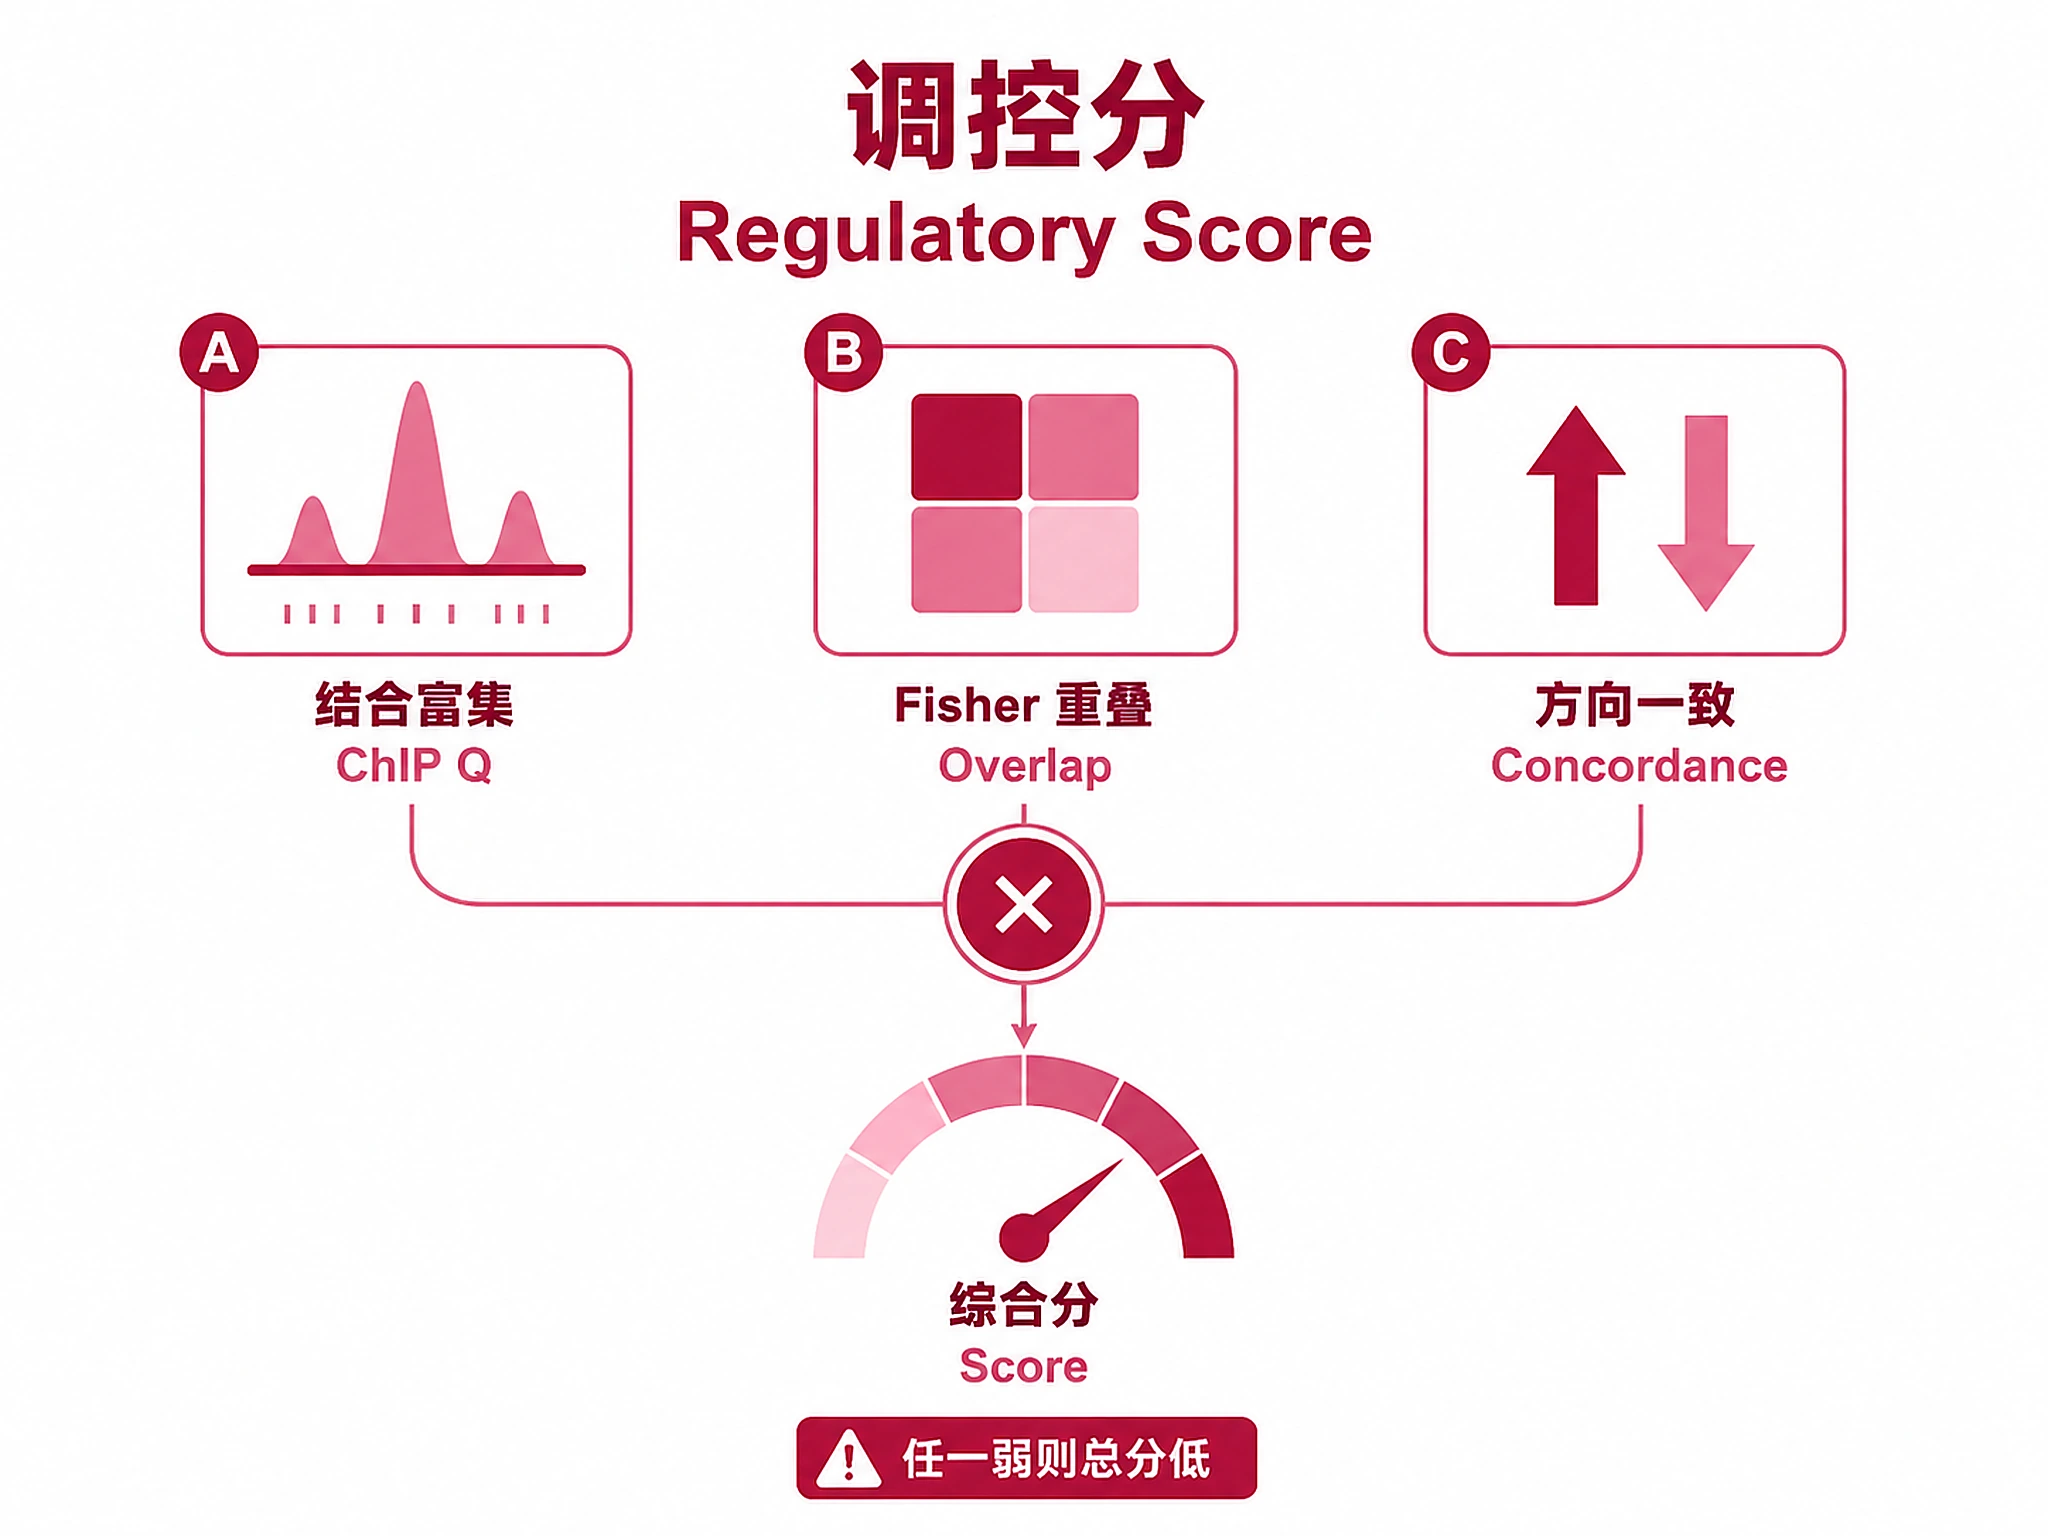
Regulatory Score
Combined evidence: -log10(Fisher P) × Concordance × -log10(ChIP Q)
| Score | Evidence |
|---|---|
| >100 | Very strong — high ChIP enrichment + significant target overlap + high concordance |
| 50-100 | Strong |
| 20-50 | Moderate |
| <20 | Weak — interpret with caution |
Direction Classification
- Activator (concordance >60%, majority up): TF likely activates these genes
- Repressor (concordance >60%, majority down): TF likely represses these genes
- Mixed (concordance ≤60%): No clear directional bias — context-dependent regulation
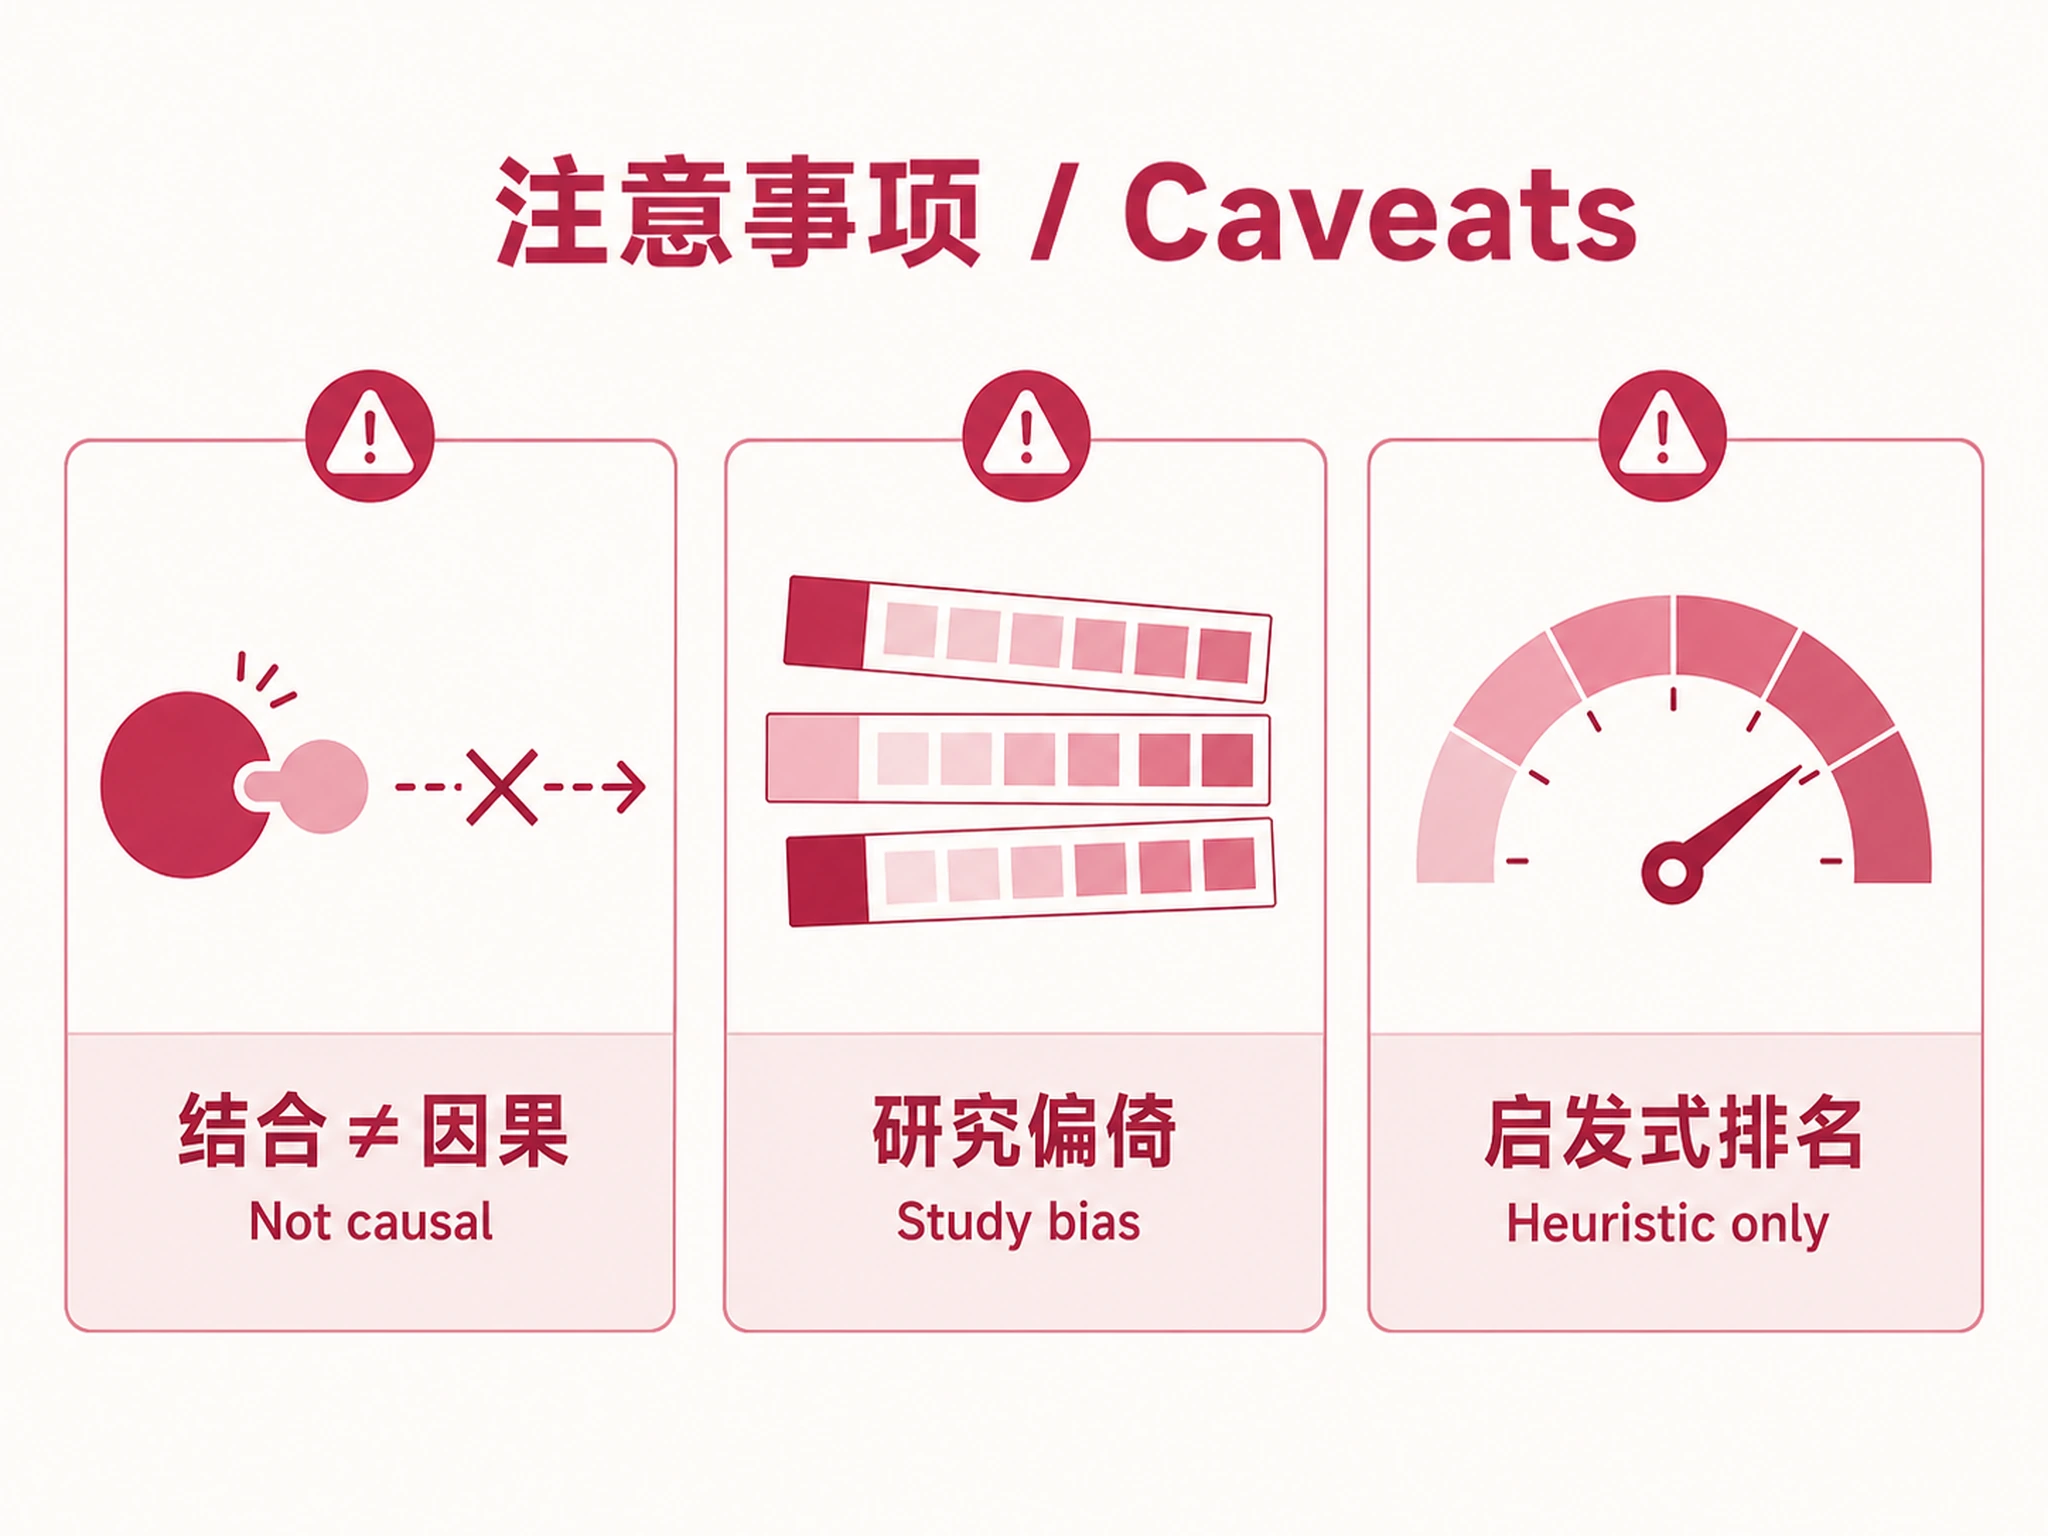
Key Caveats
- Results biased toward well-studied TFs/cell types in ChIP-Atlas
- Binding enrichment ≠ regulatory causation (validate with perturbation)
- Directional labels assume simple activation/repression (ignores context-dependent regulation)
- Combined score is a heuristic ranking, not a formal multi-test correction
- Fisher's test assumes independence (may be violated if targets cluster in pathways)
Suggested Next Steps
After identifying upstream regulators:
- Validate binding: Use
chip-atlas-target-genesto examine cell-type-specific binding patterns for top TFs - Functional enrichment: Use
functional-enrichment-from-degson TF-target gene subsets - Co-expression: Use
gene-correlation-archs4to check if TF and targets co-express - Network inference: Use
grn-pyscenicfor single-cell GRN validation - Literature review: Use
literature-reviewto validate TF-disease associations
Related Skills
chip-atlas-peak-enrichment- Component: TF binding enrichment analysischip-atlas-target-genes- Component: TF target gene retrievalbulk-rnaseq-counts-to-de-deseq2- Upstream: generates DE results inputde-results-to-gene-lists- Upstream: generates filtered gene listsfunctional-enrichment-from-degs- Complementary: pathway-level enrichment
References
- Zou Z, et al. (2024) ChIP-Atlas 3.0: a gene regulation data-mining platform. Nucleic Acids Res. 52(W1):W159-W166
- Oki S, et al. (2018) ChIP-Atlas: a data-mining suite. EMBO Rep. 19(12):e46255
- Fisher RA (1922) On the interpretation of chi-squared. J R Stat Soc. 85(1):87-94
Code preview
scripts/__init__.py
# upstream-regulator-analysis scripts packagescripts/export_all.py
"""
Export all upstream regulator analysis results (Step 4).

Exports:
1. analysis_object.pkl - Complete results for downstream use
2. regulon_scores_all.csv - All scored TFs
3. regulon_scores_top.csv - Top TFs by regulatory score
4. target_overlaps.csv - Per-TF target gene overlap details
5. enrichment_up.csv - Peak enrichment results for upregulated genes
6. enrichment_down.csv - Peak enrichment results for downregulated genes
7. summary_report.md - Human-readable summary
8. analysis_report.pdf - Publication-quality PDF report
"""

import os
import pickle
from datetime import datetime

import pandas as pd


def export_all(results, output_dir="regulator_results"):
    """
    Export all upstream regulator results with pickle object.

    Parameters
    ----------
    results : dict
        Results from run_integration_workflow().
    output_dir : str
        Output directory.

    Verification
    ------------
    Prints "=== Export Complete ===" when done.
    """
    os.makedirs(output_dir, exist_ok=True)

    print("\n--- Exporting results ---")

    regulon_scores = results["regulon_scores"]
    parameters = results["parameters"]
    metadata = results["metadata"]

    # 1. Analysis object (pickle)
    pkl_path = os.path.join(output_dir, "analysis_object.pkl")
    analysis_object = {
        "regulon_scores": regulon_scores,
        "enrichment_results_up": results.get("enrichment_results_up"),
        "enrichment_results_down": results.get("enrichment_results_down"),
        "top_tfs": results.get("top_tfs"),
        "target_gene_data": results.get("target_gene_data"),
        "de_data": results["de_data"],
        "parameters": parameters,
        "metadata": metadata,
        "timestamp": datetime.now().isoformat(),
    }
    with open(pkl_path, "wb") as f:
        pickle.dump(analysis_object, f)
    print(f"   1. {pkl_path}")
    print(f"      (Load with: import pickle; obj = pickle.load(open('{pkl_path}', 'rb')))")

    # 2. All regulon scores
    if len(regulon_scores) > 0:
        csv_all = os.path.join(output_dir, "regulon_scores_all.csv")
        regulon_scores.to_csv(csv_all, index=False)
        print(f"   2. {csv_all} ({len(regulon_scores)} TFs)")

        # 3. Top regulon scores
        top_n = min(20, len(regulon_scores))
        csv_top = os.path.join(output_dir, "regulon_scores_top.csv")
        regulon_scores.head(top_n).to_csv(csv_top, index=False)
        print(f"   3. {csv_top} (top {top_n})")
    else:
        print("   2-3. No regulon scores to export")

    # 4. Target overlaps detail
    _export_target_overlaps(results, output_dir)

    # 5-6. Enrichment results
scripts/generate_all_plots.py
"""
Visualization for upstream regulator analysis results.

Generates 4-panel publication-quality figure:
1. Top Regulators bar chart (regulatory score, colored by direction)
2. Target-DE Overlap stacked bars (up/down/unchanged per TF)
3. Evidence Scatter (ChIP enrichment vs Fisher p, sized by concordance)
4. Regulatory Heatmap (seaborn clustermap, TFs x metrics)
"""

import os

import numpy as np
import pandas as pd

import matplotlib
matplotlib.use("Agg")
import matplotlib.pyplot as plt
import seaborn as sns

# --- Theme setup per CLAUDE.md standard ---
sns.set_style("ticks")
plt.rcParams["font.family"] = "sans-serif"
plt.rcParams["font.sans-serif"] = ["Helvetica"]


# Direction color palette
_DIRECTION_COLORS = {
    "activator": "#E74C3C",
    "repressor": "#2E86C1",
    "mixed": "#95A5A6",
}


def _save_plot(fig, base_path, dpi=300):
    """Save a matplotlib figure to PNG + SVG with graceful fallback."""
    png_path = base_path + ".png"
    svg_path = base_path + ".svg"

    fig.savefig(png_path, dpi=dpi, bbox_inches="tight", facecolor="white")
    print(f"   Saved: {png_path}")
    try:
        fig.savefig(svg_path, format="svg", bbox_inches="tight", facecolor="white")
        print(f"   Saved: {svg_path}")
    except Exception:
        print("   (SVG export failed, PNG available)")
    plt.close(fig)


def _plot_top_regulators(regulon_scores, top_n=15):
    """Panel 1: Top regulators ranked by regulatory score, colored by direction."""
    df = regulon_scores.head(top_n).copy()
    if len(df) == 0:
        return None

    # Reverse for top-at-top horizontal bar
    df = df.iloc[::-1].reset_index(drop=True)

    fig, ax = plt.subplots(figsize=(10, max(6, top_n * 0.4)))
    colors = [_DIRECTION_COLORS.get(d, "#95A5A6") for d in df["direction"]]
    bars = ax.barh(df["tf"], df["regulatory_score"], color=colors, height=0.7)

    # Add concordance labels
    for i, (_, row) in enumerate(df.iterrows()):
        ax.text(
            row["regulatory_score"] + df["regulatory_score"].max() * 0.02,
            i, f"{row['concordance']:.0%}",
            va="center", fontsize=8,
        )

    ax.set_xlabel("Regulatory Score", fontsize=11)
    ax.set_title("Top Upstream Regulators", fontsize=14, fontweight="bold")
    sns.despine(ax=ax)

    # Legend
    from matplotlib.patches import Patch
    legend_elements = [
        Patch(facecolor=_DIRECTION_COLORS["activator"], label="Activator"),
        Patch(facecolor=_DIRECTION_COLORS["repressor"], label="Repressor"),
        Patch(facecolor=_DIRECTION_COLORS["mixed"], label="Mixed"),
Companion files
| Type | Path | Bytes |
|---|---|---|
| Markdown | references/integration_methods.md | 5,505 |
| Python | scripts/__init__.py | 46 |
| Python | scripts/export_all.py | 10,981 |
| Python | scripts/generate_all_plots.py | 8,489 |
| Python | scripts/generate_report.py | 14,678 |
| Python | scripts/load_de_results.py | 5,293 |
| Python | scripts/load_example_data.py | 11,678 |
| Python | scripts/run_integration_workflow.py | 12,704 |
| Python | scripts/score_regulons.py | 5,459 |
| Markdown | SKILL.md | 10,214 |
| JSON | skill.meta.json | 2,196 |