Trajectory & Pseudotime
Reconstruct differentiation trajectories, pseudotime and RNA velocity.
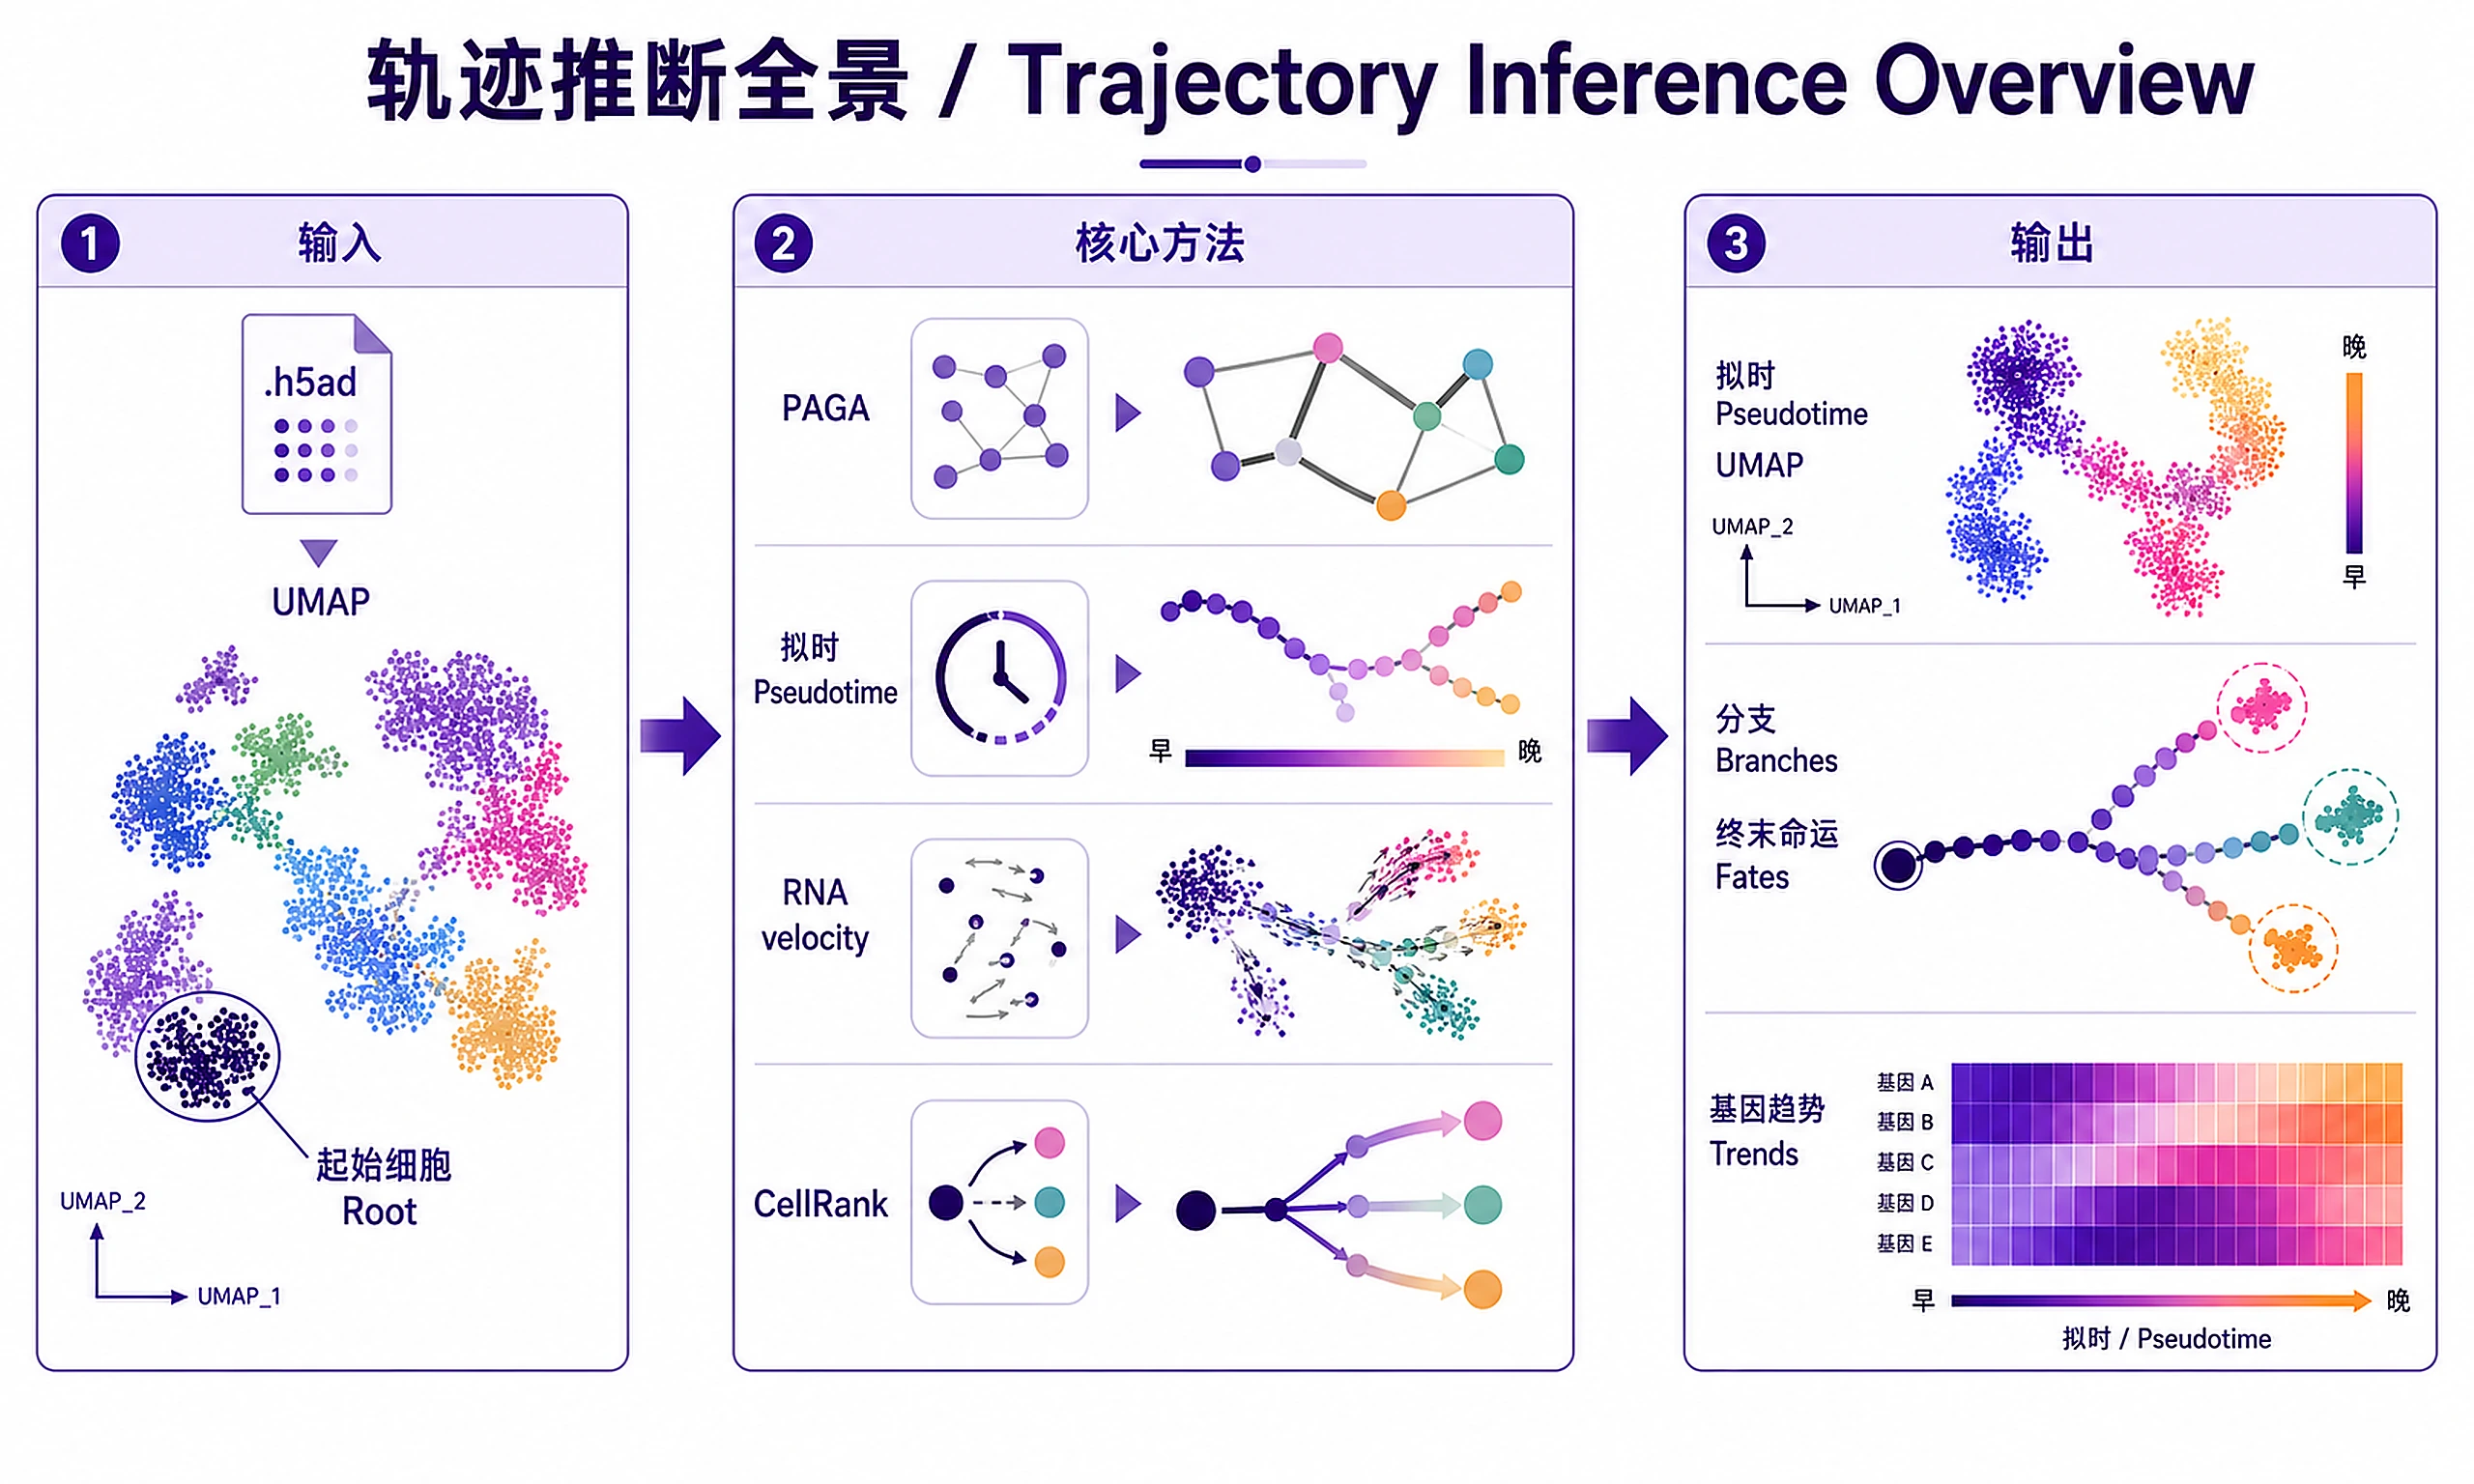
Overview
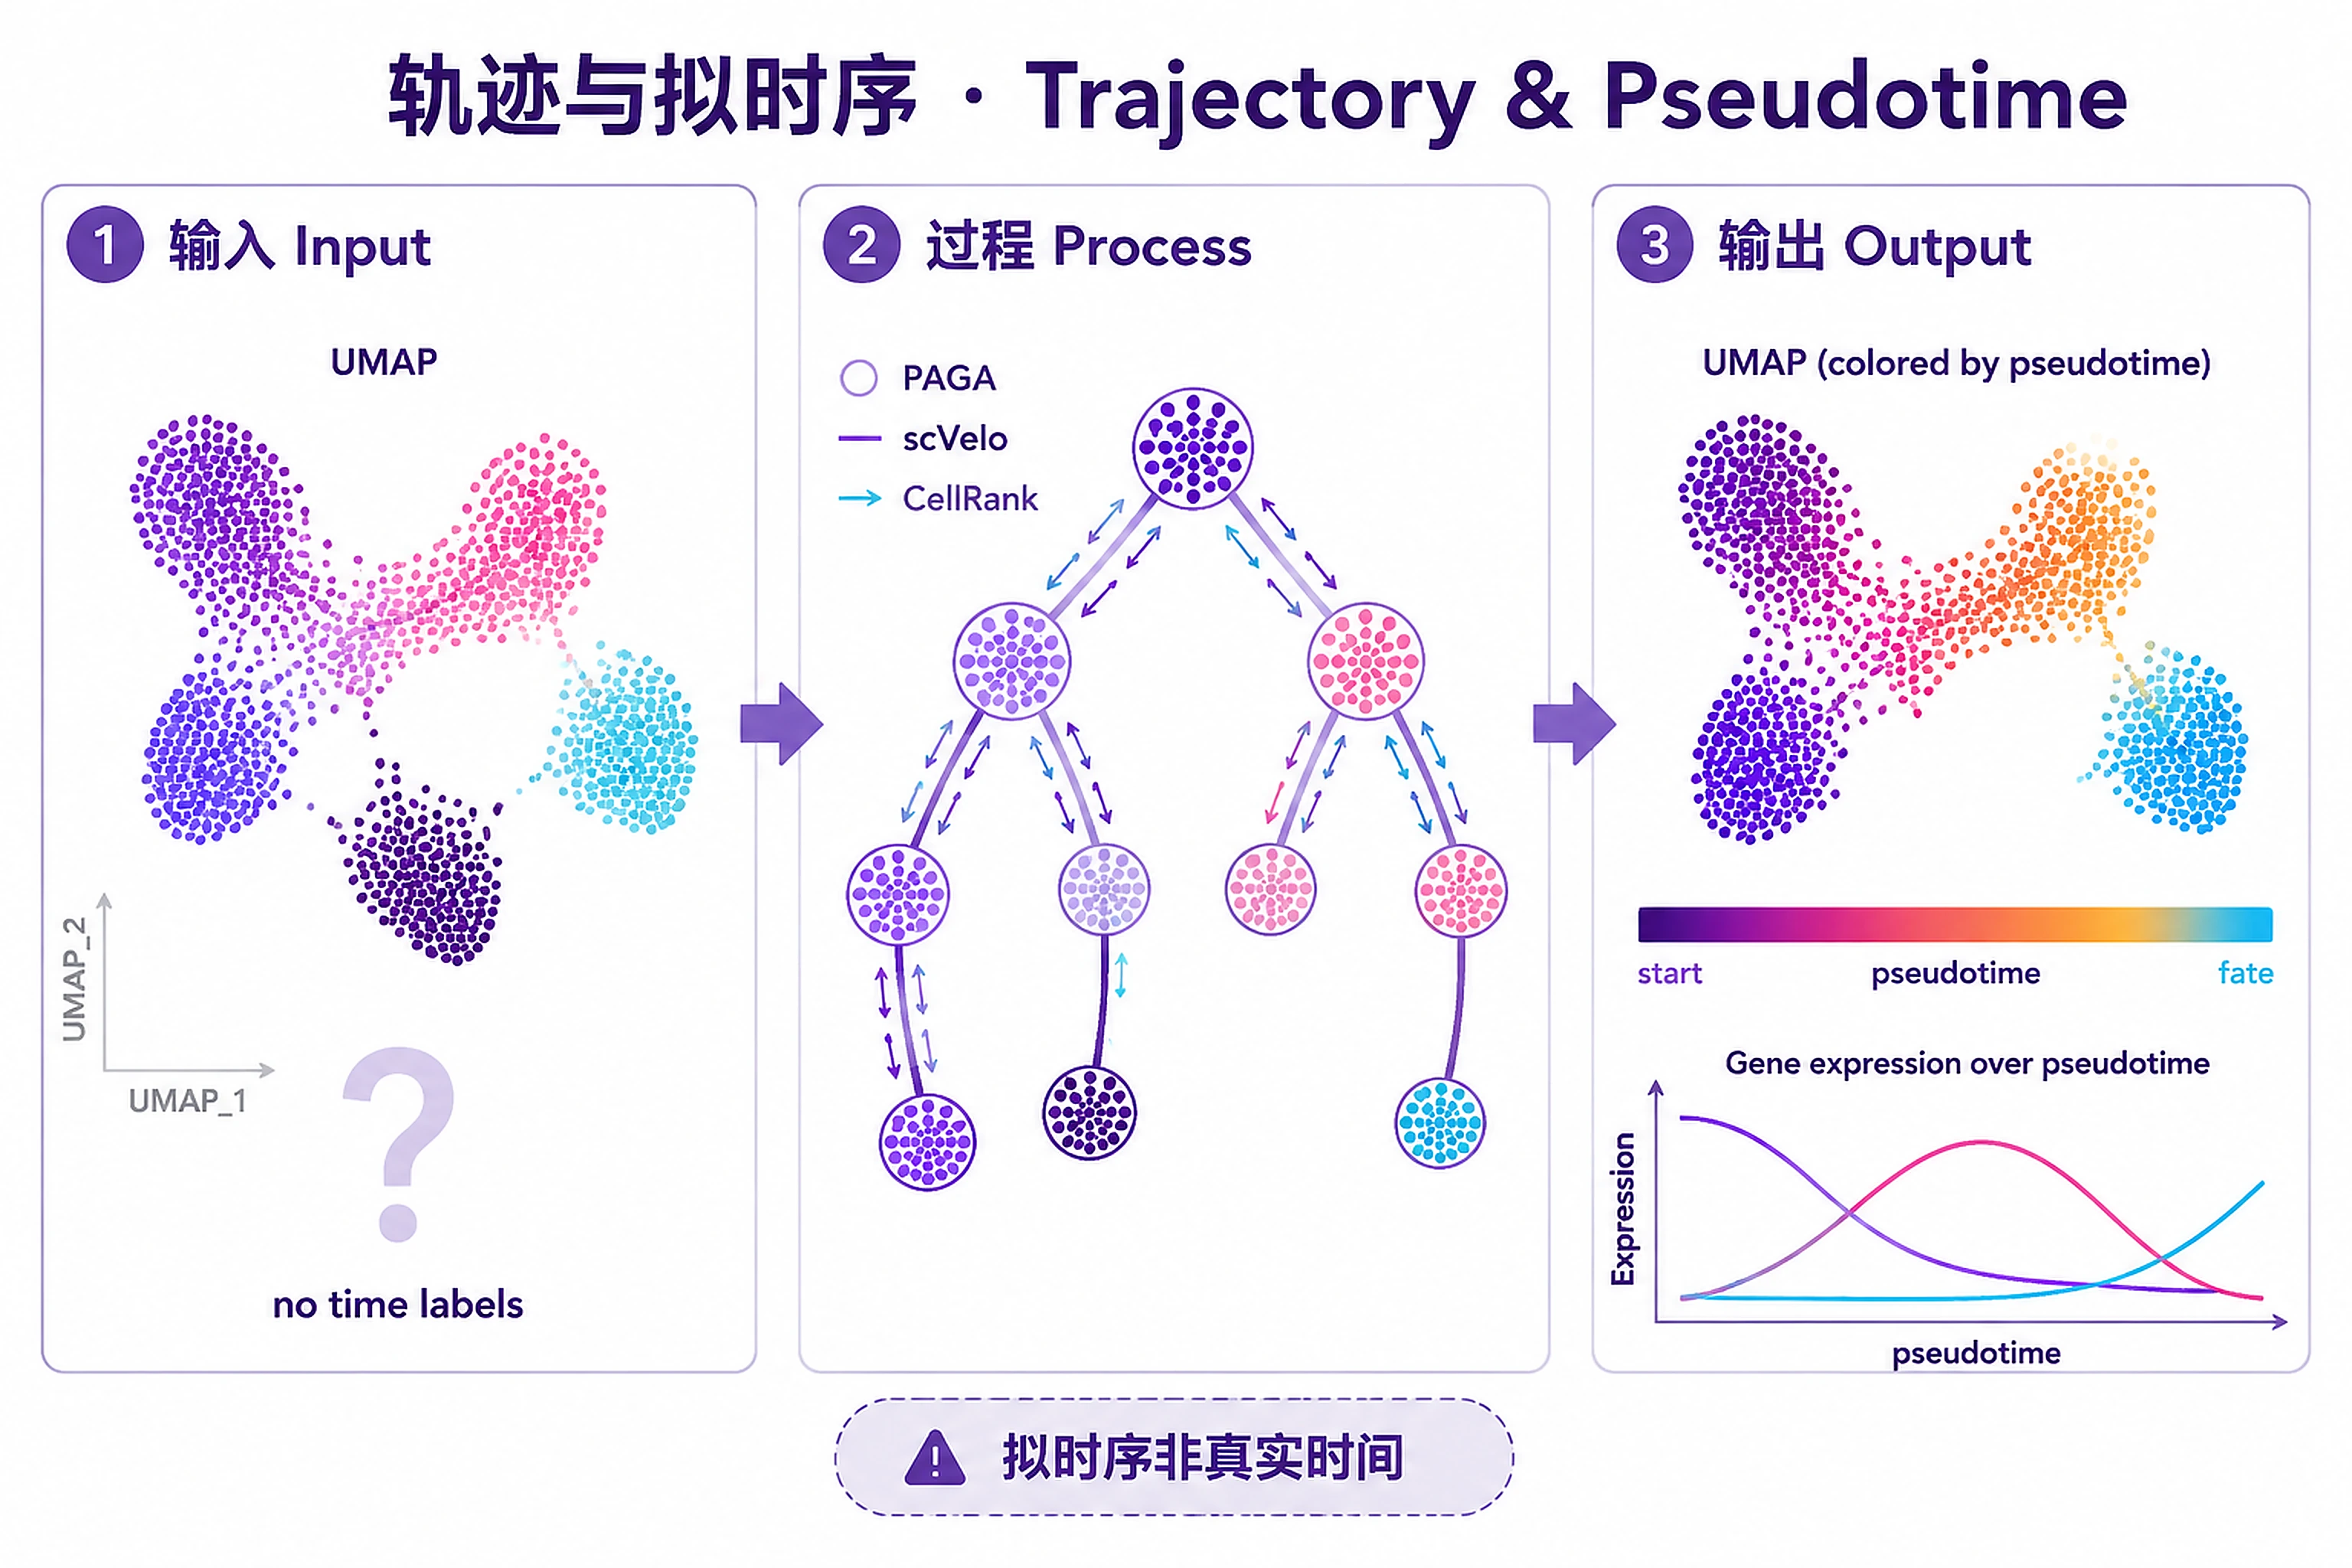
Problem. Infer cell ordering and fate without time labels.
Learning goals
- Pseudotime is relative, not real time
- RNA velocity rests on fragile assumptions
Figures
Tutorial
When to Use This Skill
Use when you have preprocessed scRNA-seq data and want to:
- ✅ Order cells along a differentiation or disease trajectory (pseudotime)
- ✅ Identify branching points and terminal cell fates
- ✅ Discover genes driving cell state transitions
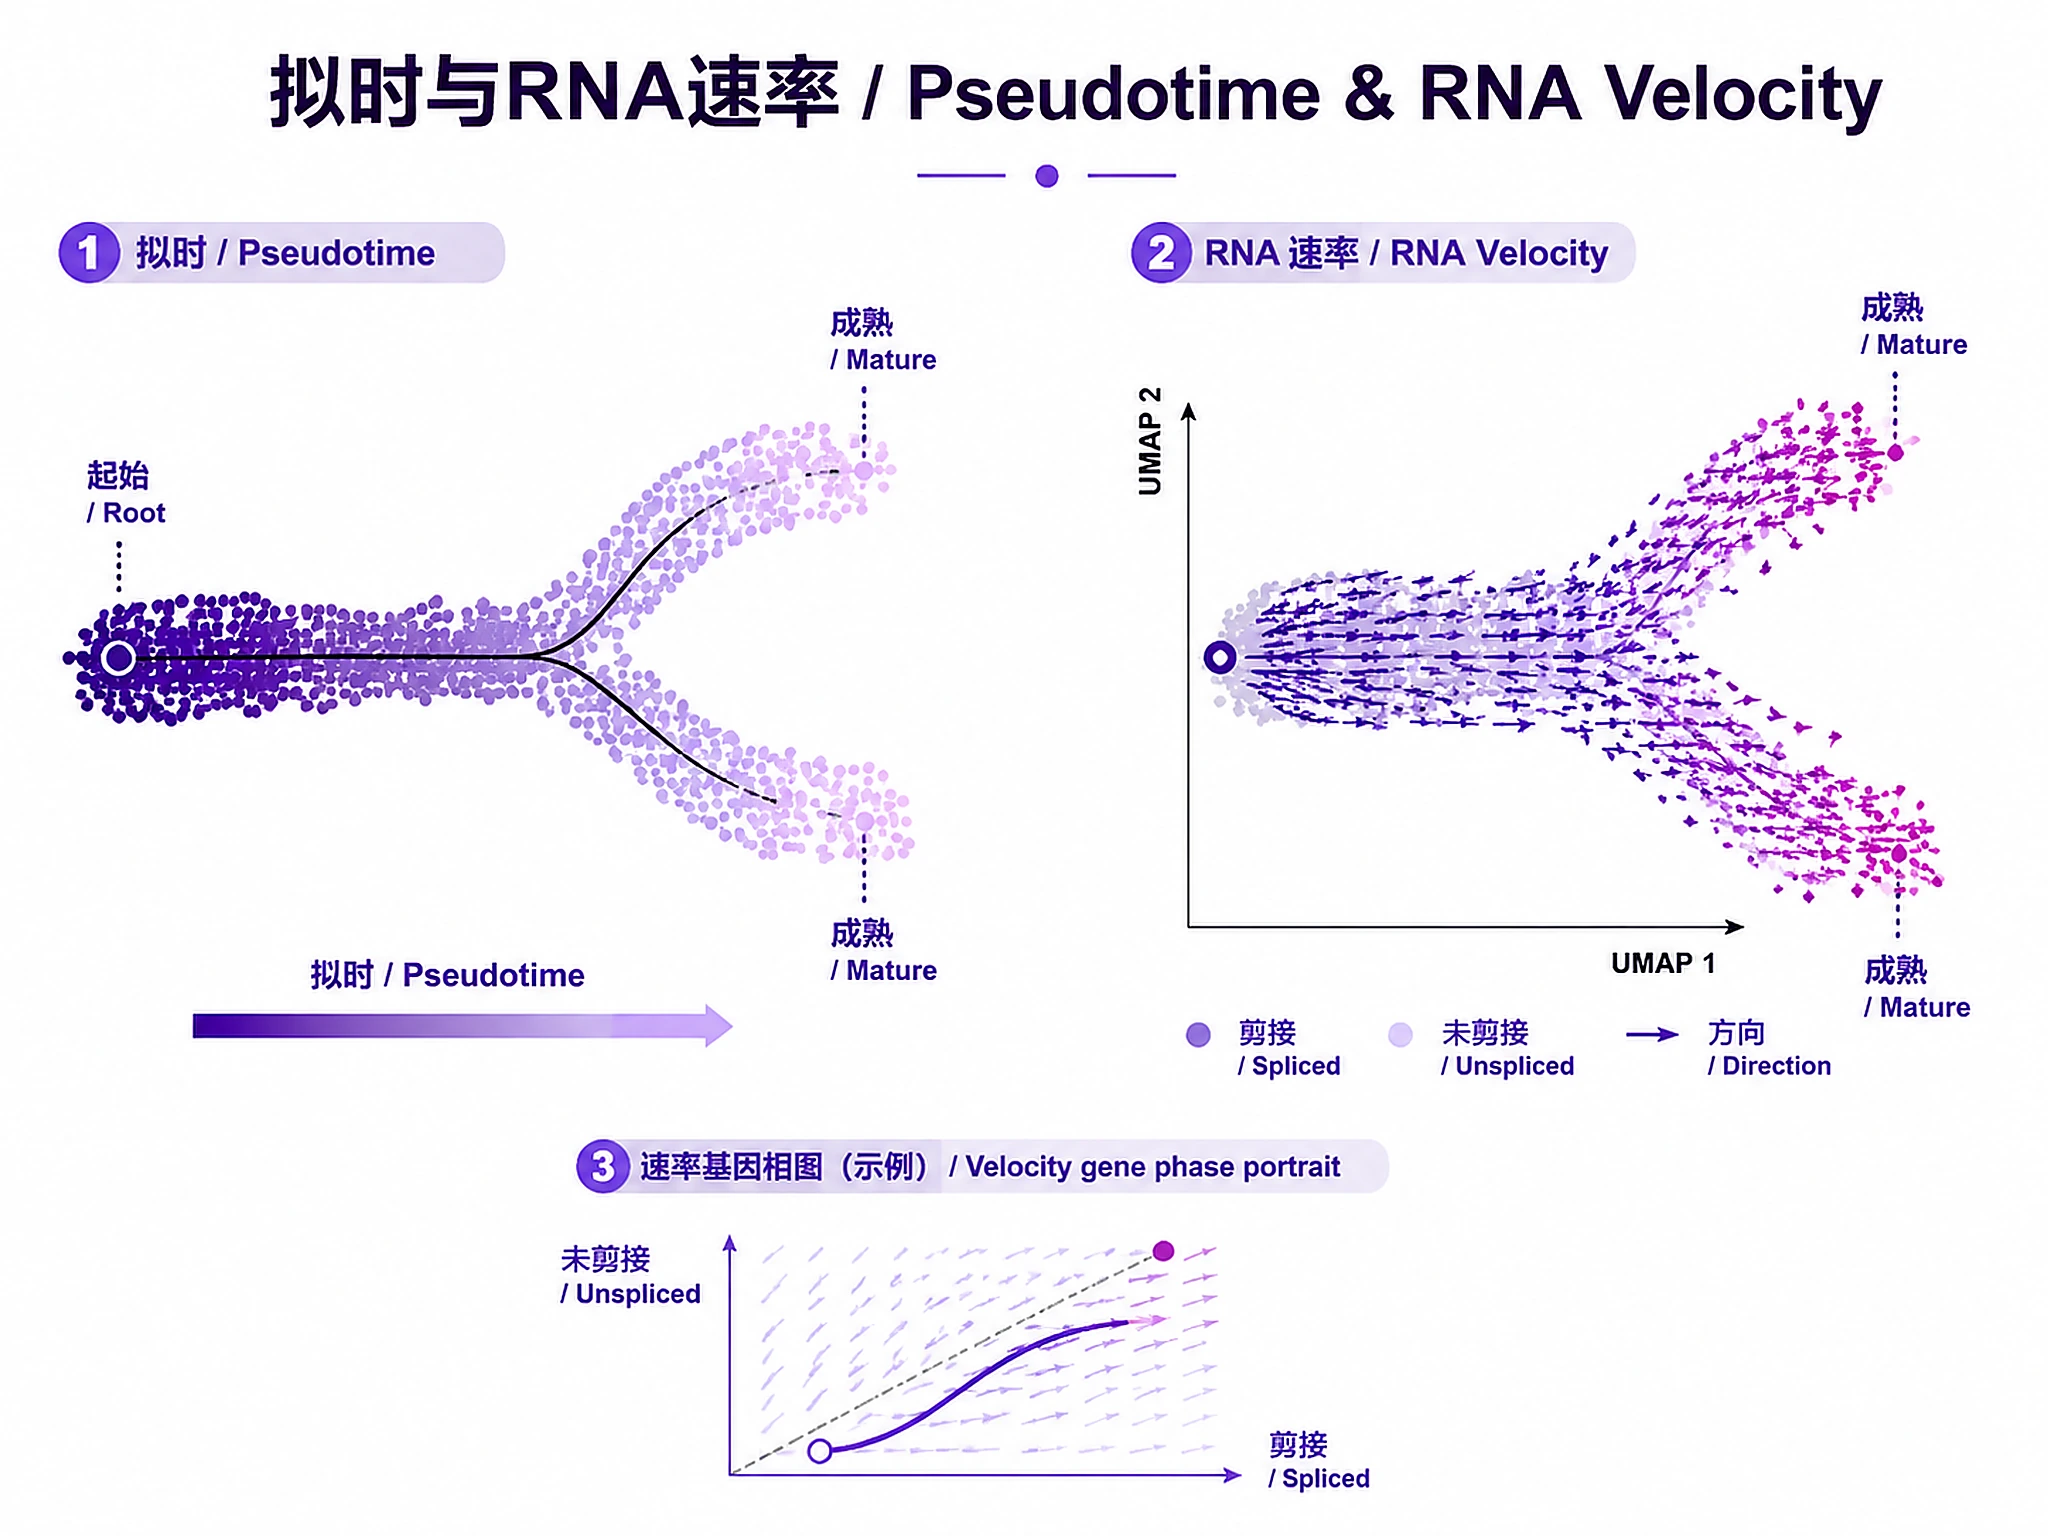
- ✅ Visualize RNA velocity (direction of cell state change)
- ✅ Compute cell fate probabilities with CellRank
- ✅ Chain from
scrnaseq-scanpy-core-analysisoutput
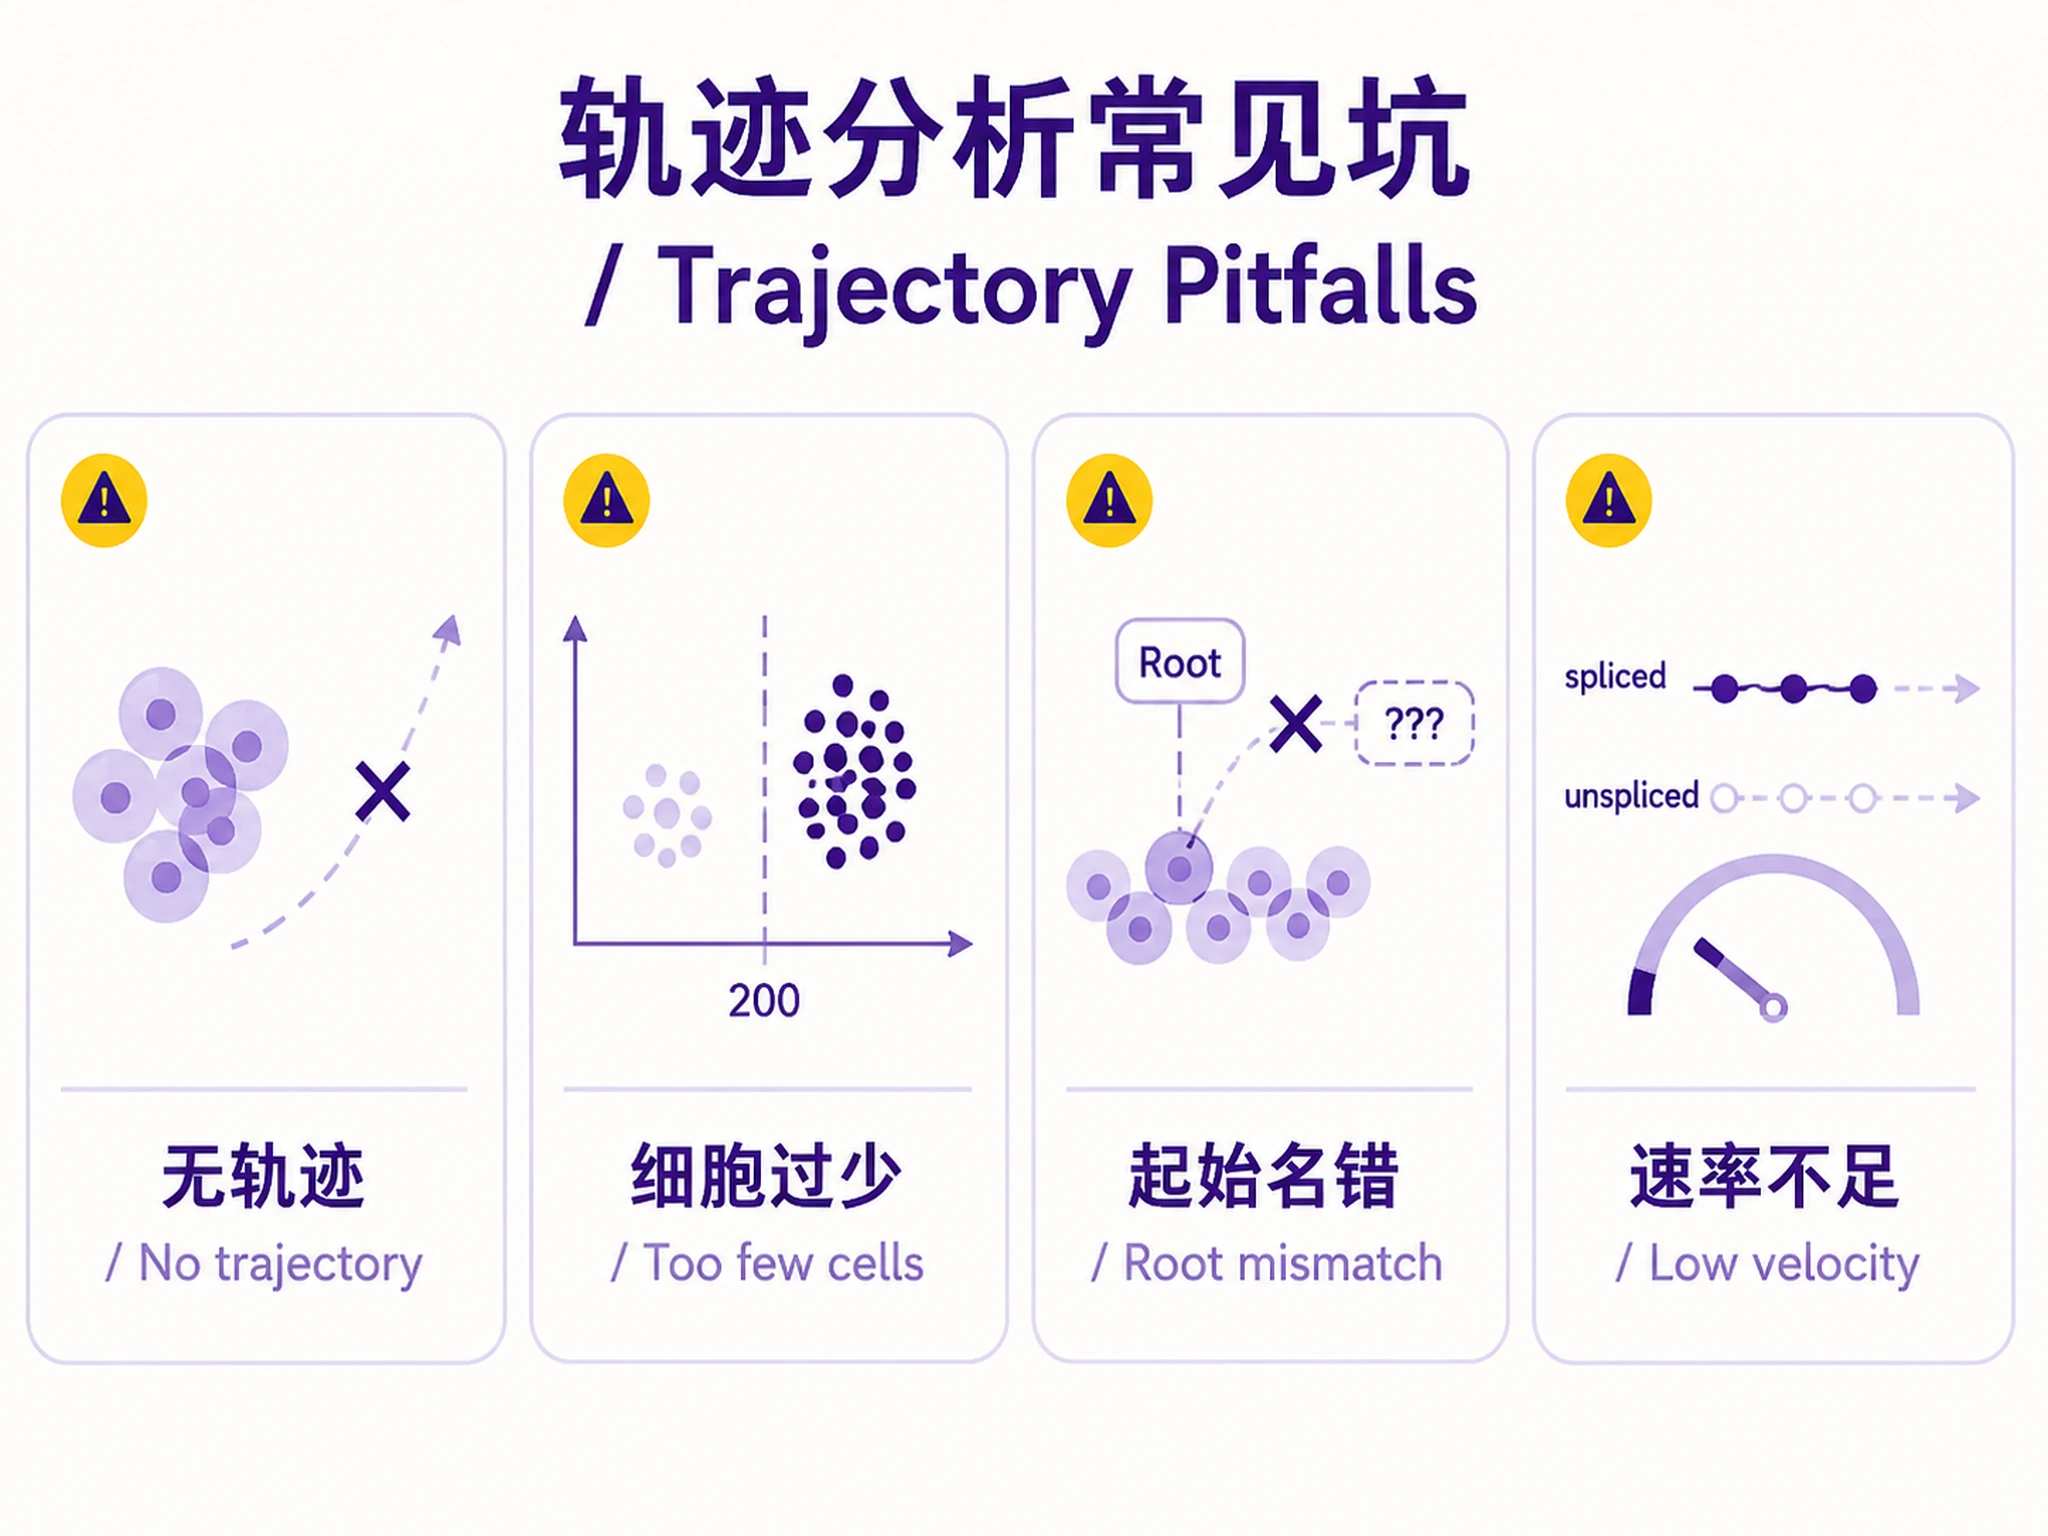
Do NOT use when:
- ❌ Data is not yet preprocessed (use
scrnaseq-scanpy-core-analysisfirst) - ❌ You have bulk RNA-seq (use
disease-progression-longitudinalinstead) - ❌ Cells are terminally differentiated with no trajectory (e.g., resting PBMCs)
- ❌ Fewer than 200 cells
Installation
pip install scanpy anndata scvelo cellrank numpy pandas matplotlib seaborn scipy statsmodels reportlab
| Package | Version | License | Commercial Use | Notes |
|---|---|---|---|---|
| scanpy | ≥1.9 | BSD-3 | ✅ Permitted | Core trajectory (PAGA, DPT) |
| anndata | ≥0.8 | BSD-3 | ✅ Permitted | Data container |
| scvelo | ≥0.2.5 | BSD-3 | ✅ Permitted | RNA velocity (optional but recommended) |
| cellrank | ≥2.0 | BSD-3 | ✅ Permitted | Fate mapping (optional) |
| matplotlib | ≥3.4 | PSF | ✅ Permitted | Plotting |
| seaborn | ≥0.11 | BSD-3 | ✅ Permitted | Statistical plotting, heatmaps |
| scipy | ≥1.7 | BSD-3 | ✅ Permitted | Statistics |
| statsmodels | ≥0.13 | BSD-3 | ✅ Permitted | FDR correction |
| reportlab | ≥3.6 | BSD | ✅ Permitted | PDF report (optional) |
Graceful degradation: Core analysis (PAGA + pseudotime) requires only scanpy. scVelo and CellRank are optional — scripts detect availability and skip gracefully.
Inputs
Required:
- Preprocessed AnnData (
.h5ad) with PCA, UMAP, and cluster annotations - Output from
scrnaseq-scanpy-core-analysis(adata_processed.h5ad) works directly - Must have ≥200 cells, ≥100 genes, cluster labels in
.obs
For RNA velocity (optional):
- Spliced/unspliced count layers (
adata.layers['spliced'],adata.layers['unspliced']) - Generated by STARsolo, Cell Ranger, or velocyto
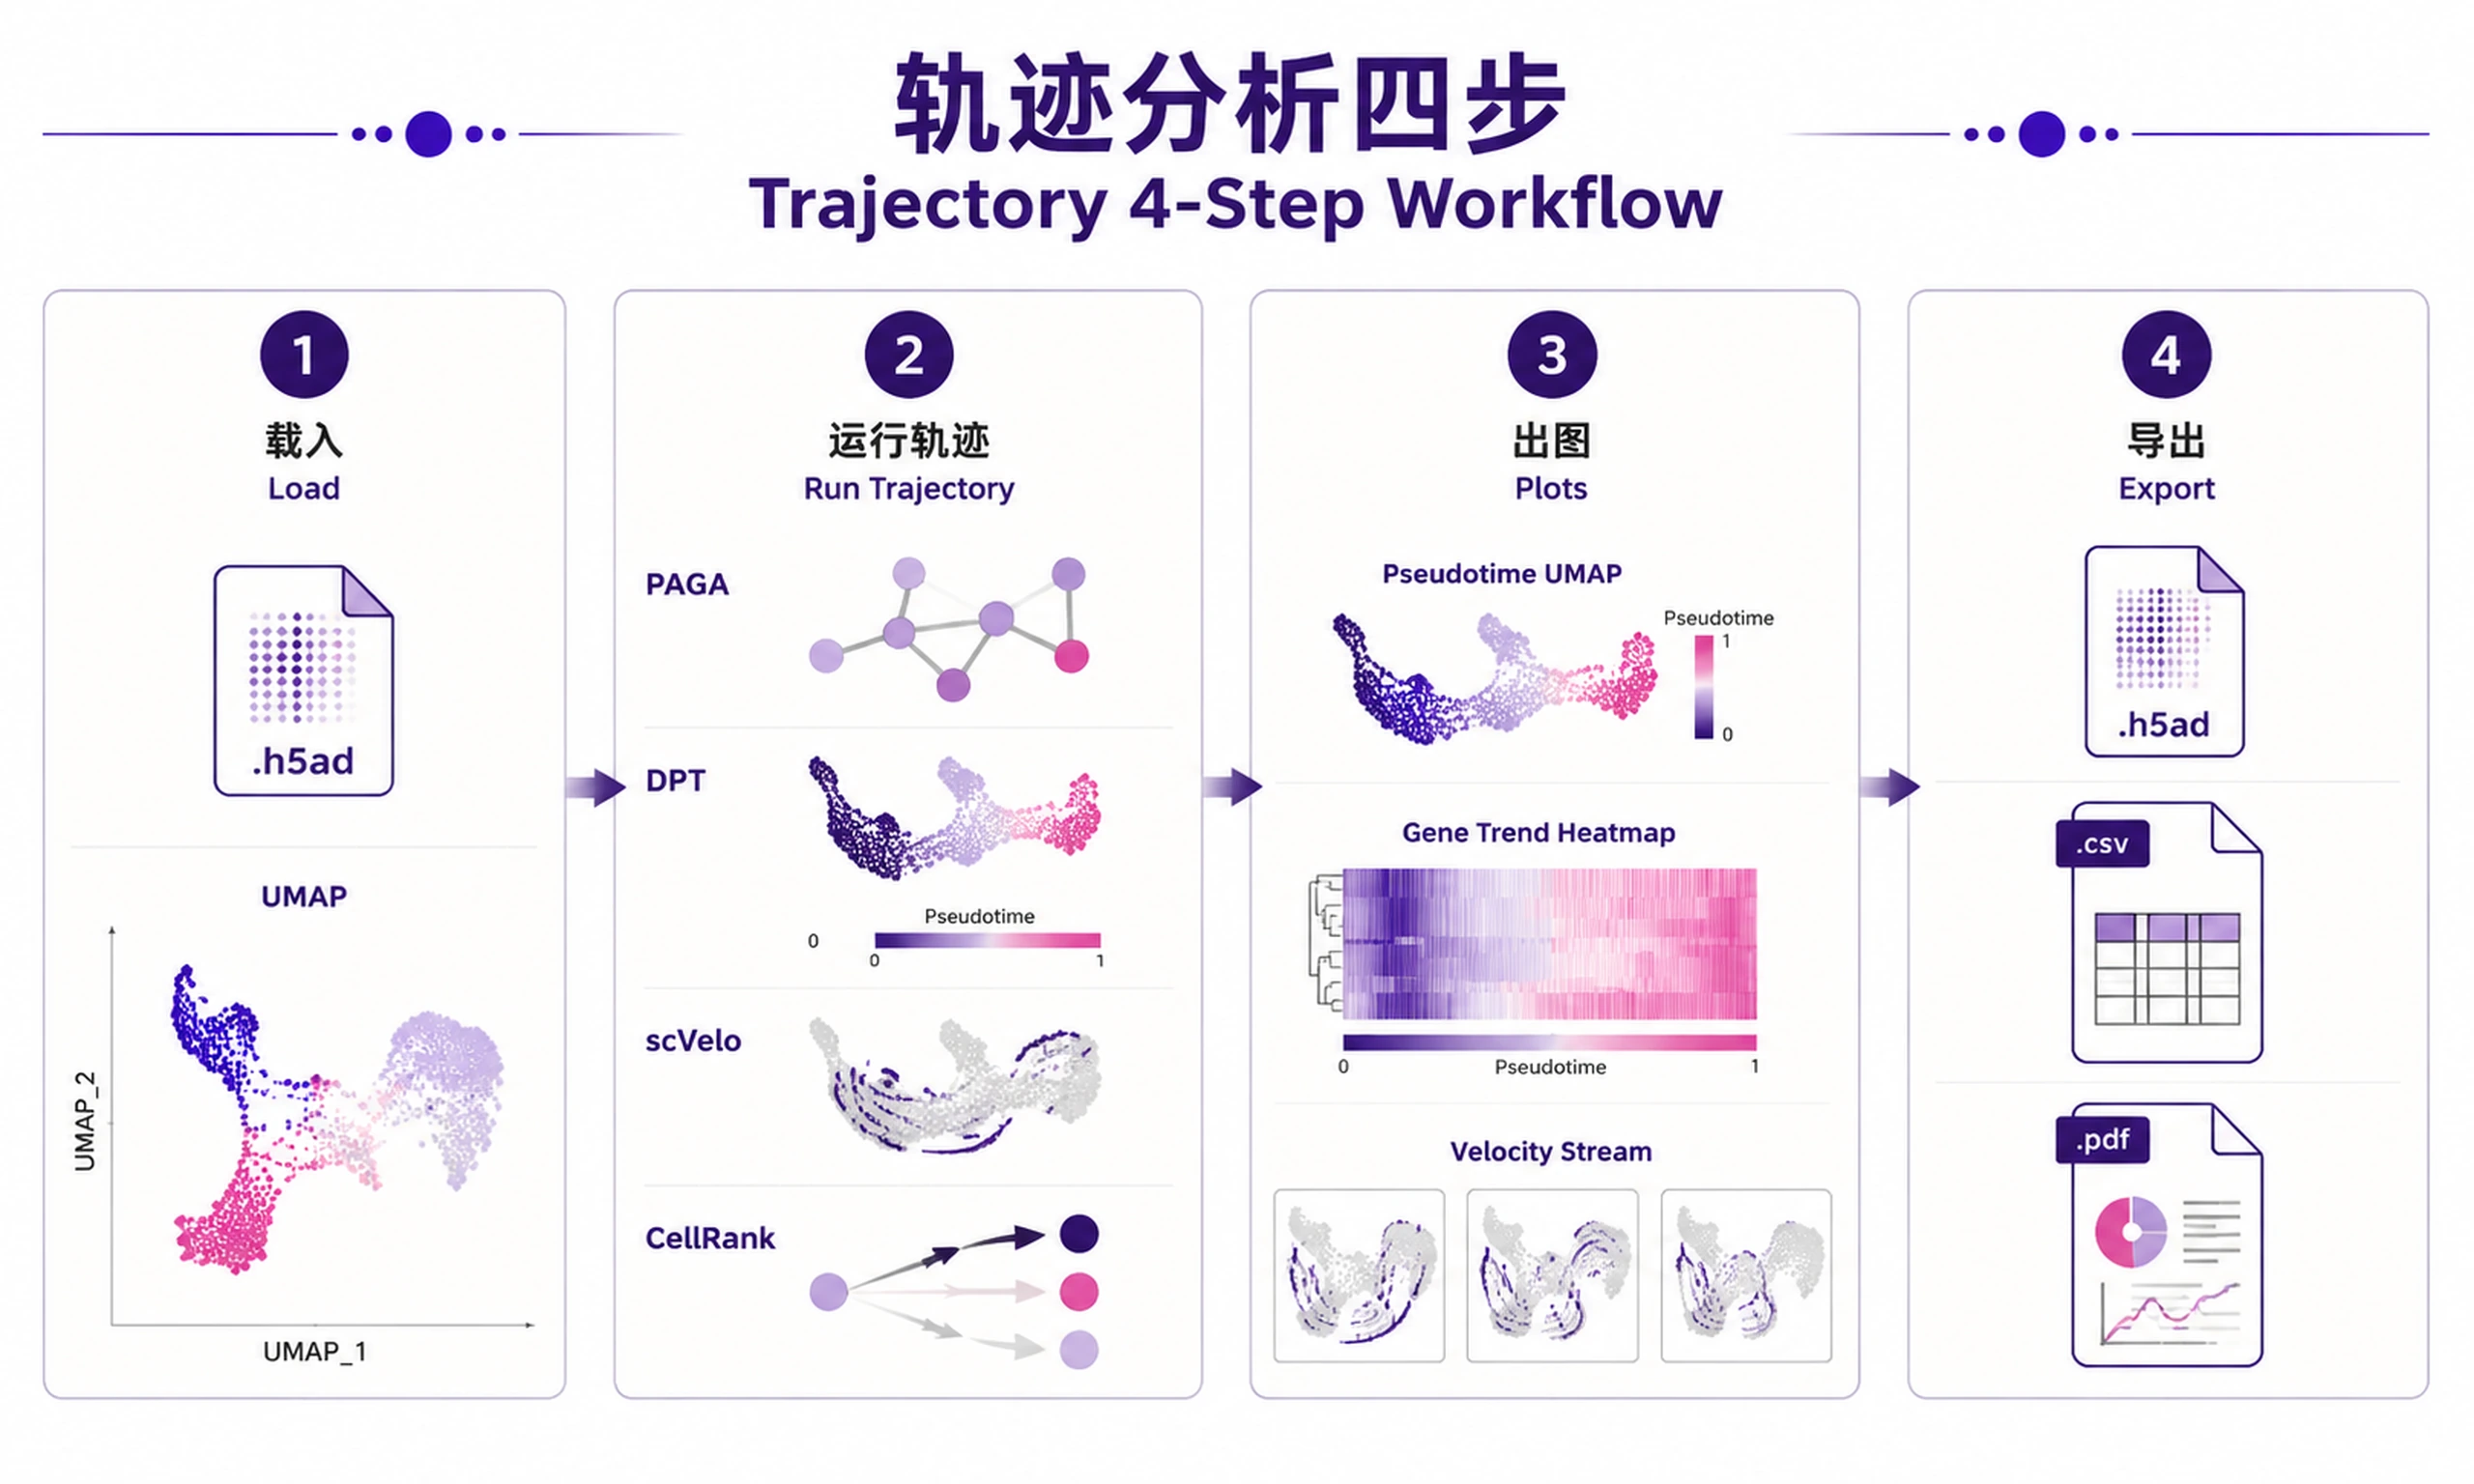
Outputs
Analysis objects (for downstream skills):
adata_trajectory.h5ad— AnnData with pseudotime, PAGA, diffusion map embedded- Load with:
adata = sc.read_h5ad('adata_trajectory.h5ad') - Required for: downstream enrichment, regulatory network analysis
trajectory_results.pkl— Full results dict (pseudotime, gene lists, model objects)- Load with:
results = pickle.loads(Path('trajectory_results.pkl').read_bytes())
Primary results (CSV):
pseudotime_assignments.csv— Cell barcode, pseudotime, cell typetrajectory_genes.csv— Genes correlated with pseudotime (gene, correlation, FDR, direction)velocity_genes.csv— Top RNA velocity genes (if scVelo ran)fate_probabilities.csv— Cell fate probabilities (if CellRank ran)driver_genes_*.csv— Driver genes per terminal fate (if CellRank ran)
Visualizations (PNG + SVG at 300 DPI):
paga_graph.png/.svg— PAGA cluster connectivity + UMAPpseudotime_umap.png/.svg— UMAP colored by pseudotimepseudotime_violin.png/.svg— Pseudotime distribution per cell typediffusion_components.png/.svg— Diffusion map componentsgene_heatmap.png/.svg— Top trajectory genes heatmapgene_trends.png/.svg— Gene expression trends along pseudotimepaga_connectivity.png/.svg— PAGA connectivity heatmapvelocity_stream.png/.svg— RNA velocity stream plot (if scVelo)velocity_confidence.png/.svg— Velocity confidence (if scVelo)latent_time.png/.svg— scVelo latent time (if dynamical model)velocity_top_genes.png/.svg— Phase portraits for top velocity genes (if scVelo)fate_probabilities.png/.svg— Cell fate UMAP (if CellRank)fate_heatmap.png/.svg— Fate probability heatmap (if CellRank)driver_genes.png/.svg— Top driver genes per terminal fate (if CellRank)
Reports:
trajectory_analysis_report.pdf— Publication-quality PDF (requires reportlab)trajectory_analysis_report.md— Markdown fallback reportanalysis_metadata.json— Parameters and quality metrics
Clarification Questions
🚨 ALWAYS ask Question 1 FIRST. Do not ask about analysis parameters before the user has answered Question 1.
1. Input Files (ASK THIS FIRST)
- Do you have a preprocessed scRNA-seq object (.h5ad)?
- If uploaded: Is this your processed AnnData file?
- Expected:
.h5adwith PCA, UMAP, and cluster annotations
- Or use example/demo data?
- Pancreatic endocrinogenesis (3,696 cells, branching trajectory into alpha/beta/delta/epsilon cells)
🚨 IF EXAMPLE DATA SELECTED: All parameters are pre-defined. Only ask Question 2. Then proceed to Step 1.
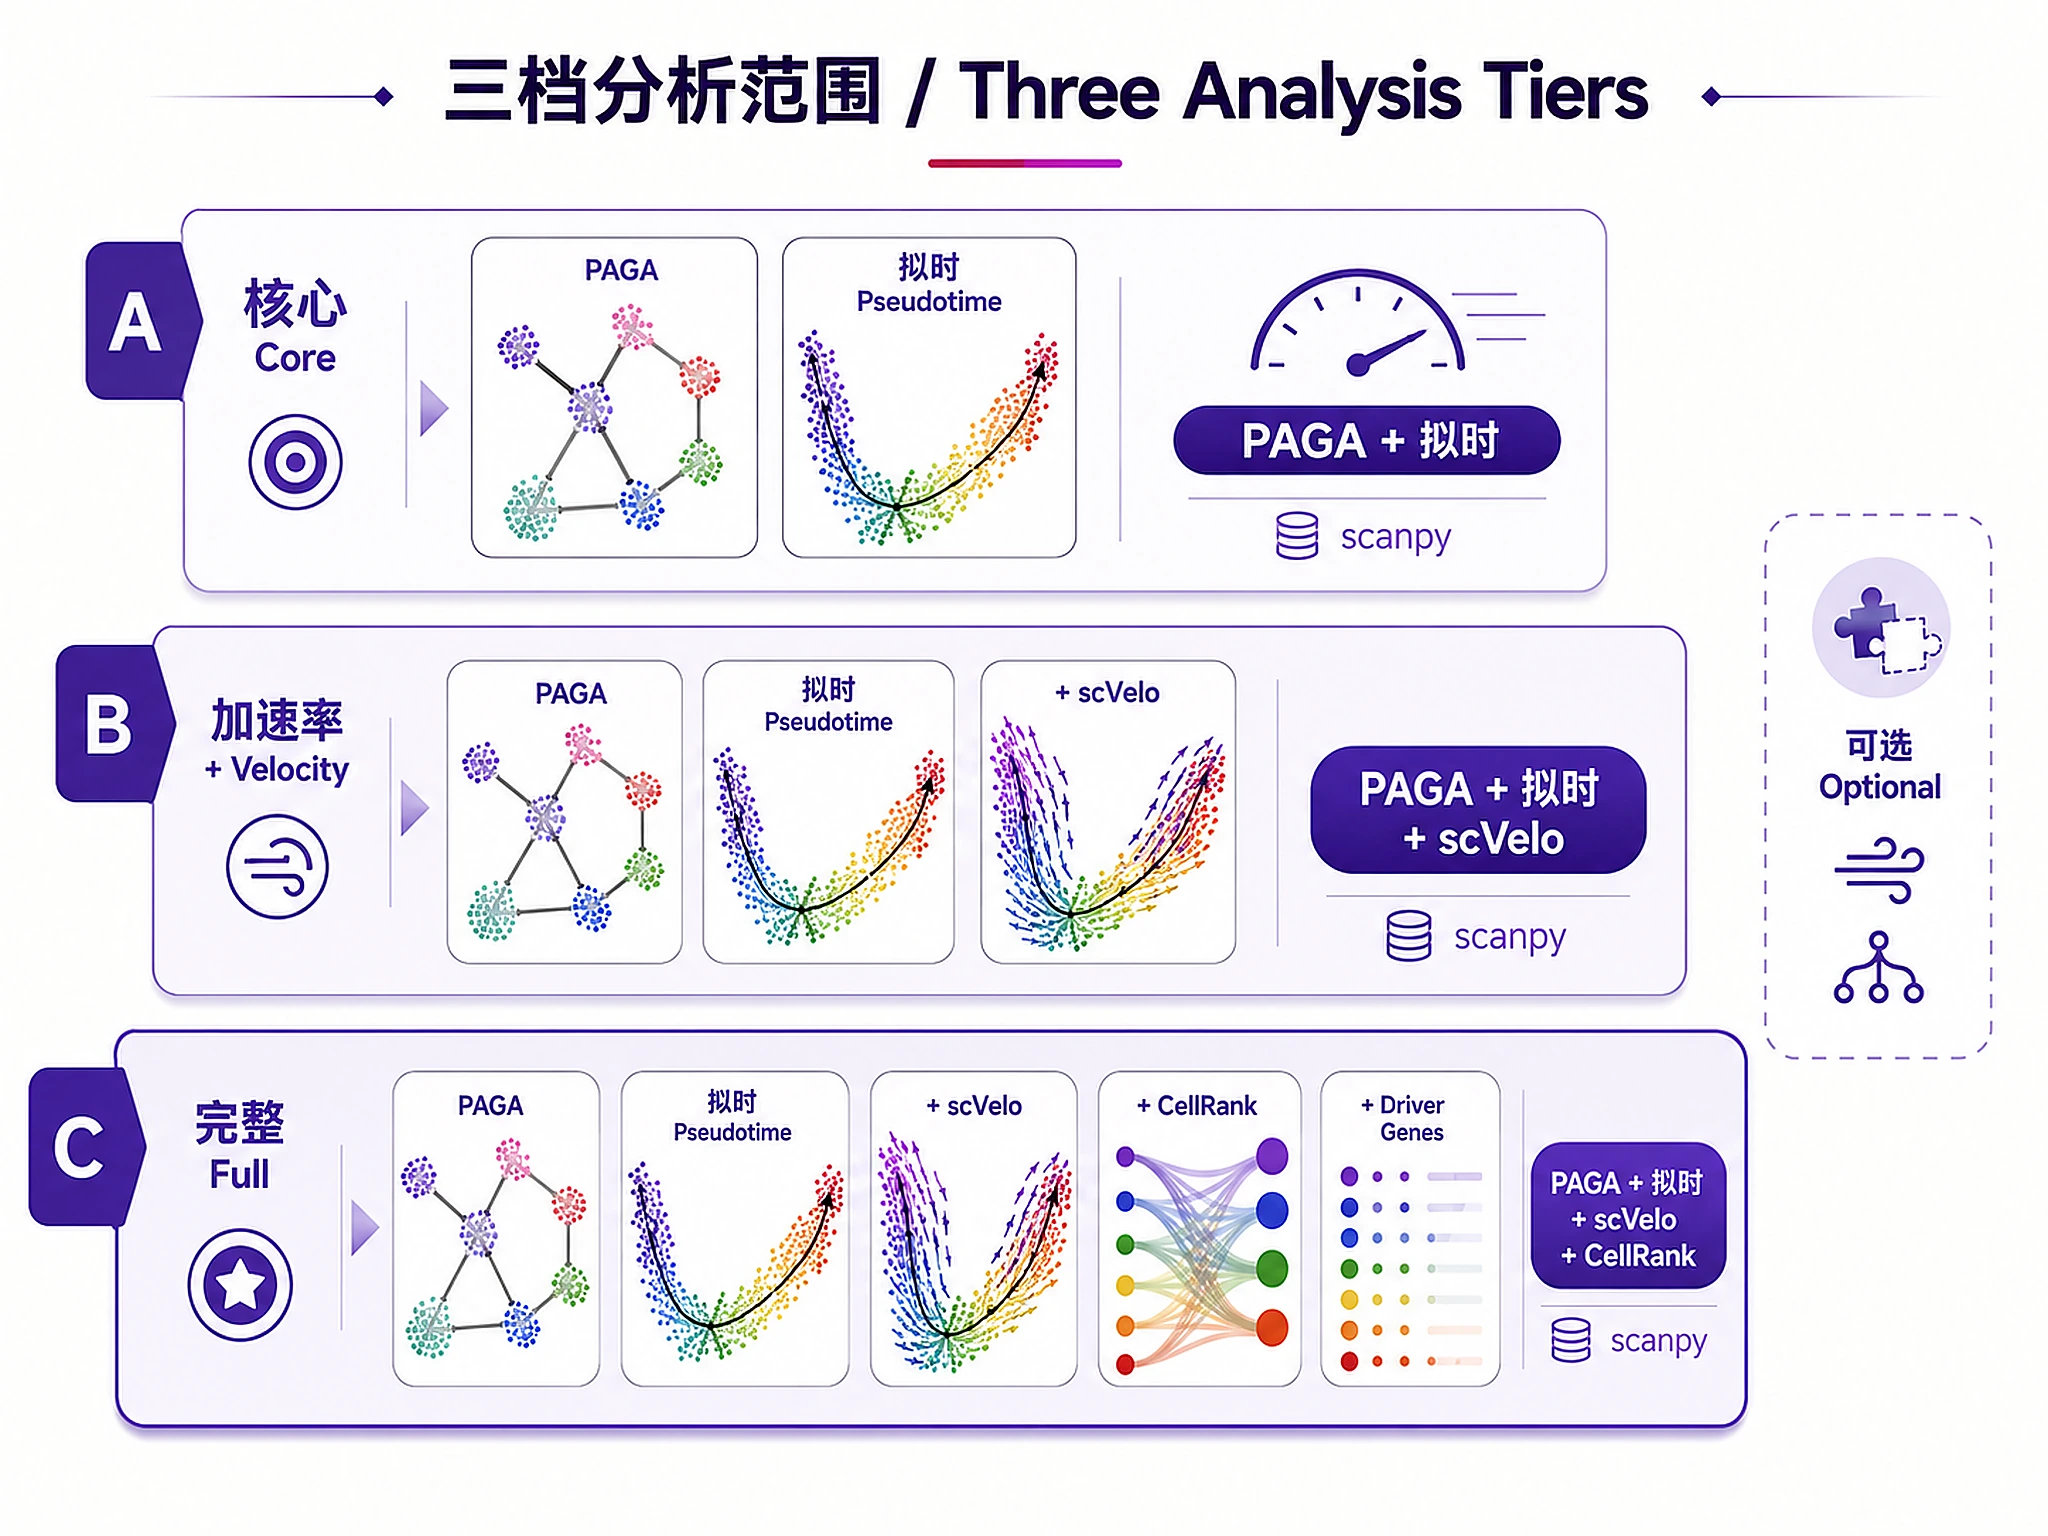
2. Analysis Scope (structured — works for both demo and user data)
- a) Core trajectory only — PAGA + pseudotime (~3 min)
- b) Core + RNA velocity — adds scVelo streams (~5 min) (recommended)
- c) Full analysis — adds CellRank fate mapping (~8 min)
Questions 3-5 are ONLY for users providing their own data:
3. Root Cell Type
- Which cell type represents the starting point of the trajectory?
- (For demo data: Ductal cells are the progenitors — pre-selected)
4. Cluster Key
- Which column in
.obscontains your cell type annotations? - Common:
clusters,cell_type,leiden,louvain
5. Expected Trajectory Structure
- a) Linear differentiation (one lineage)
- b) Branching (multiple fates from one progenitor)
- c) Not sure — let the data decide
Standard Workflow
🚨 MANDATORY: USE SCRIPTS EXACTLY AS SHOWN — DO NOT WRITE INLINE CODE 🚨
Step 1 — Load data:
from scripts.load_example_data import load_example_data
adata = load_example_data()
DO NOT write inline data loading code. Just use the script.
✅ VERIFICATION: You MUST see: "✓ Data loaded successfully!"
Step 2 — Run trajectory analysis:
from scripts.run_trajectory_analysis import run_trajectory
results = run_trajectory(adata, root_cell_type="Ductal", cluster_key="clusters")
DO NOT write inline trajectory code. Just use the script.
✅ VERIFICATION: You MUST see: "✓ Trajectory analysis completed successfully!"
Step 3 — Generate visualizations:
from scripts.generate_all_plots import generate_all_plots
generate_all_plots(adata, results, output_dir="trajectory_results", cluster_key="clusters")
DO NOT write inline plotting code. Just use the script.
✅ VERIFICATION: You MUST see: "✓ All plots generated successfully!"
Step 4 — Export results:
from scripts.export_results import export_all
export_all(adata, results, output_dir="trajectory_results")
DO NOT write custom export code. Use export_all().
✅ VERIFICATION: You MUST see: "=== Export Complete ==="
⚠️ CRITICAL — DO NOT:
- ❌ Write inline data loading code → STOP: Use
load_example_data()orload_user_data() - ❌ Write inline PAGA/DPT/scVelo code → STOP: Use
run_trajectory() - ❌ Write inline plotting code (plt.savefig, sc.pl, etc.) → STOP: Use
generate_all_plots() - ❌ Write custom export code → STOP: Use
export_all()
⚠️ IF SCRIPTS FAIL — Script Failure Hierarchy:
- Fix and Retry (90%) — Install missing package, re-run script
- Modify Script (5%) — Edit the script file itself, document changes
- Use as Reference (4%) — Read script, adapt approach, cite source
- Write from Scratch (1%) — Only if genuinely impossible, explain why
NEVER skip directly to writing inline code without trying the script first.
Common Issues
| Error | Cause | Solution |
|---|---|---|
| "Root cell type not found" | Cluster name mismatch | Check adata.obs['clusters'].unique() for exact names |
| "scvelo not installed" | Missing optional dependency | pip install scvelo — or skip velocity (core trajectory still works) |
| "cellrank not installed" | Missing optional dependency | pip install cellrank — or skip fate mapping |
| scVelo dynamical model fails | Insufficient spliced/unspliced counts | Script auto-falls back to stochastic model |
| SVG export failed | Missing system library | Normal — PNG still generated. Script handles fallback. |
| "Too few cells" | Dataset too small | Need ≥200 cells for meaningful trajectory |
| CellRank terminal states incorrect | Auto-detection picked wrong states | Check PAGA graph to verify expected terminal fates |
Suggested Next Steps
-
Functional enrichment → Use
functional-enrichment-from-degsskill- Input:
trajectory_genes.csv(top up/down genes along pseudotime) - Find pathways driving differentiation
- Input:
-
Gene regulatory networks → Use
grn-pyscenicskill- Input:
adata_trajectory.h5ad - Identify transcription factors controlling cell fate decisions
- Input:
-
Upstream regulator analysis → Use
upstream-regulator-analysisskill- Input:
trajectory_genes.csv - Predict upstream regulators of trajectory dynamics
- Input:
-
Differential expression at branch points → Use
scrnaseq-scanpy-core-analysis(marker finding)- Compare cells at branch points to identify fate-determining genes
Related Skills
Upstream (data generation):
scrnaseq-scanpy-core-analysis— Preprocessing, clustering, UMAP → feeds.h5adinto this skillscrnaseq-seurat-core-analysis— R alternative (convert with SeuratDisk)
Downstream (interpretation):
functional-enrichment-from-degs— Pathway analysis of trajectory genesgrn-pyscenic— Gene regulatory networksupstream-regulator-analysis— Upstream regulators of trajectory genes
Alternative trajectory methods:
disease-progression-longitudinal— Bulk/multi-omics longitudinal trajectories (TimeAx)
References
Primary Citations
-
PAGA: Wolf FA, Hamey FK, Plass M, et al. PAGA: graph abstraction reconciles clustering with trajectory inference through a topology preserving map of single cells. Genome Biol. 2019;20:59.
-
Diffusion Pseudotime: Haghverdi L, Büttner M, Wolf FA, et al. Diffusion pseudotime robustly reconstructs lineage branching. Nat Methods. 2016;13:845-848.
-
scVelo: Bergen V, Lange M, Peidli S, et al. Generalizing RNA velocity to transient cell states through dynamical modeling. Nat Biotechnol. 2020;38:1408-1414.
-
CellRank: Lange M, Bergen V, Klein M, et al. CellRank for directed single-cell fate mapping. Nat Methods. 2022;19:159-170.
-
Example dataset: Bastidas-Ponce A, Tritschler S, Dony L, et al. Comprehensive single cell mRNA profiling reveals a detailed roadmap for pancreatic endocrinogenesis. Development. 2019;146:dev173849.
Software
| Software | Version | License | Commercial Use |
|---|---|---|---|
| scanpy | ≥1.9 | BSD-3 | ✅ Permitted |
| scVelo | ≥0.2.5 | BSD-3 | ✅ Permitted |
| CellRank | ≥2.0 | BSD-3 | ✅ Permitted |
| seaborn | ≥0.11 | BSD-3 | ✅ Permitted |
| reportlab | ≥3.6 | BSD | ✅ Permitted |
Code preview
scripts/export_results.py
"""
Export all trajectory inference results to standard formats.

Saves analysis objects (h5ad, pickle) for downstream skills and exports
results to CSV/markdown/PDF formats for human analysis.

Usage:
  from scripts.export_results import export_all
  export_all(adata, results, output_dir="trajectory_results")
"""

import json
import os
import pickle
from datetime import datetime
from pathlib import Path

import numpy as np
import pandas as pd


def export_all(adata, results, output_dir="trajectory_results"):
    """
    Export all trajectory results to h5ad, pickle, CSV, and report formats.

    Parameters
    ----------
    adata : AnnData
        AnnData with trajectory analysis results embedded.
    results : dict
        Output from run_trajectory().
    output_dir : str
        Directory to save outputs.
    """
    output_dir = Path(output_dir)
    output_dir.mkdir(parents=True, exist_ok=True)

    print("\nExporting trajectory results...")

    # 1. Save AnnData with trajectory annotations
    print("  Saving AnnData object...")
    h5ad_path = output_dir / "adata_trajectory.h5ad"
    _save_h5ad(adata, h5ad_path)
    print(f"   Saved: {h5ad_path}")
    print(f"   (Load with: adata = sc.read_h5ad('{h5ad_path}'))")

    # 2. Save trajectory results as pickle (for downstream skills)
    print("  Saving trajectory results object...")
    pkl_path = output_dir / "trajectory_results.pkl"
    # Strip non-serializable items
    pkl_results = _make_serializable(results)
    with open(pkl_path, "wb") as f:
        pickle.dump(pkl_results, f, protocol=pickle.HIGHEST_PROTOCOL)
    print(f"   Saved: {pkl_path}")
    print(f"   (Load with: results = pickle.loads(Path('{pkl_path}').read_bytes()))")

    # 3. Export pseudotime assignments
    print("  Exporting pseudotime assignments...")
    pseudotime = results.get("pseudotime")
    if pseudotime is not None:
        pt_df = pd.DataFrame({
            "cell_id": pseudotime.index,
            "pseudotime": pseudotime.values,
        })
        # Add cluster info if available
        params = results.get("parameters", {})
        cluster_key = params.get("cluster_key", "clusters")
        if cluster_key in adata.obs.columns:
            pt_df["cell_type"] = adata.obs[cluster_key].values
        pt_path = output_dir / "pseudotime_assignments.csv"
        pt_df.to_csv(pt_path, index=False)
        print(f"   Saved: {pt_path} ({len(pt_df)} cells)")

    # 4. Export trajectory genes
    print("  Exporting trajectory genes...")
    traj_genes = results.get("trajectory_genes")
    if traj_genes is not None and len(traj_genes) > 0:
        genes_path = output_dir / "trajectory_genes.csv"
        traj_genes.to_csv(genes_path, index=False)
        print(f"   Saved: {genes_path} ({len(traj_genes)} genes)")
scripts/generate_all_plots.py
"""
Generate all trajectory visualizations.

Produces 12-15 publication-quality plots across three analysis levels:
  Core: PAGA graph, pseudotime UMAP, violin, diffusion components, gene heatmap, gene trends
  Velocity: stream UMAP, confidence, latent time, top velocity genes
  CellRank: fate probabilities UMAP, fate heatmap, driver genes

All custom plots use seaborn with sns.set_style("ticks") + Helvetica.
scanpy/scVelo native plots (sc.pl.*, scv.pl.*) use their own rendering.
Heatmaps use seaborn.clustermap() per project standard.
All saved as PNG (300 DPI) + SVG with graceful fallback.

Usage:
  from scripts.generate_all_plots import generate_all_plots
  generate_all_plots(adata, results, output_dir="trajectory_results")
"""

import os
import warnings
from pathlib import Path

import numpy as np
import pandas as pd
import matplotlib
matplotlib.use("Agg")
import matplotlib.pyplot as plt
import seaborn as sns

# Project plotting standard
sns.set_style("ticks")
plt.rcParams["font.family"] = "sans-serif"
plt.rcParams["font.sans-serif"] = ["Helvetica"]
plt.rcParams["figure.dpi"] = 300


def generate_all_plots(adata, results, output_dir="trajectory_results", cluster_key="clusters"):
    """
    Generate all trajectory visualizations.

    Parameters
    ----------
    adata : AnnData
        AnnData with trajectory results computed.
    results : dict
        Output from run_trajectory().
    output_dir : str
        Directory to save plots.
    cluster_key : str
        Column in adata.obs with cluster labels.
    """
    output_dir = Path(output_dir)
    output_dir.mkdir(parents=True, exist_ok=True)

    print("=" * 60)
    print("GENERATING TRAJECTORY VISUALIZATIONS")
    print("=" * 60)

    n_plots = 0

    # =====================================================================
    # Core trajectory plots (always generated)
    # =====================================================================
    print("\n--- Core Trajectory Plots ---")

    # 1. PAGA graph
    try:
        _plot_paga(adata, cluster_key, output_dir)
        n_plots += 1
    except Exception as e:
        print(f"  Warning: PAGA plot failed: {e}")

    # 2. Pseudotime UMAP
    try:
        _plot_pseudotime_umap(adata, cluster_key, output_dir)
        n_plots += 1
    except Exception as e:
        print(f"  Warning: Pseudotime UMAP failed: {e}")

    # 3. Pseudotime violin
scripts/generate_report.py
"""
Generate a structured PDF analysis report for trajectory inference.

Creates a publication-quality PDF with Introduction, Methods, Results
(with embedded figures), and Conclusions sections using reportlab.

Requires: reportlab (pip install reportlab)
Falls back gracefully if reportlab is not installed.
"""

import os
from datetime import datetime

try:
    from reportlab.lib import colors
    from reportlab.lib.pagesizes import letter
    from reportlab.lib.styles import getSampleStyleSheet, ParagraphStyle
    from reportlab.lib.units import inch
    from reportlab.lib.enums import TA_CENTER
    from reportlab.platypus import (
        SimpleDocTemplate, Paragraph, Spacer, Table, TableStyle,
        Image, PageBreak, HRFlowable,
    )
    HAS_REPORTLAB = True
except ImportError:
    HAS_REPORTLAB = False


# ---------------------------------------------------------------------------
# Color constants
# ---------------------------------------------------------------------------
if HAS_REPORTLAB:
    COLOR_PRIMARY = colors.HexColor("#1B4F72")
    COLOR_ACCENT = colors.HexColor("#E74C3C")
    COLOR_DARK = colors.HexColor("#2C3E50")
    COLOR_LIGHT_GRAY = colors.HexColor("#F2F3F4")
    COLOR_MEDIUM_GRAY = colors.HexColor("#BDC3C7")


# ---------------------------------------------------------------------------
# Style helpers
# ---------------------------------------------------------------------------

def _build_styles():
    """Create custom paragraph styles for the report."""
    styles = getSampleStyleSheet()

    styles.add(ParagraphStyle(
        "ReportTitle", parent=styles["Title"],
        fontSize=24, textColor=COLOR_PRIMARY, spaceAfter=6,
        alignment=TA_CENTER, fontName="Helvetica-Bold",
    ))
    styles.add(ParagraphStyle(
        "ReportSubtitle", parent=styles["Normal"],
        fontSize=12, textColor=COLOR_DARK, spaceAfter=20,
        alignment=TA_CENTER, fontName="Helvetica",
    ))
    styles.add(ParagraphStyle(
        "SectionHeading", parent=styles["Heading1"],
        fontSize=16, textColor=COLOR_PRIMARY, spaceBefore=18,
        spaceAfter=8, fontName="Helvetica-Bold",
    ))
    styles.add(ParagraphStyle(
        "SubHeading", parent=styles["Heading2"],
        fontSize=13, textColor=COLOR_DARK, spaceBefore=12,
        spaceAfter=6, fontName="Helvetica-Bold",
    ))
    styles.add(ParagraphStyle(
        "ReportBody", parent=styles["Normal"],
        fontSize=10, textColor=COLOR_DARK, spaceAfter=6,
        leading=14, fontName="Helvetica",
    ))
    styles.add(ParagraphStyle(
        "StatNumber", parent=styles["Normal"],
        fontSize=28, textColor=COLOR_ACCENT, alignment=TA_CENTER,
        spaceAfter=2, fontName="Helvetica-Bold",
    ))
    styles.add(ParagraphStyle(
        "StatLabel", parent=styles["Normal"],
        fontSize=9, textColor=COLOR_DARK, alignment=TA_CENTER,
Companion files
| Type | Path | Bytes |
|---|---|---|
| Markdown | references/cellrank-guide.md | 2,935 |
| Markdown | references/rna-velocity-guide.md | 3,155 |
| Markdown | references/trajectory-methods-guide.md | 3,502 |
| Markdown | references/troubleshooting.md | 4,405 |
| Python | scripts/export_results.py | 13,014 |
| Python | scripts/generate_all_plots.py | 25,356 |
| Python | scripts/generate_report.py | 17,809 |
| Python | scripts/load_example_data.py | 5,700 |
| Python | scripts/run_trajectory_analysis.py | 17,005 |
| Markdown | SKILL.md | 11,298 |
| JSON | skill.meta.json | 2,217 |