Mendelian Randomization
Genetic variants as instruments to infer causal effects.
Overview
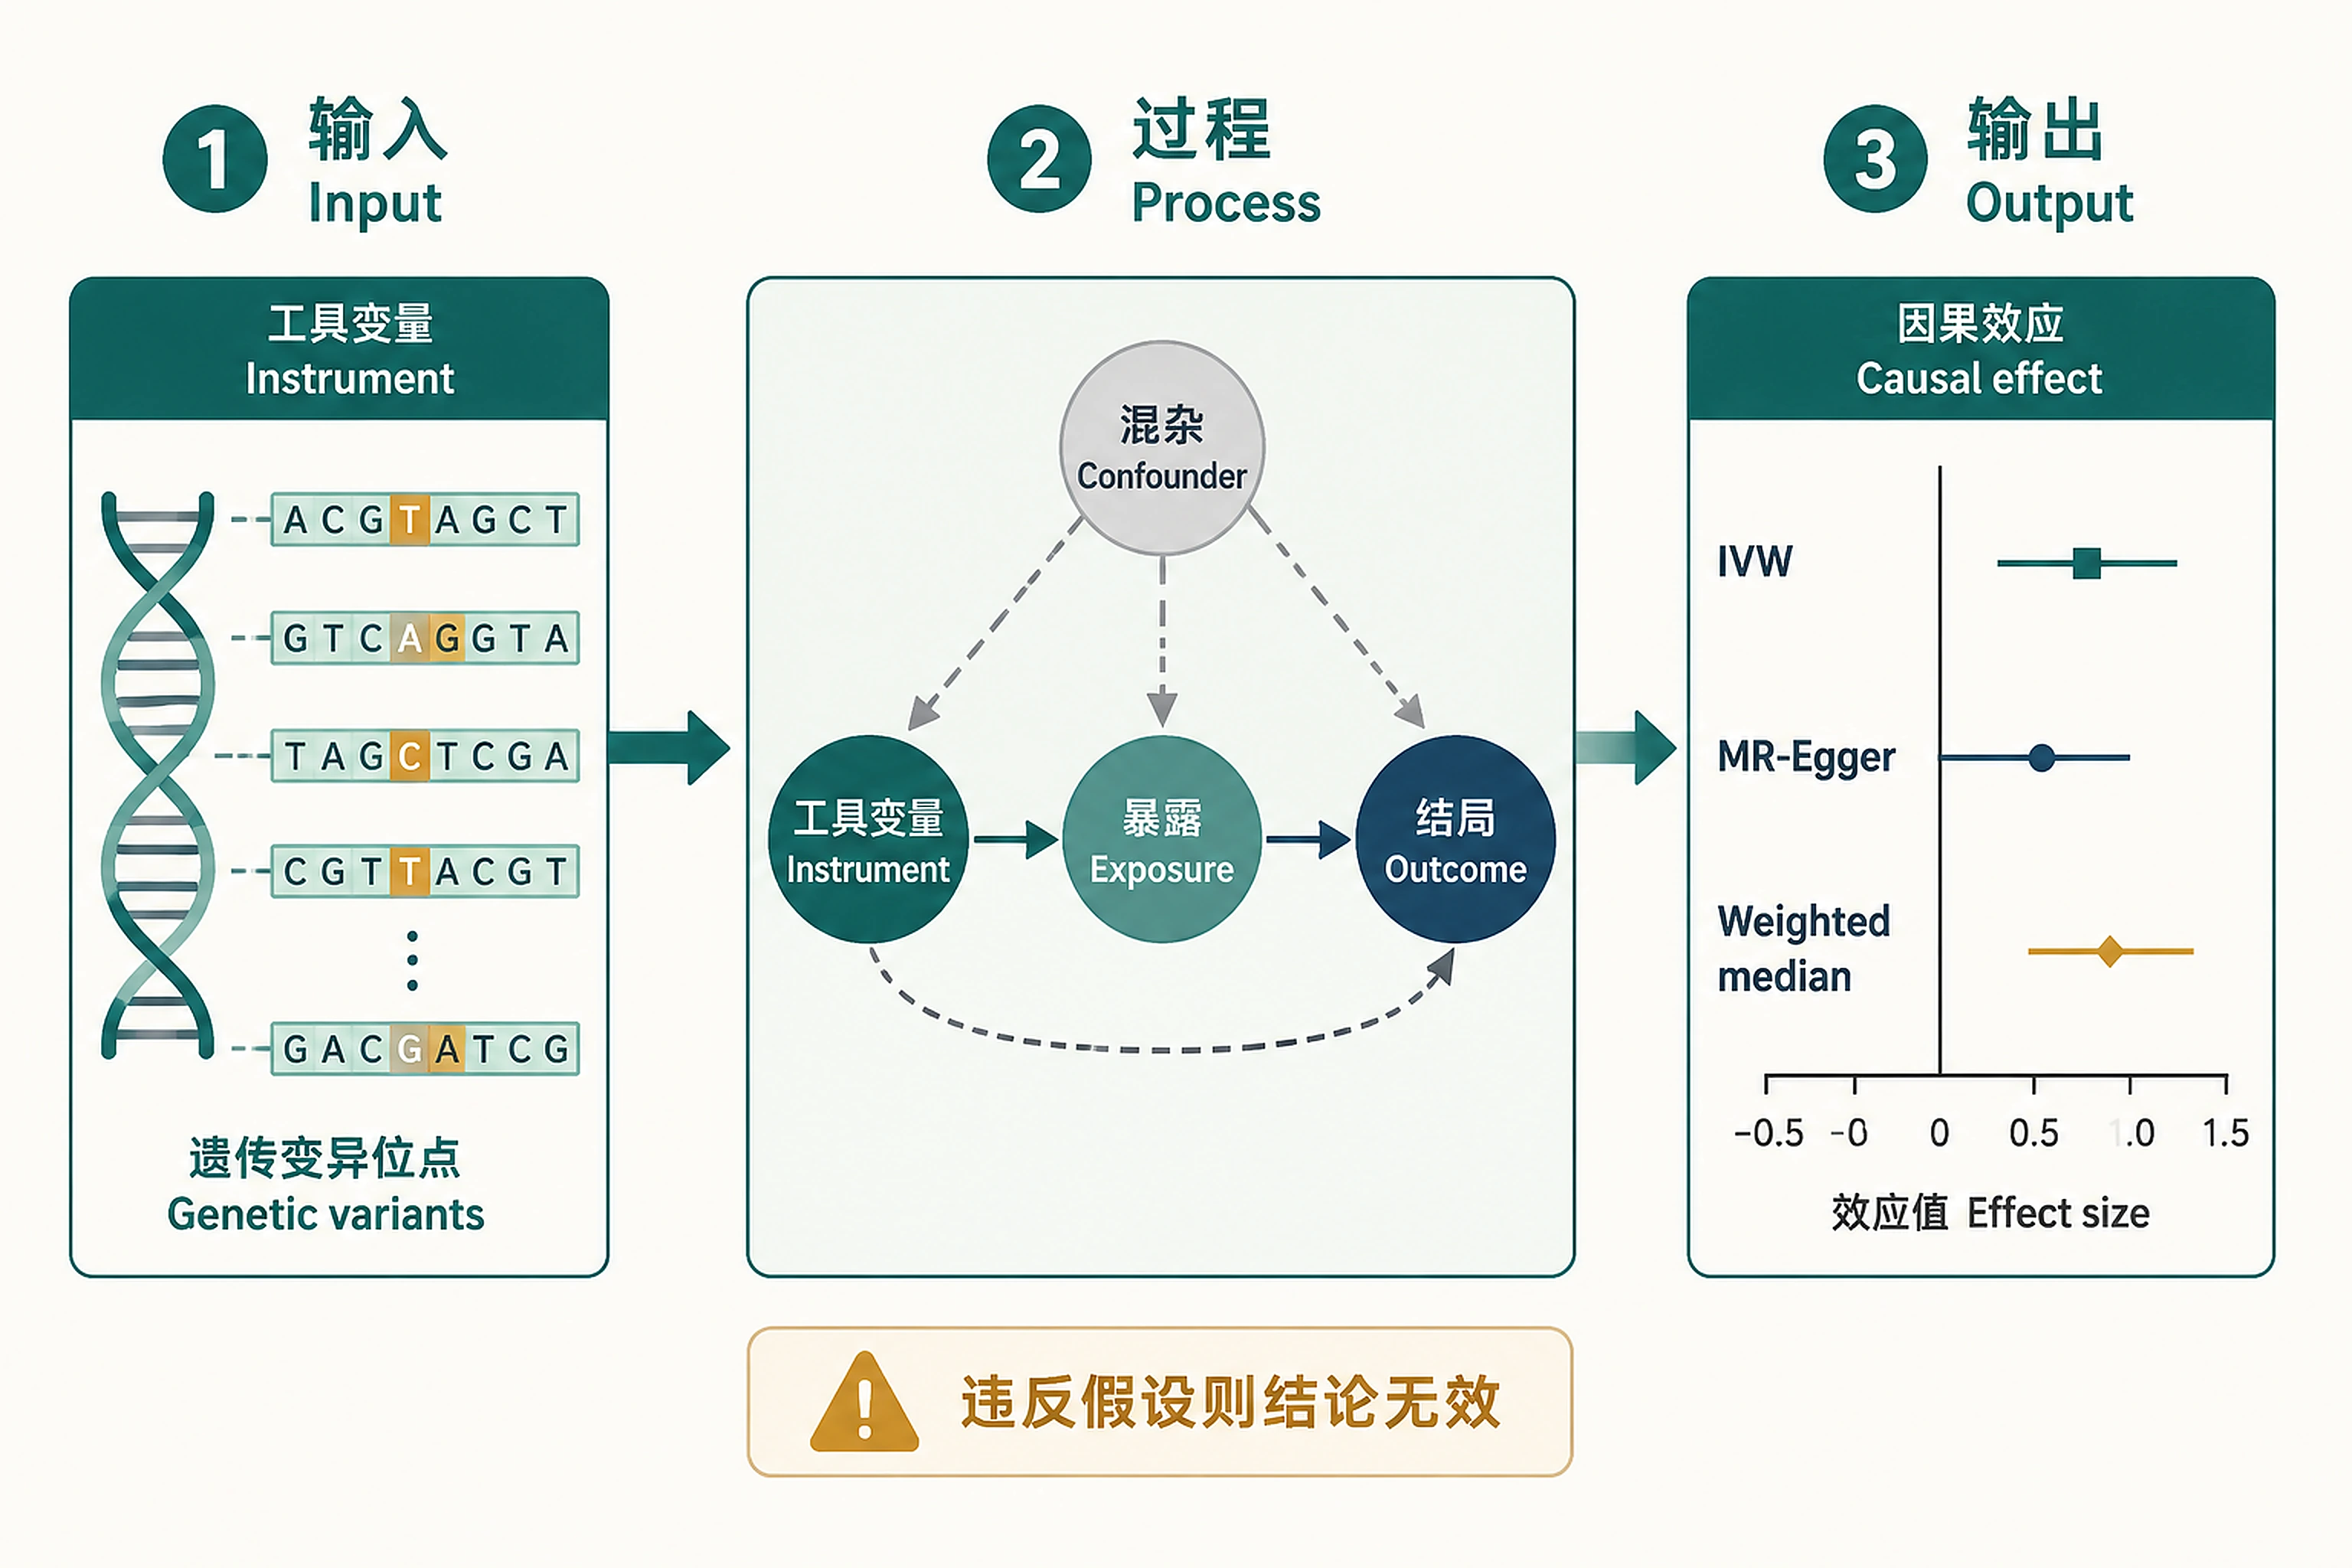
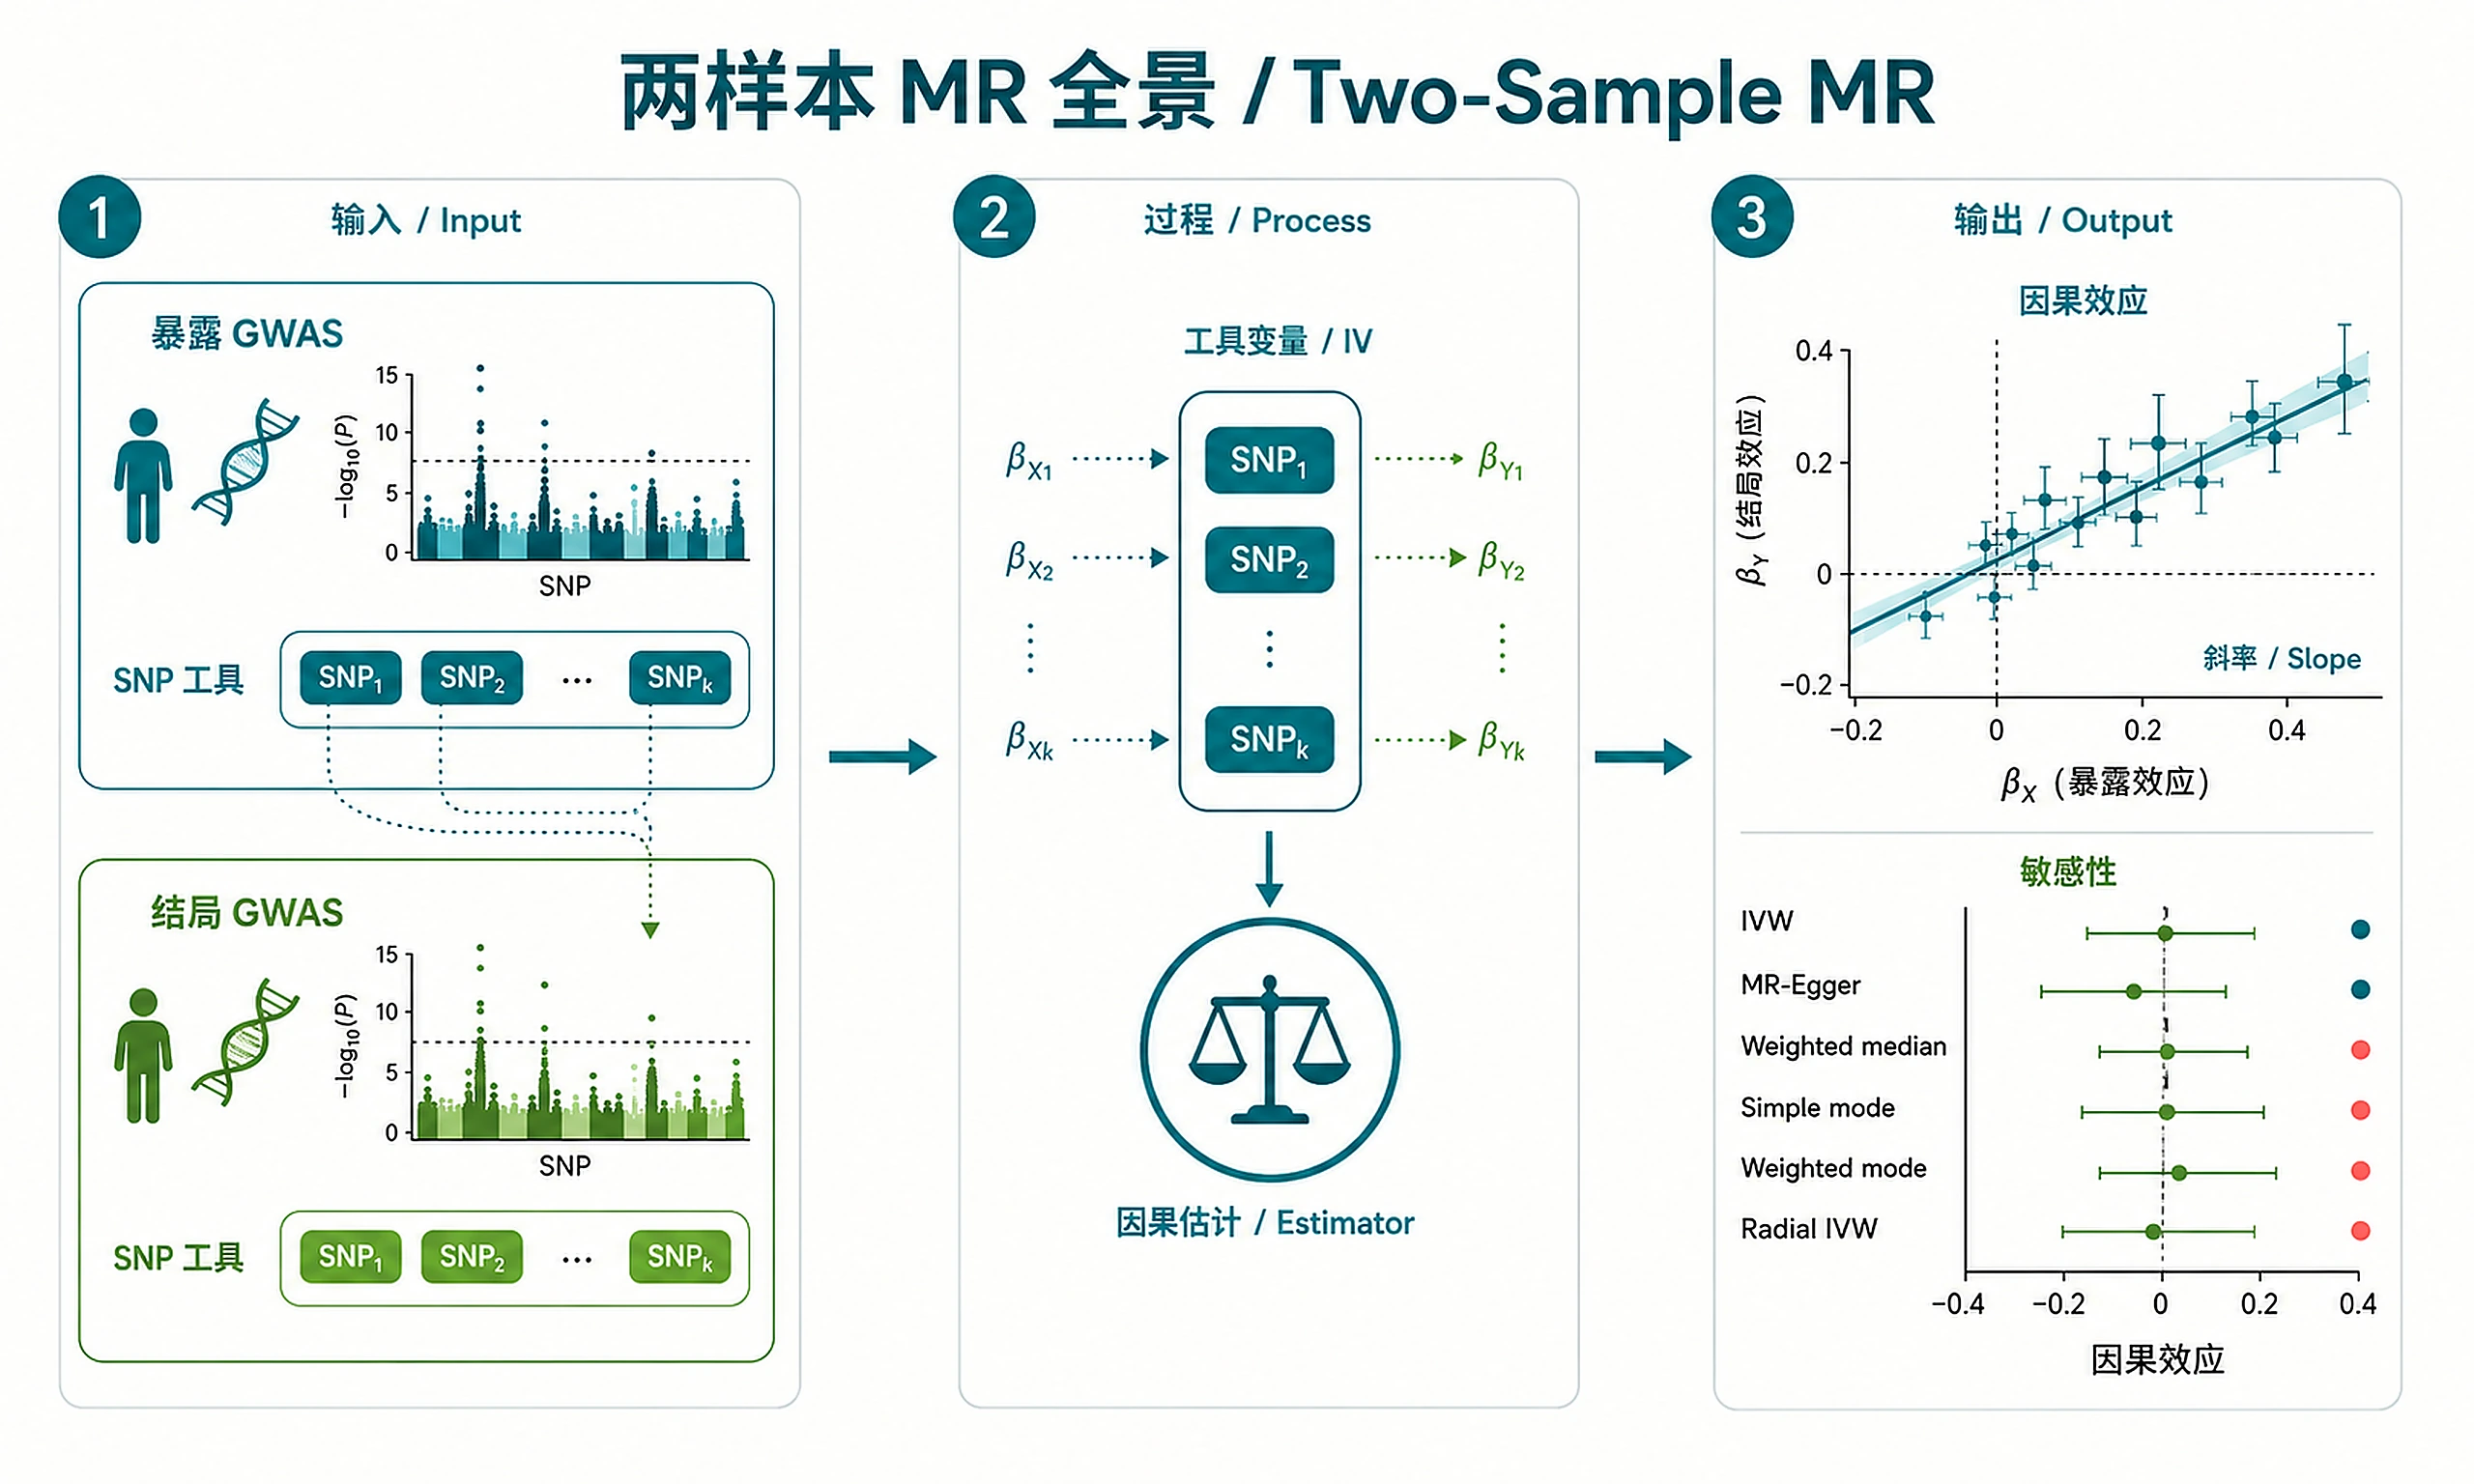
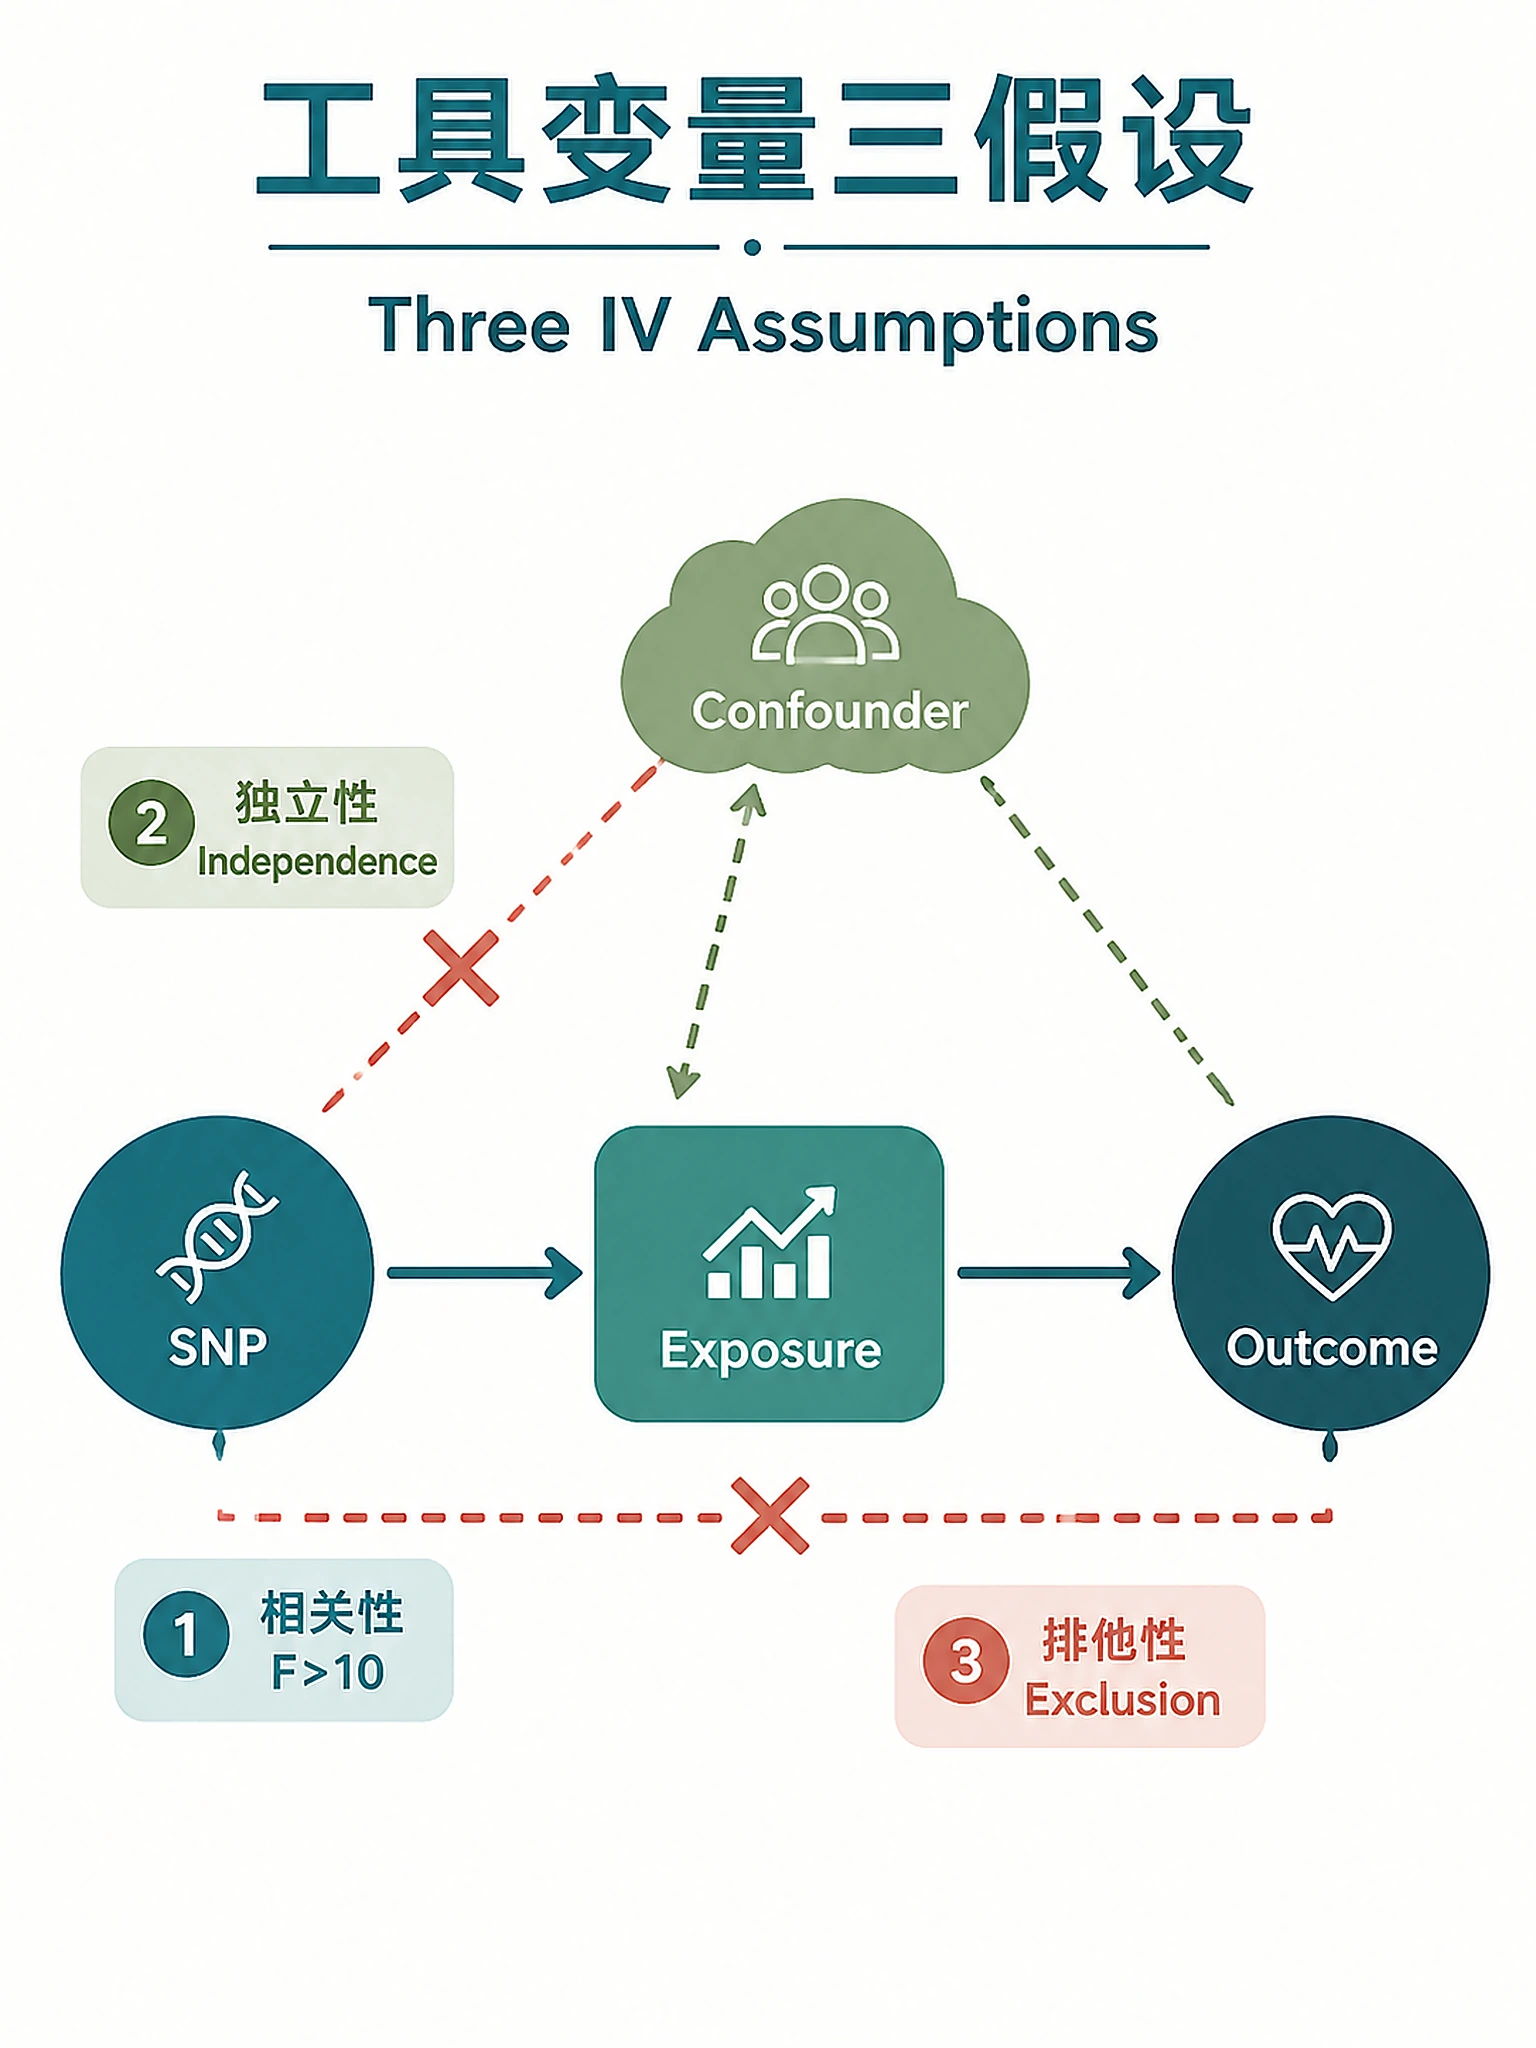
Problem. MR approximates a randomized trial via randomly-assigned genes.
Learning goals
- Instruments: genes are assigned at conception
- Multiple estimators cross-check each other
Figures
Tutorial
When to Use This Skill
- You have GWAS summary statistics for an exposure and outcome trait
- You want to test causal direction between two traits (not just correlation)
- You need to assess whether an observed association is likely causal or confounded
- You want to use genetic variants as instrumental variables (natural experiment)
- You have OpenGWAS trait IDs or your own GWAS summary statistics files
Not suitable for: One-sample MR (individual-level data), non-linear MR, multivariable MR with >2 exposures
Installation
install.packages(c("remotes", "ggplot2", "ggprism", "dplyr", "rmarkdown"))
remotes::install_github("MRCIEU/TwoSampleMR")
# For PDF report generation (optional but recommended):
# install.packages("tinytex"); tinytex::install_tinytex()
# For MR-PRESSO outlier detection (optional but recommended):
# remotes::install_github("rondolab/MR-PRESSO")
| Software | Version | License | Commercial Use |
|---|---|---|---|
| TwoSampleMR | ≥0.5.6 | GPL-3 | ✅ Permitted |
| ieugwasr | ≥0.2.1 | MIT | ✅ Permitted |
| ggplot2 | ≥3.4.0 | MIT | ✅ Permitted |
| ggprism | ≥1.0.3 | GPL (≥3) | ✅ Permitted |
| dplyr | ≥1.1.0 | MIT | ✅ Permitted |
| rmarkdown | ≥2.20 | GPL-3 | ✅ Permitted |
Inputs
Option A — OpenGWAS IDs (recommended):
- Exposure ID (e.g.,
"ieu-a-300"for LDL cholesterol) - Outcome ID (e.g.,
"ieu-a-7"for coronary heart disease) - Browse available traits at: https://gwas.mrcieu.ac.uk/
Option B — User-provided files (CSV/TSV):
- Exposure GWAS summary statistics
- Outcome GWAS summary statistics
| Required Column | Description | Example |
|---|---|---|
| SNP | rsID | rs1234567 |
| beta | Effect estimate | 0.05 |
| se | Standard error | 0.01 |
| pval | P-value | 5e-10 |
| effect_allele | Effect allele | A |
| other_allele | Other allele | G |
| eaf | Effect allele frequency (optional) | 0.3 |
Outputs
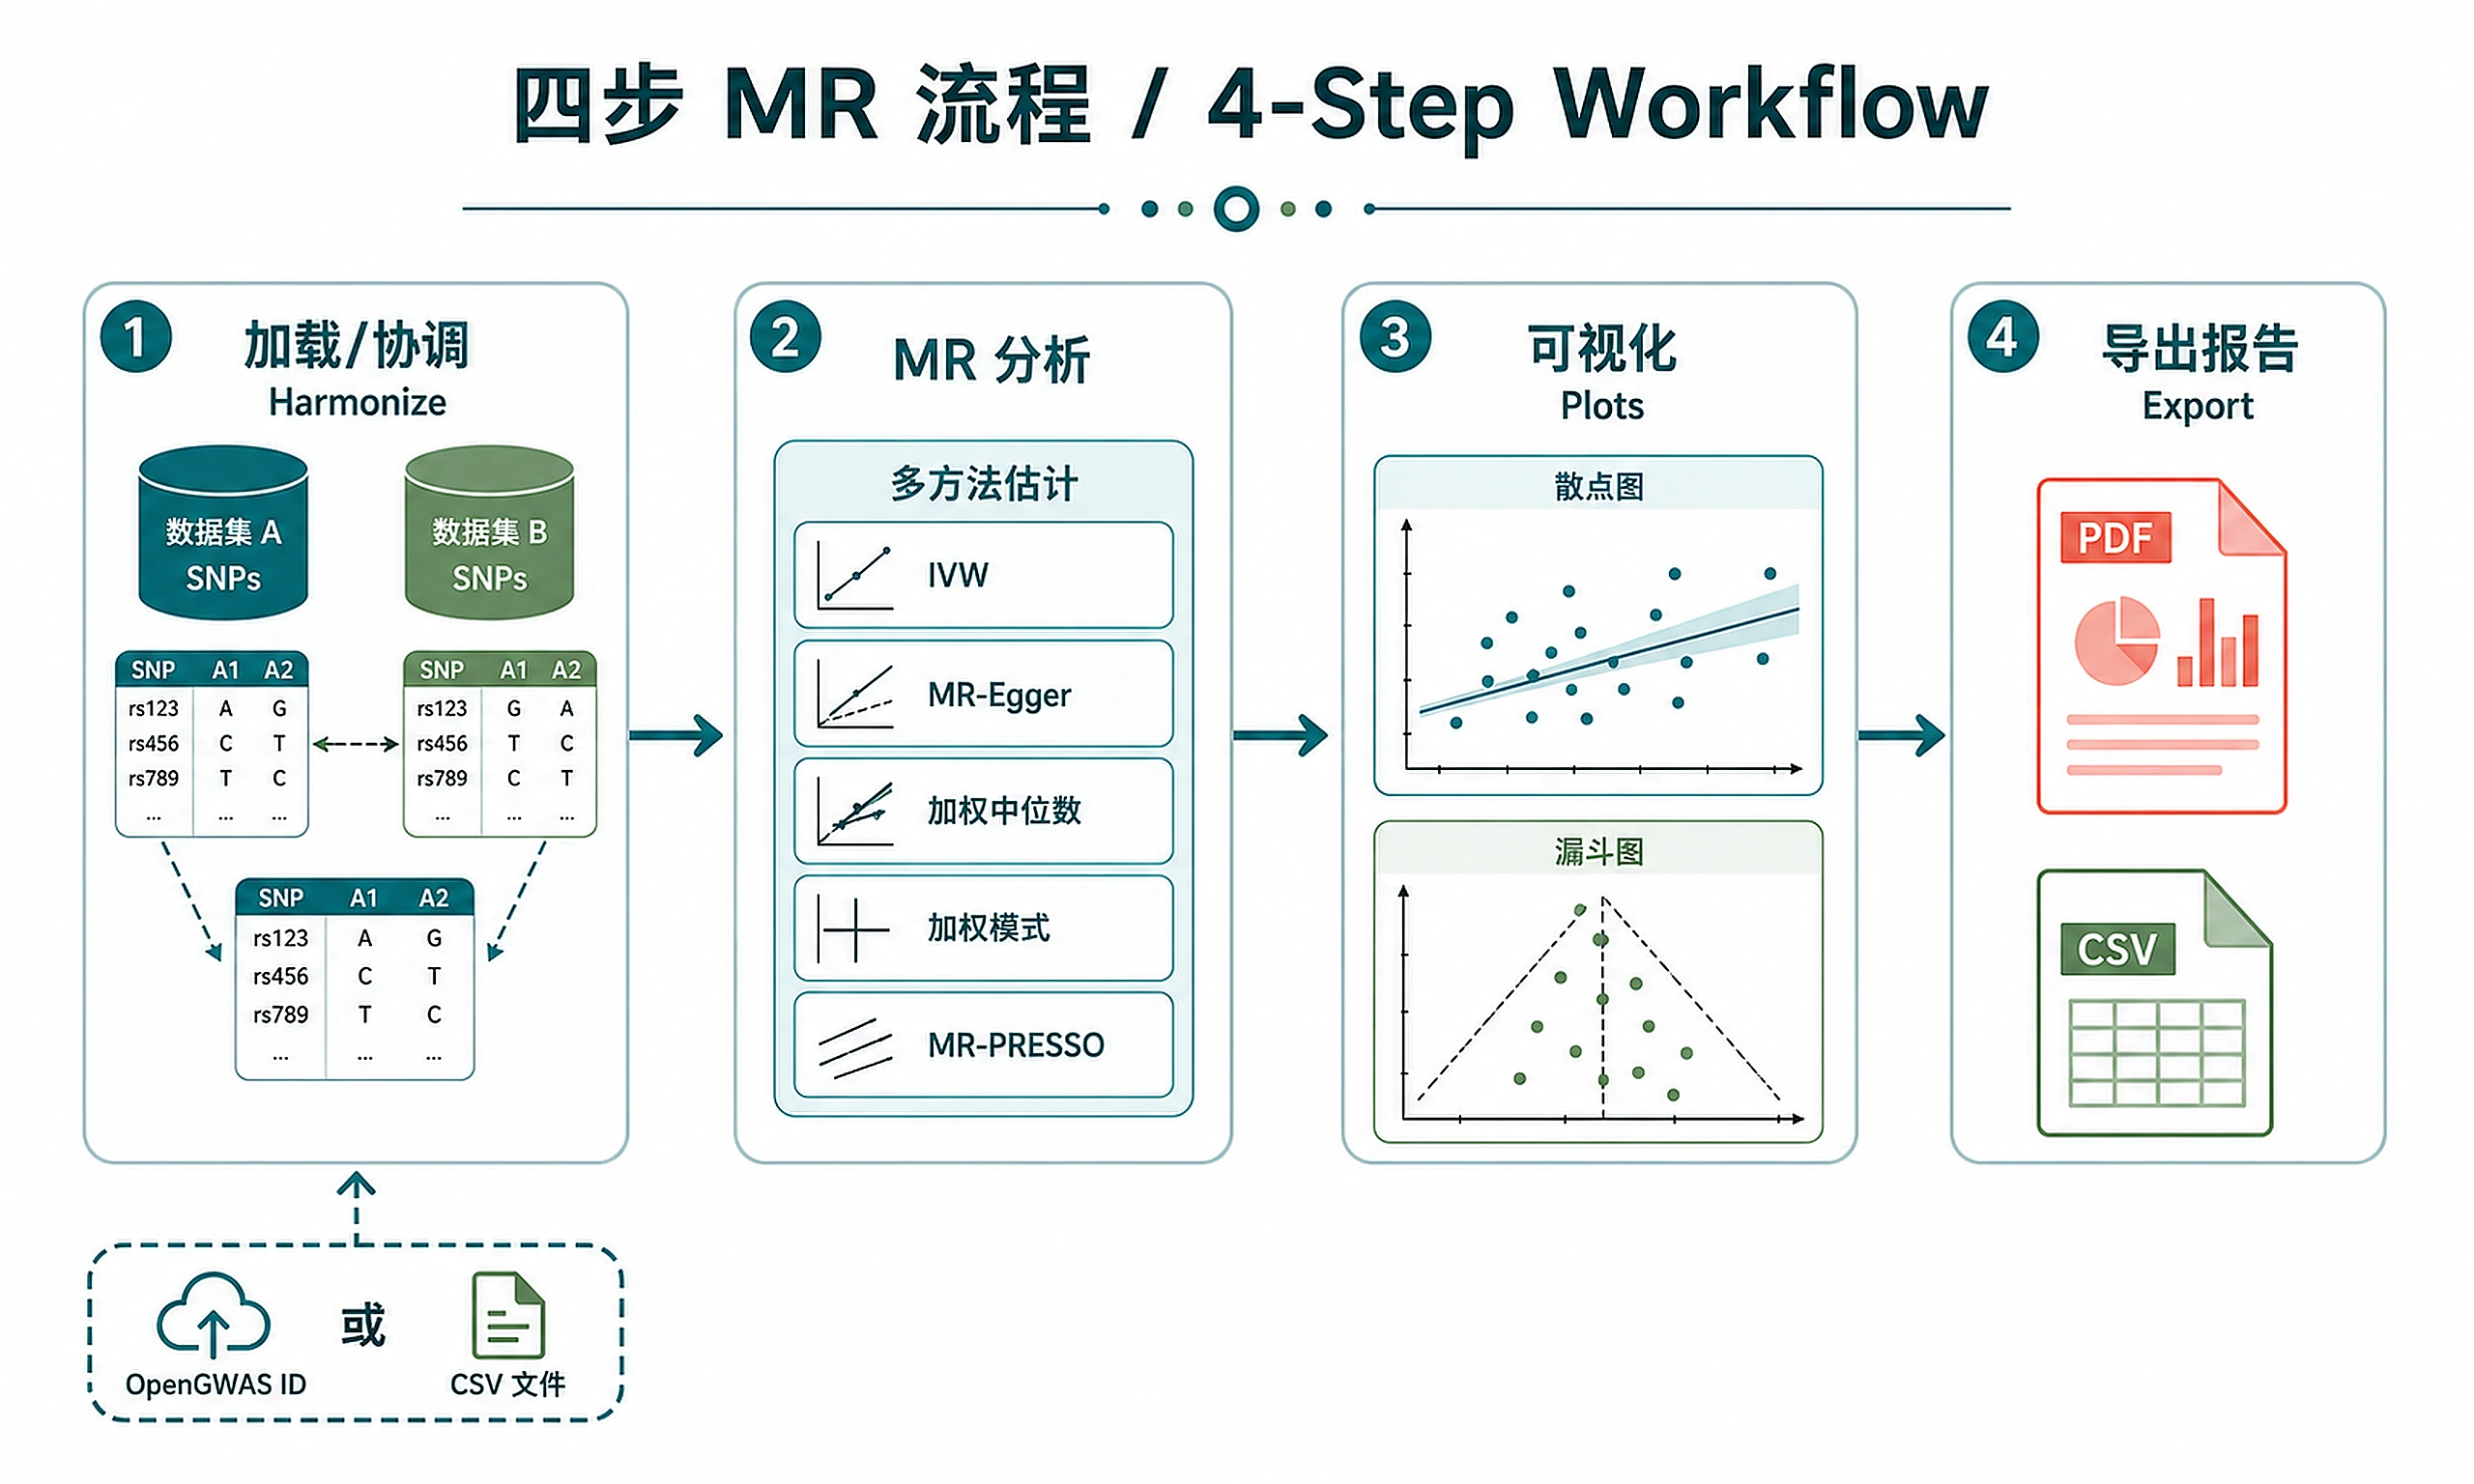
Results (CSV):
mr_results.csv— MR estimates from all 4 methods (beta, SE, p-value, nSNP, F-statistics)heterogeneity_results.csv— Cochran's Q test for instrument heterogeneitypleiotropy_results.csv— MR-Egger intercept test for directional pleiotropydirectionality_results.csv— Steiger test confirming causal directionharmonized_data.csv— SNP-level harmonized exposure-outcome datasingle_snp_results.csv— Per-SNP Wald ratio estimatesleaveoneout_results.csv— Leave-one-out robustness estimates- MR-PRESSO outlier results (if heterogeneity significant and MRPRESSO installed)
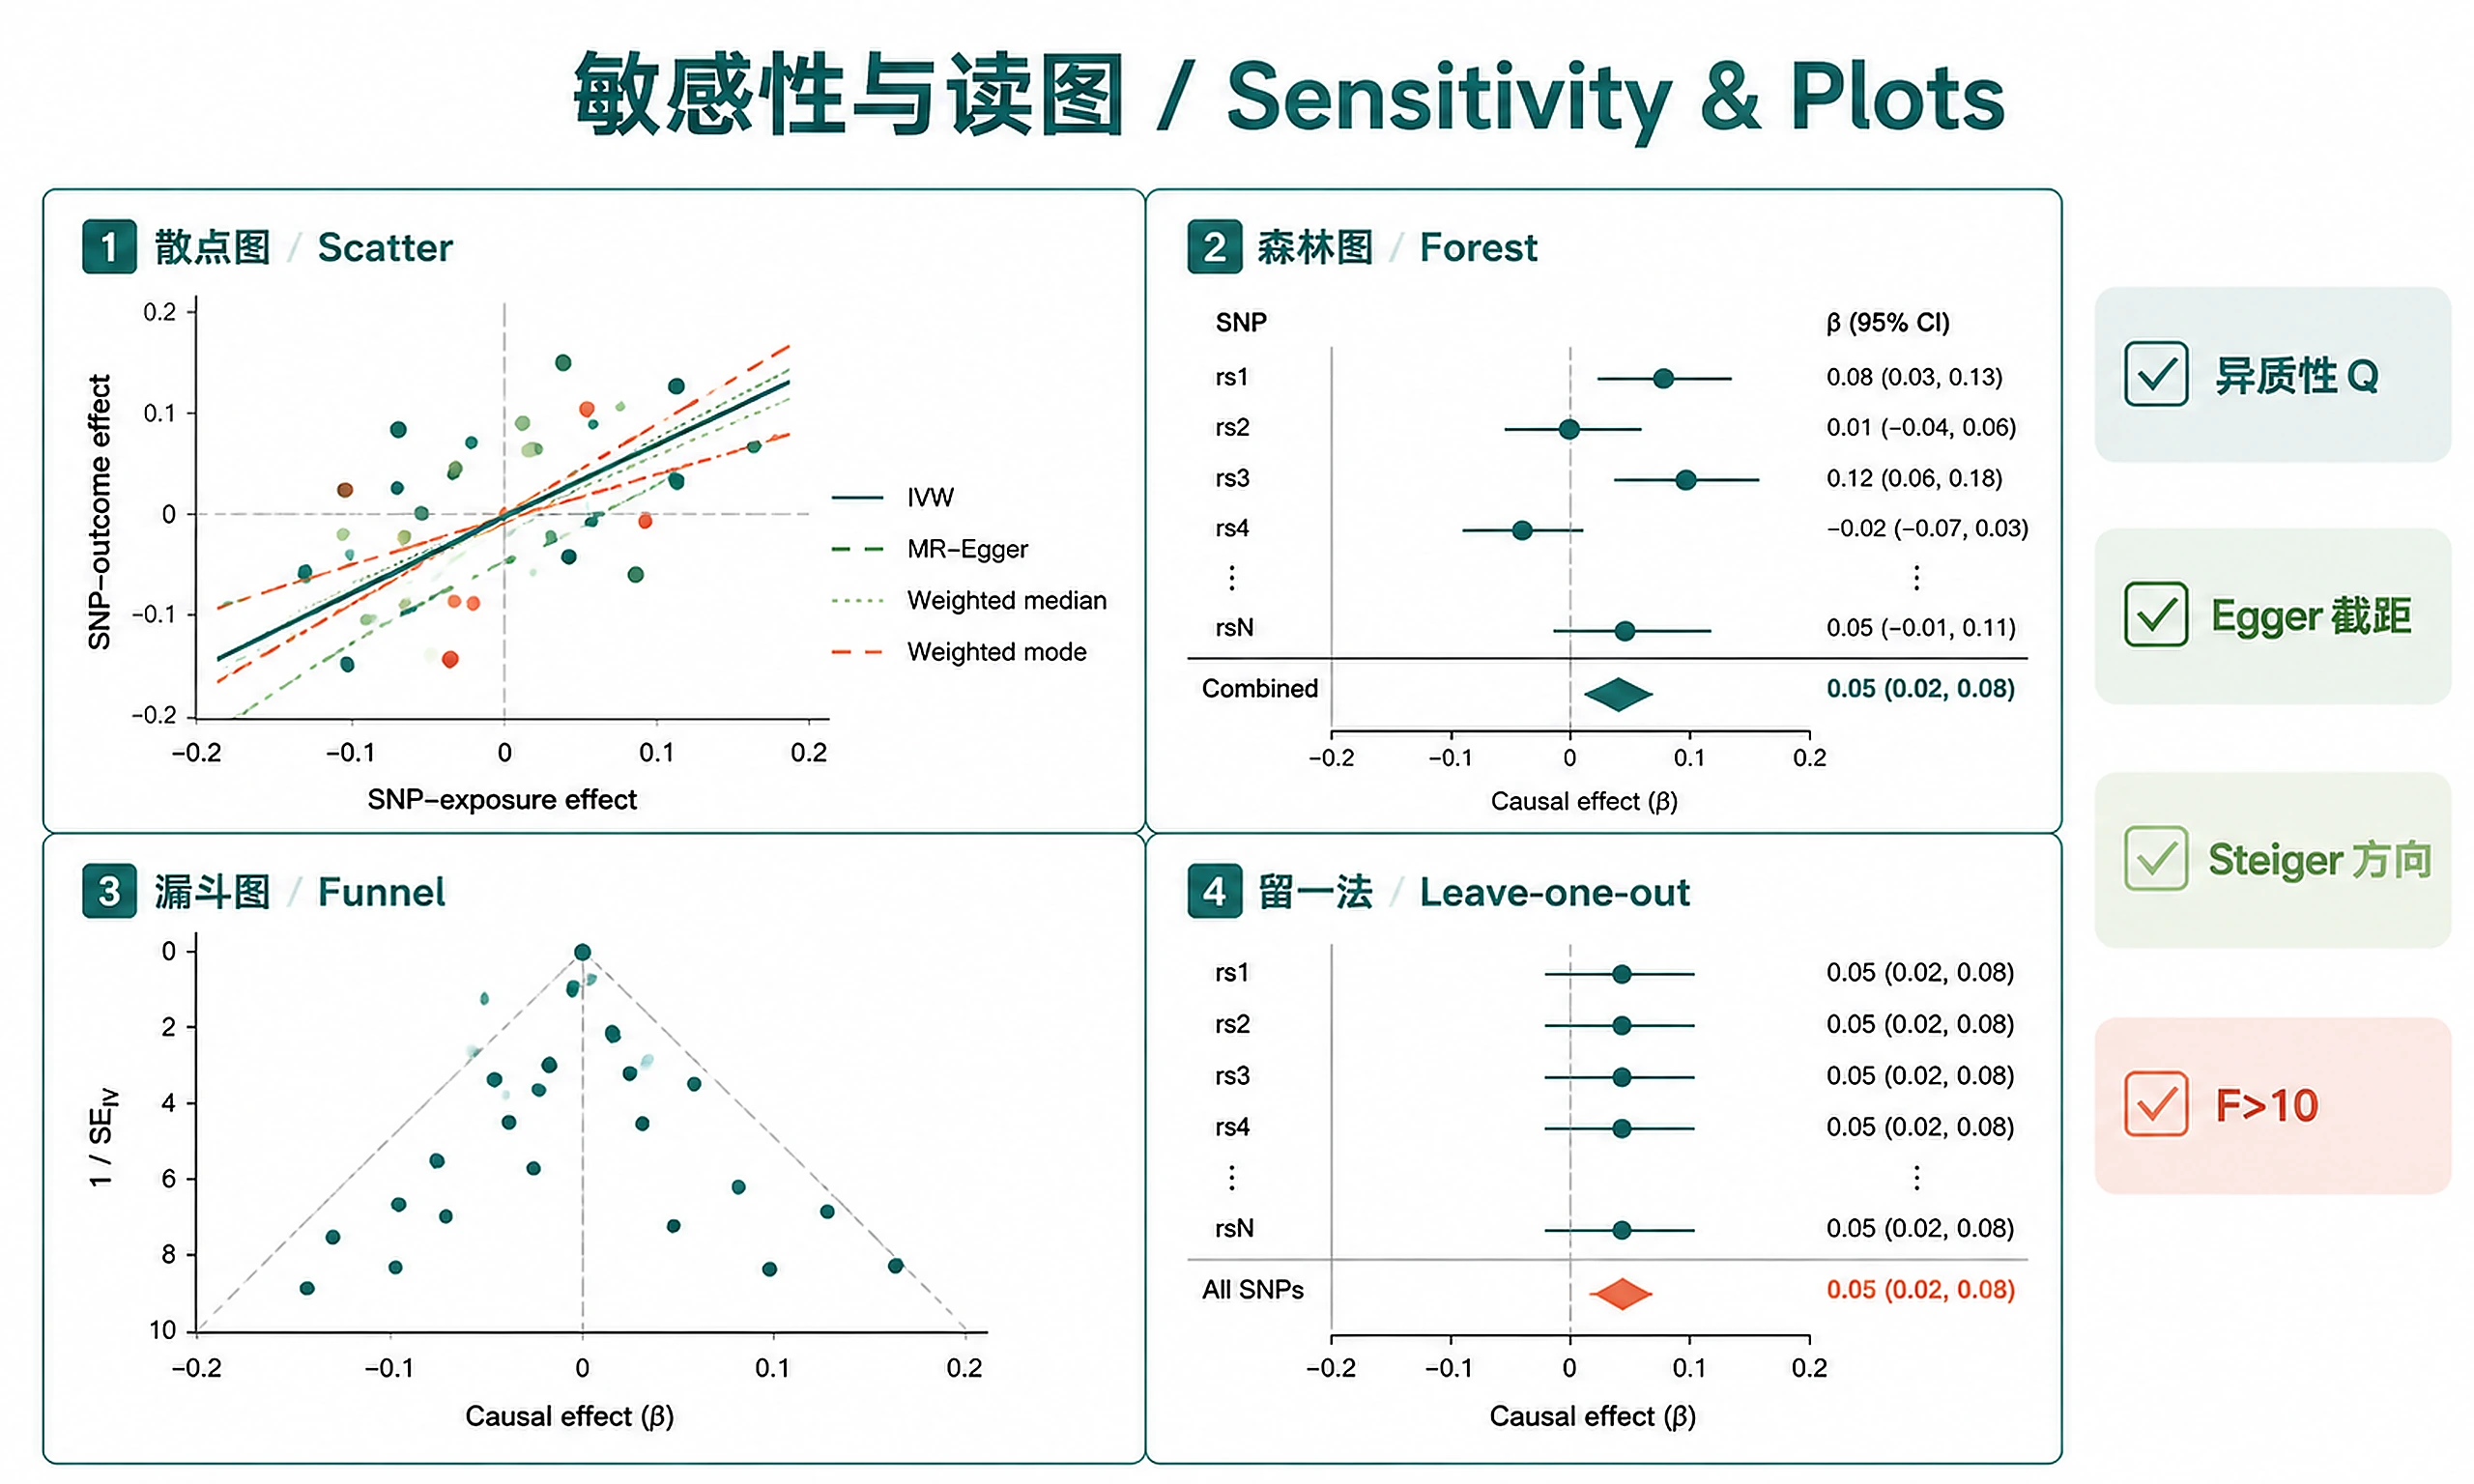
Plots (PNG + SVG):
mr_scatter_plot— SNP-exposure vs SNP-outcome with method regression linesmr_forest_plot— Individual + combined SNP effect estimatesmr_funnel_plot— Precision vs effect size (asymmetry = pleiotropy)mr_leaveoneout_plot— Effect stability when removing each SNP
Report:
mr_report.pdf— Structured analysis report (Introduction, Methods, Results, Figures, Conclusions)
Analysis objects (RDS):
mr_object.rds— Complete analysis (results, sensitivity, harmonized data)- Load with:
mr_obj <- readRDS("mr_results/mr_object.rds")
Clarification Questions
-
Input Data (ASK THIS FIRST):
- Do you have specific GWAS summary statistics or OpenGWAS trait IDs?
- If files uploaded: Are these the exposure and outcome GWAS files?
- Expected formats: CSV/TSV with SNP, beta, se, pval, effect_allele, other_allele
- Or use example data? LDL Cholesterol → Coronary Heart Disease demo (drug-target validation example)
-
Exposure and Outcome:
- (If using example data) Pre-set: Exposure = LDL Cholesterol, Outcome = Coronary Heart Disease — no need to specify
- (If using your own data) What is the exposure (potential cause)? What is the outcome (potential effect)?
-
Parameters (defaults usually fine):
- P-value threshold for instruments? (default: 5×10⁻⁸)
- LD clumping r²? (default: 0.001)
Standard Workflow
🚨 MANDATORY: USE SCRIPTS EXACTLY AS SHOWN — DO NOT WRITE INLINE CODE 🚨
Step 1 — Load and harmonize data:
source("scripts/load_data.R")
dat <- load_example_data()
# OR: dat <- load_from_opengwas("ieu-a-300", "ieu-a-7")
# OR: dat <- load_from_files("exposure.csv", "outcome.csv")
DO NOT write inline data loading or harmonization code. Use the functions above.
✅ ✅ VERIFICATION: You MUST see "✓ Data loaded and harmonized successfully!"
Step 2 — Run MR analysis:
source("scripts/run_mr_analysis.R")
mr_results <- run_mr(dat)
sensitivity <- run_sensitivity(dat, mr_results)
DO NOT write inline MR code. Just source the script and call the functions.
✅ ✅ VERIFICATION: You MUST see "✓ MR analysis completed successfully!" AND "✓ Sensitivity analyses completed successfully!"
Step 3 — Generate visualizations:
source("scripts/mr_plots.R")
generate_all_plots(mr_results, dat, sensitivity$singlesnp, sensitivity$leaveoneout, output_dir = "mr_results")
DO NOT write inline plotting code (ggsave, ggplot, etc.). Just use the function.
✅ ✅ VERIFICATION: You MUST see "✓ All MR plots generated successfully!"
Step 4 — Export results and generate report:
source("scripts/export_results.R")
export_all(mr_results, sensitivity, dat, output_dir = "mr_results")
DO NOT write custom export code. Use export_all(). It automatically generates the PDF report.
✅ ✅ VERIFICATION: You MUST see "✓ Report generated successfully!" AND "=== Export Complete ==="
❌ IF YOU DON'T SEE VERIFICATION MESSAGES: You wrote inline code. Stop and use the scripts.
⚠️ CRITICAL — DO NOT:
- ❌ Write inline MR analysis code → STOP: Use
run_mr()andrun_sensitivity() - ❌ Write inline plotting code → STOP: Use
generate_all_plots() - ❌ Write custom export code → STOP: Use
export_all() - ❌ Write custom report code → STOP: Use
generate_report() - ❌ Try to install system dependencies → Scripts handle package installation
⚠️ IF SCRIPTS FAIL — Script Failure Hierarchy:
- Fix and Retry (90%) — Install missing R package, re-run script
- Modify Script (5%) — Edit the script file, document changes
- Use as Reference (4%) — Read script, adapt approach, cite source
- Write from Scratch (1%) — Only if genuinely impossible, explain why
Common Issues
| Issue | Cause | Solution |
|---|---|---|
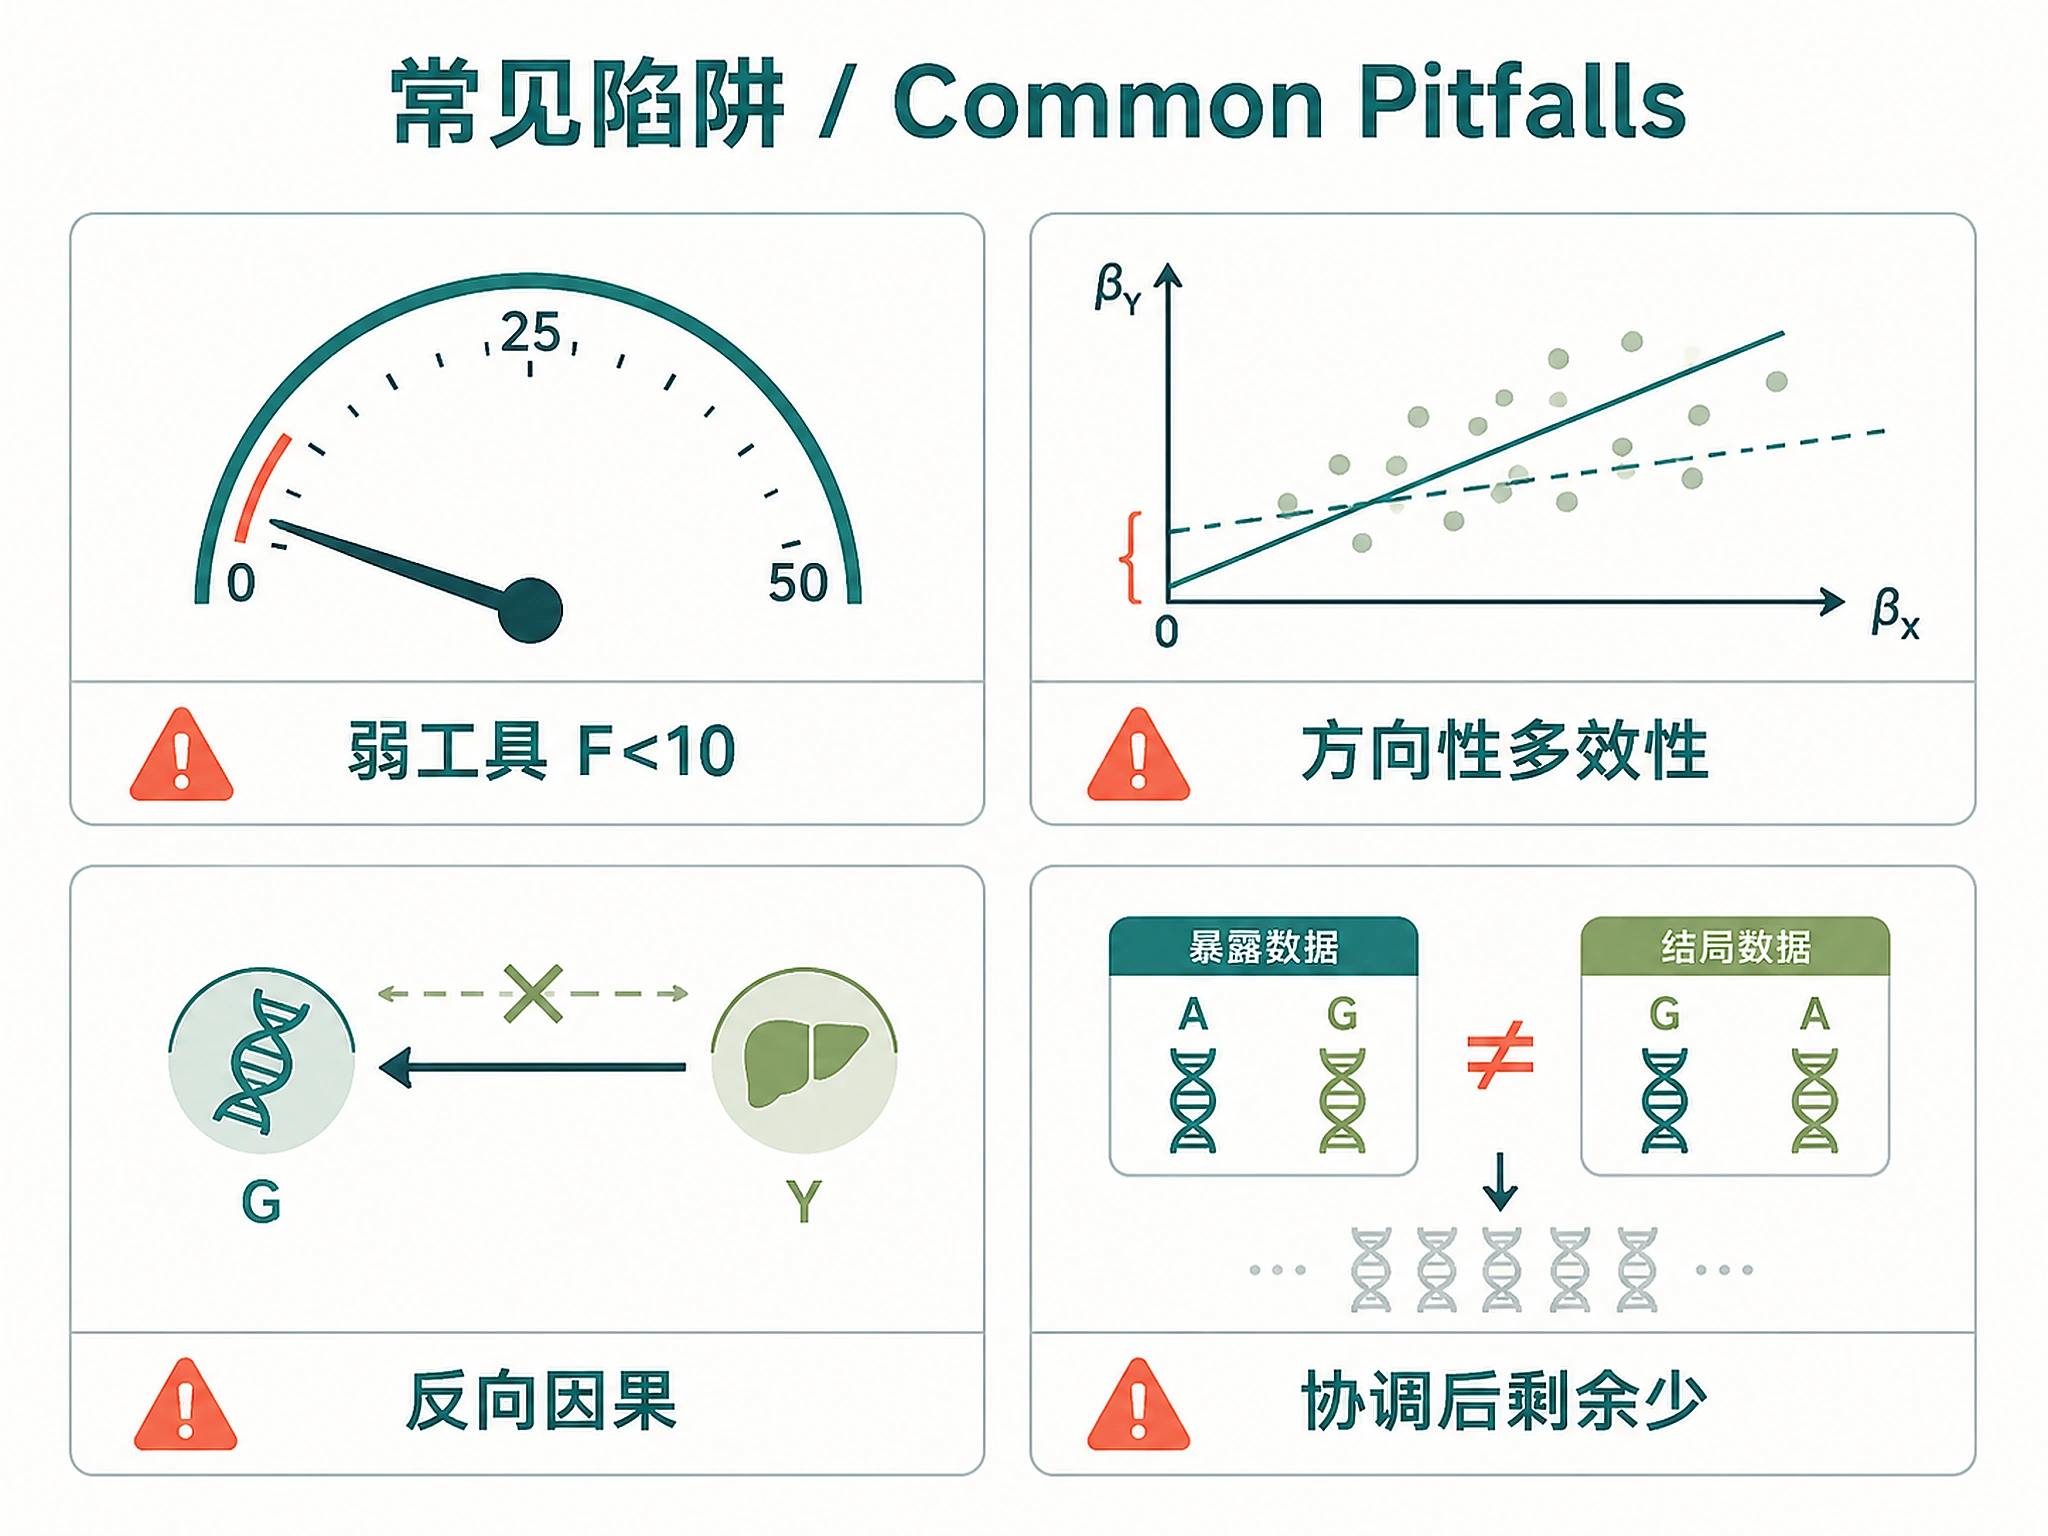
| "No instruments found" | No SNPs below p-value threshold | Try a less stringent threshold or check trait ID |
| LD clumping API fails | OpenGWAS/IEU API temporarily down | Script falls back to no clumping with warning; results may be affected by LD |
| "Only N SNPs retained" | Allele harmonization removed most SNPs | Check if exposure/outcome are from same genome build |
| Steiger test fails | Sample sizes unavailable in metadata | Normal for some datasets; other sensitivity tests still valid |
| SVG export error | Missing optional dependency | Normal — generate_all_plots() falls back to base R svg() automatically |
| OpenGWAS rate limiting | Too many API requests | Wait a few minutes and retry |
| PDF report fails | LaTeX/tinytex not installed | Install with tinytex::install_tinytex() — report auto-falls back to HTML or base R PDF |
| Steiger R² warning for binary outcome | Outcome is case-control, not quantitative | Use get_r_from_lor() with prevalence to compute liability-scale R² before directionality test |
| MR-PRESSO not available | MRPRESSO package not installed | remotes::install_github('rondolab/MR-PRESSO') — optional but recommended when heterogeneity is significant |
| "Cannot find function" | Script not sourced | Run source("scripts/load_data.R") before calling functions |
Interpreting Results
See references/interpretation-guide.md for detailed guidance.
Quick interpretation:
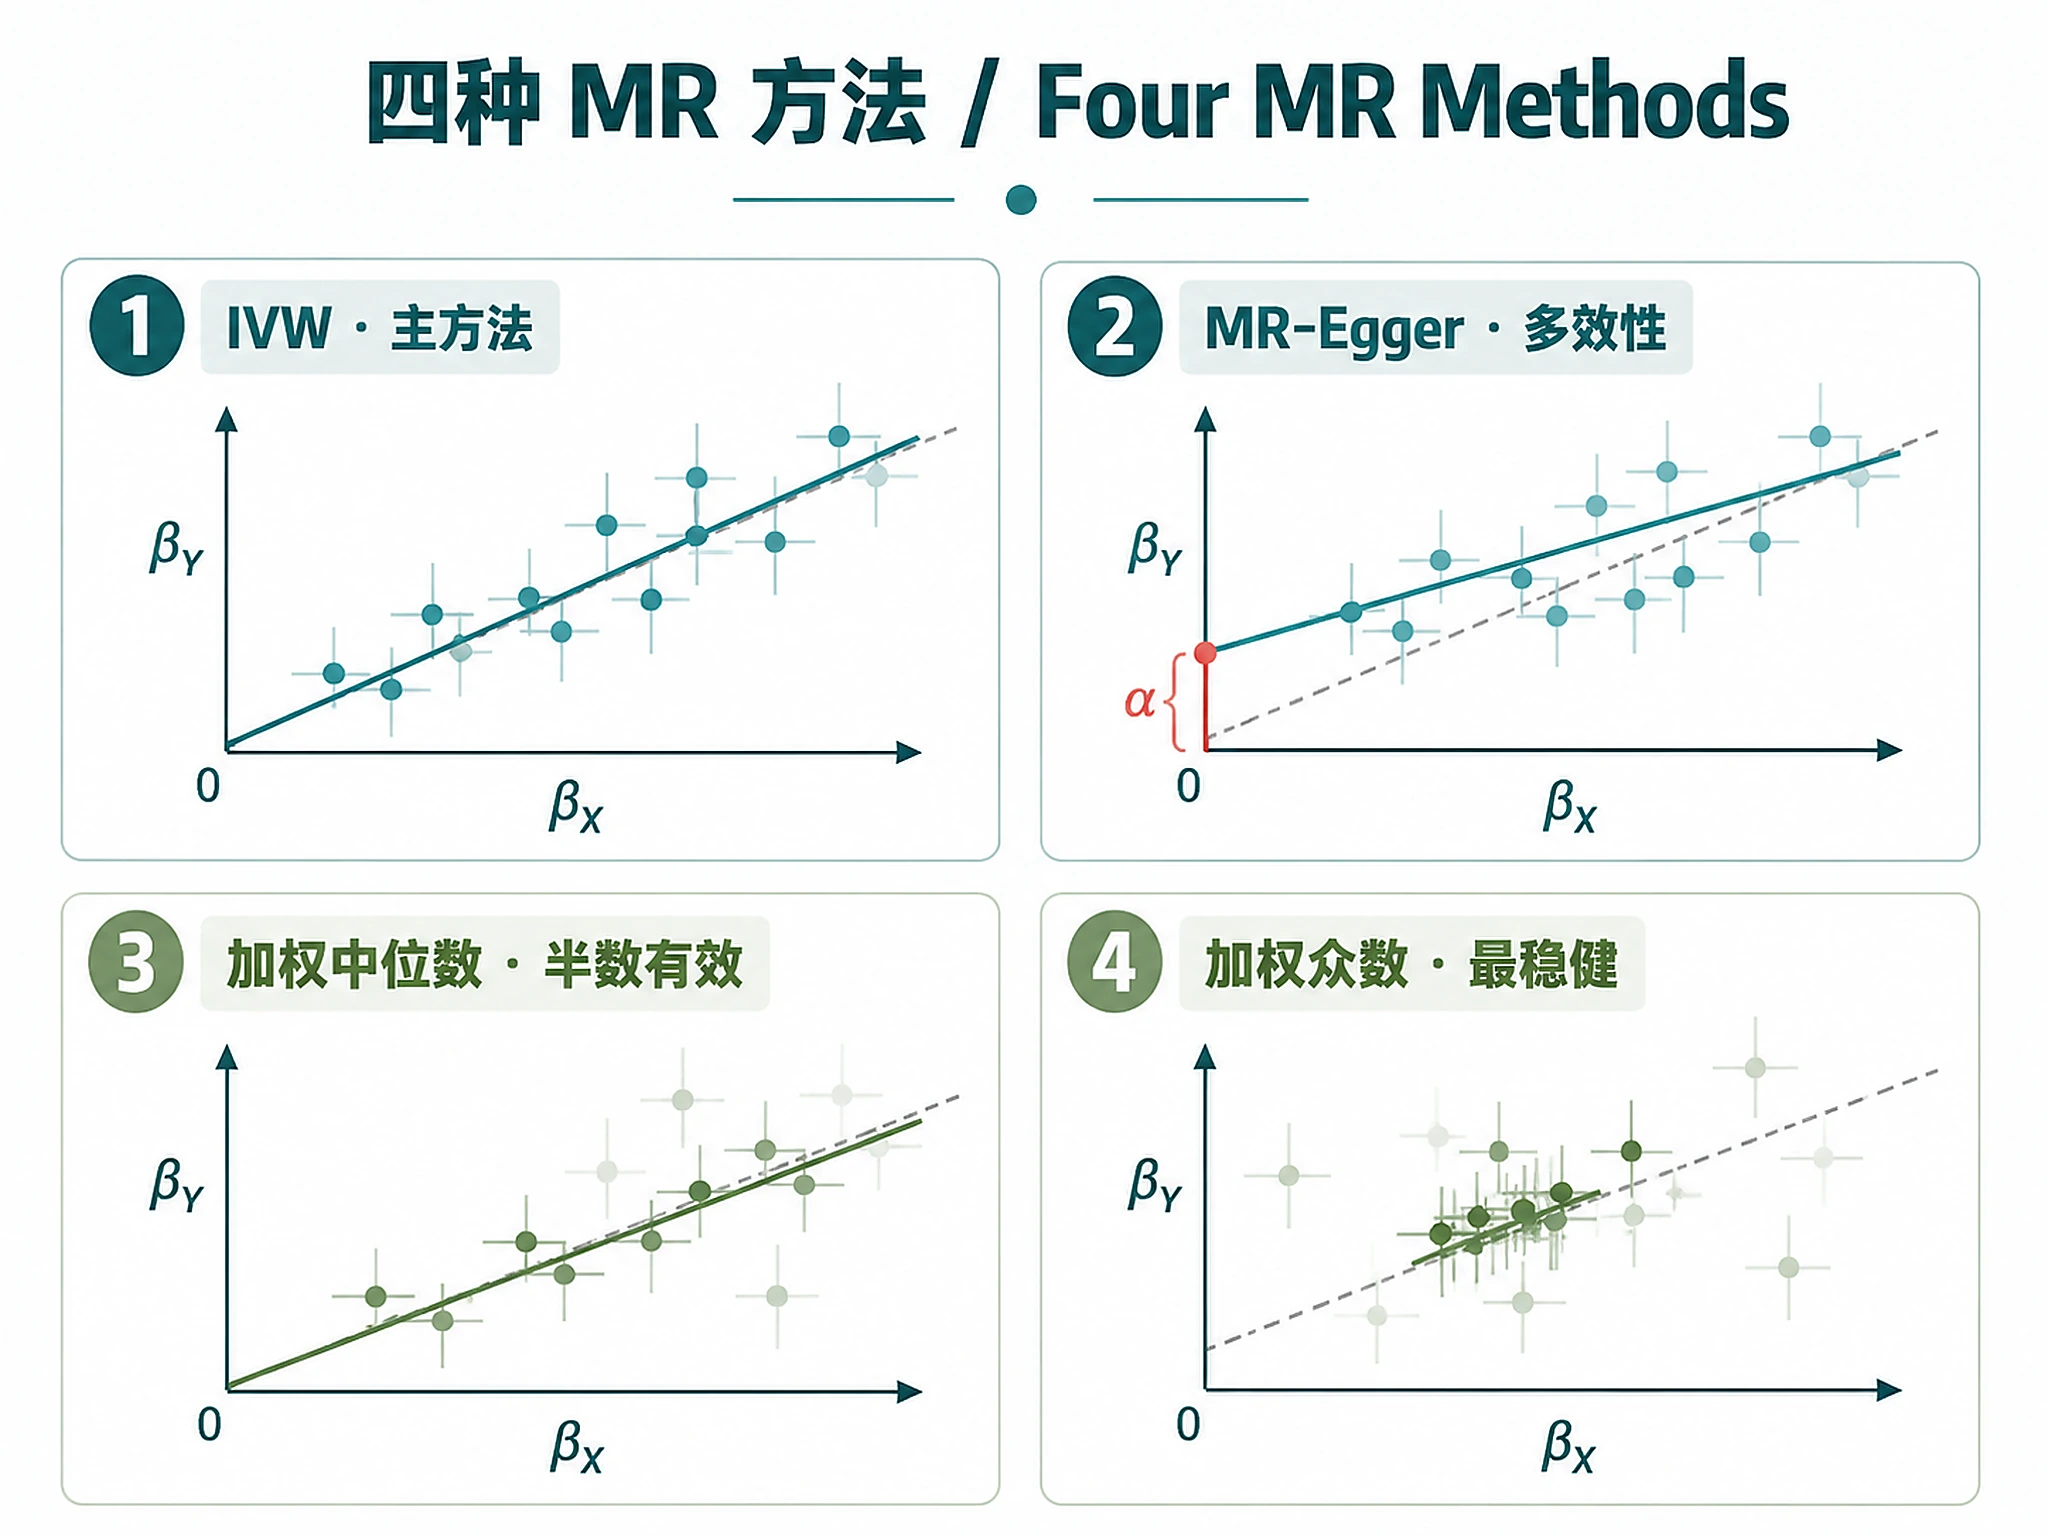
- Concordant methods (IVW, Egger, WM, WMode agree on direction + significance) → stronger evidence
- Any method non-significant or discordant → must be discussed explicitly, not dismissed
- IVW significant + no heterogeneity + no pleiotropy → strongest evidence
- Egger intercept p < 0.05 → directional pleiotropy may bias IVW
- High heterogeneity (Q p < 0.05) → run MR-PRESSO, flag outlier instruments
- Steiger direction incorrect → reverse causation concern (check binary outcome R² correction)
- F-statistic < 10 → weak instrument bias toward the null
Suggested Next Steps
- Multiple exposures? → Run bidirectional MR (swap exposure/outcome)
- Pleiotropy detected? → Consider MR-PRESSO or multivariable MR
- Significant result? → Replicate with independent GWAS datasets
- Drug target validation? → Use cis-MR with variants near gene of interest
- Pathway analysis? → Combine with functional enrichment skills
Related Skills
polygenic-risk-score— Polygenic risk score computation (LDpred2)polygenic-risk-score-prs-catalog— PRS from pre-computed PGS Catalog weightseqtl-colocalization-coloc— eQTL colocalization analysis (MR follow-up)
References
- Sanderson E, et al. (2022). Mendelian randomization. Nat Rev Methods Primers. PMC7384151
- Hemani G, et al. (2018). The MR-Base platform supports systematic causal inference across the human phenome. eLife. DOI: 10.7554/eLife.34408
- TwoSampleMR package: https://github.com/MRCIEU/TwoSampleMR
- OpenGWAS database: https://gwas.mrcieu.ac.uk/
- STROBE-MR guidelines: https://doi.org/10.1001/jama.2023.1788
Code preview
scripts/export_results.R
# =============================================================================
# Mendelian Randomization - Export Results
# =============================================================================
# Functions:
#   export_all()  - Export all MR results, sensitivity analyses, RDS object, and PDF report
# =============================================================================

#' Export all MR analysis results
#'
#' Saves:
#'   1. mr_results.csv - Primary MR estimates (all methods)
#'   2. heterogeneity_results.csv - Cochran's Q test results
#'   3. pleiotropy_results.csv - MR-Egger intercept test
#'   4. directionality_results.csv - Steiger directionality test
#'   5. harmonized_data.csv - SNP-level harmonized data
#'   6. single_snp_results.csv - Per-SNP Wald ratio estimates
#'   7. leaveoneout_results.csv - Leave-one-out estimates
#'   8. mr_object.rds - Complete analysis object for downstream use
#'   9. mr_report.pdf - Structured analysis report (auto-generated)
#'
#' @param mr_results MR results from run_mr()
#' @param sensitivity_results Sensitivity list from run_sensitivity()
#' @param dat Harmonized data from load_data.R
#' @param output_dir Directory for saving results (default: "mr_results")
export_all <- function(mr_results, sensitivity_results, dat,
                        output_dir = "mr_results") {
    cat("\n=== Exporting MR Results ===\n\n")

    if (!dir.exists(output_dir)) {
        dir.create(output_dir, recursive = TRUE)
    }

    file_count <- 0

    # 1. Primary MR results
    cat("1. MR results (all methods)...\n")
    write.csv(mr_results, file.path(output_dir, "mr_results.csv"), row.names = FALSE)
    cat("   Saved: mr_results.csv\n")
    file_count <- file_count + 1

    # 2. Heterogeneity results
    cat("2. Heterogeneity test results...\n")
    write.csv(sensitivity_results$heterogeneity,
              file.path(output_dir, "heterogeneity_results.csv"), row.names = FALSE)
    cat("   Saved: heterogeneity_results.csv\n")
    file_count <- file_count + 1

    # 3. Pleiotropy results
    cat("3. Pleiotropy test results...\n")
    write.csv(sensitivity_results$pleiotropy,
              file.path(output_dir, "pleiotropy_results.csv"), row.names = FALSE)
    cat("   Saved: pleiotropy_results.csv\n")
    file_count <- file_count + 1

    # 4. Directionality results
    cat("4. Directionality test results...\n")
    if (!is.null(sensitivity_results$directionality)) {
        write.csv(sensitivity_results$directionality,
                  file.path(output_dir, "directionality_results.csv"), row.names = FALSE)
        cat("   Saved: directionality_results.csv\n")
        file_count <- file_count + 1
    } else {
        cat("   Skipped (directionality test was not available)\n")
    }

    # 5. Harmonized data
    cat("5. Harmonized SNP-level data...\n")
    write.csv(dat, file.path(output_dir, "harmonized_data.csv"), row.names = FALSE)
    cat("   Saved: harmonized_data.csv\n")
    file_count <- file_count + 1

    # 6. Single-SNP results
    cat("6. Single-SNP Wald ratio results...\n")
    write.csv(sensitivity_results$singlesnp,
              file.path(output_dir, "single_snp_results.csv"), row.names = FALSE)
    cat("   Saved: single_snp_results.csv\n")
    file_count <- file_count + 1

    # 7. Leave-one-out results
    cat("7. Leave-one-out results...\n")
scripts/generate_report.R
# =============================================================================
# Mendelian Randomization - Report Generation
# =============================================================================
# Functions:
#   generate_report()  - Generate PDF analysis report (intro/methods/results/conclusions)
# =============================================================================

#' Generate a structured MR analysis report
#'
#' Creates a PDF report with Introduction, Methods, Results, Figures, and Conclusions.
#' Requires rmarkdown + LaTeX (tinytex) for PDF. Falls back to HTML or base R PDF.
#'
#' @param mr_results MR results from run_mr()
#' @param sensitivity Sensitivity results from run_sensitivity()
#' @param dat Harmonized data from load_data.R
#' @param output_dir Directory for saving report (default: "mr_results")
generate_report <- function(mr_results, sensitivity, dat, output_dir = "mr_results") {
    cat("\n=== Generating MR Analysis Report ===\n\n")

    if (!dir.exists(output_dir)) dir.create(output_dir, recursive = TRUE)

    has_rmarkdown <- requireNamespace("rmarkdown", quietly = TRUE)

    if (has_rmarkdown) {
        rmd_content <- .build_rmd_content(mr_results, sensitivity, dat, output_dir)
        rmd_path <- file.path(output_dir, "mr_report.Rmd")
        writeLines(rmd_content, rmd_path)

        # Try PDF first, then HTML
        pdf_ok <- tryCatch({
            rmarkdown::render(rmd_path,
                output_format = rmarkdown::pdf_document(
                    toc = FALSE, latex_engine = "xelatex"),
                output_file = "mr_report.pdf",
                output_dir = output_dir, quiet = TRUE)
            cat("   Saved:", file.path(output_dir, "mr_report.pdf"), "\n")
            TRUE
        }, error = function(e) {
            cat("   PDF rendering failed (", conditionMessage(e), ")\n")
            FALSE
        })

        if (!pdf_ok) {
            html_ok <- tryCatch({
                rmarkdown::render(rmd_path,
                    output_format = "html_document",
                    output_file = "mr_report.html",
                    output_dir = output_dir, quiet = TRUE)
                cat("   Saved:", file.path(output_dir, "mr_report.html"),
                    "(HTML fallback)\n")
                TRUE
            }, error = function(e) {
                cat("   HTML also failed. Using base R PDF...\n")
                FALSE
            })

            if (!html_ok) {
                .generate_base_pdf(mr_results, sensitivity, dat, output_dir)
            }
        }

        unlink(rmd_path)
    } else {
        cat("   rmarkdown not available. Using base R PDF...\n")
        .generate_base_pdf(mr_results, sensitivity, dat, output_dir)
    }

    cat("\n\u2713 Report generated successfully!\n")
    return(invisible(NULL))
}

# --- Rmd content builder -----------------------------------------------------

.build_rmd_content <- function(mr_results, sensitivity, dat, output_dir) {
    exposure <- unique(dat$exposure)[1]
    outcome <- unique(dat$outcome)[1]
    n_instruments <- nrow(dat)
    date_str <- format(Sys.Date(), "%B %d, %Y")

    ivw <- mr_results[mr_results$method == "Inverse variance weighted", ]
scripts/load_data.R
# =============================================================================
# Mendelian Randomization - Data Loading & Harmonization
# =============================================================================
# Three entry points:
#   load_example_data()       - LDL Cholesterol → CHD demo (OpenGWAS)
#   load_from_opengwas()      - Any exposure/outcome by OpenGWAS ID
#   load_from_files()         - User-provided GWAS summary statistics
# =============================================================================

# --- Package setup -----------------------------------------------------------

.ensure_packages <- function() {
    options(repos = c(CRAN = "https://cloud.r-project.org"))

    if (!requireNamespace("remotes", quietly = TRUE)) {
        install.packages("remotes")
    }

    if (!requireNamespace("TwoSampleMR", quietly = TRUE)) {
        cat("Installing TwoSampleMR from GitHub (~2 min)...\n")
        remotes::install_github("MRCIEU/TwoSampleMR", upgrade = "never")
    }

    if (!requireNamespace("ieugwasr", quietly = TRUE)) {
        install.packages("ieugwasr")
    }

    suppressPackageStartupMessages({
        library(TwoSampleMR)
        library(ieugwasr)
        library(dplyr)
    })
}

# --- OpenGWAS data loading ---------------------------------------------------

#' Load exposure and outcome data from OpenGWAS and harmonize
#'
#' @param exposure_id OpenGWAS ID for exposure (e.g., "ieu-a-300" for LDL cholesterol)
#' @param outcome_id OpenGWAS ID for outcome (e.g., "ieu-a-7" for CHD)
#' @param p_threshold P-value threshold for instrument selection (default: 5e-8)
#' @param clump_r2 LD clumping r-squared threshold (default: 0.001)
#' @param clump_kb LD clumping window in kb (default: 10000)
#' @return Harmonized data frame ready for MR analysis
load_from_opengwas <- function(exposure_id, outcome_id,
                                p_threshold = 5e-8,
                                clump_r2 = 0.001,
                                clump_kb = 10000) {
    .ensure_packages()

    cat("\n=== Loading MR Data from OpenGWAS ===\n")
    cat("  Exposure:", exposure_id, "\n")
    cat("  Outcome: ", outcome_id, "\n\n")

    # Step 1: Extract instruments for exposure
    cat("Step 1/4: Extracting genome-wide significant instruments (p <", p_threshold, ")...\n")
    exposure_dat <- extract_instruments(
        outcomes = exposure_id,
        p1 = p_threshold,
        clump = TRUE,
        r2 = clump_r2,
        kb = clump_kb
    )

    if (is.null(exposure_dat) || nrow(exposure_dat) == 0) {
        stop("No instruments found for exposure '", exposure_id,
             "'. Check the ID or try a less stringent p-value threshold.")
    }
    cat("  Found", nrow(exposure_dat), "instruments after LD clumping\n\n")

    # Step 2: Extract outcome data for these SNPs
    cat("Step 2/4: Extracting outcome data for instruments...\n")
    outcome_dat <- extract_outcome_data(
        snps = exposure_dat$SNP,
        outcomes = outcome_id
    )

    if (is.null(outcome_dat) || nrow(outcome_dat) == 0) {
        stop("No outcome data found for '", outcome_id,
             "'. Check the ID or ensure SNPs are available in the outcome GWAS.")
Companion files
| Type | Path | Bytes |
|---|---|---|
| Markdown | references/interpretation-guide.md | 8,831 |
| Markdown | references/method-reference.md | 6,972 |
| R | scripts/export_results.R | 4,939 |
| R | scripts/generate_report.R | 18,109 |
| R | scripts/load_data.R | 10,932 |
| R | scripts/mr_plots.R | 6,785 |
| R | scripts/run_mr_analysis.R | 14,838 |
| Markdown | SKILL.md | 9,812 |
| JSON | skill.meta.json | 1,841 |