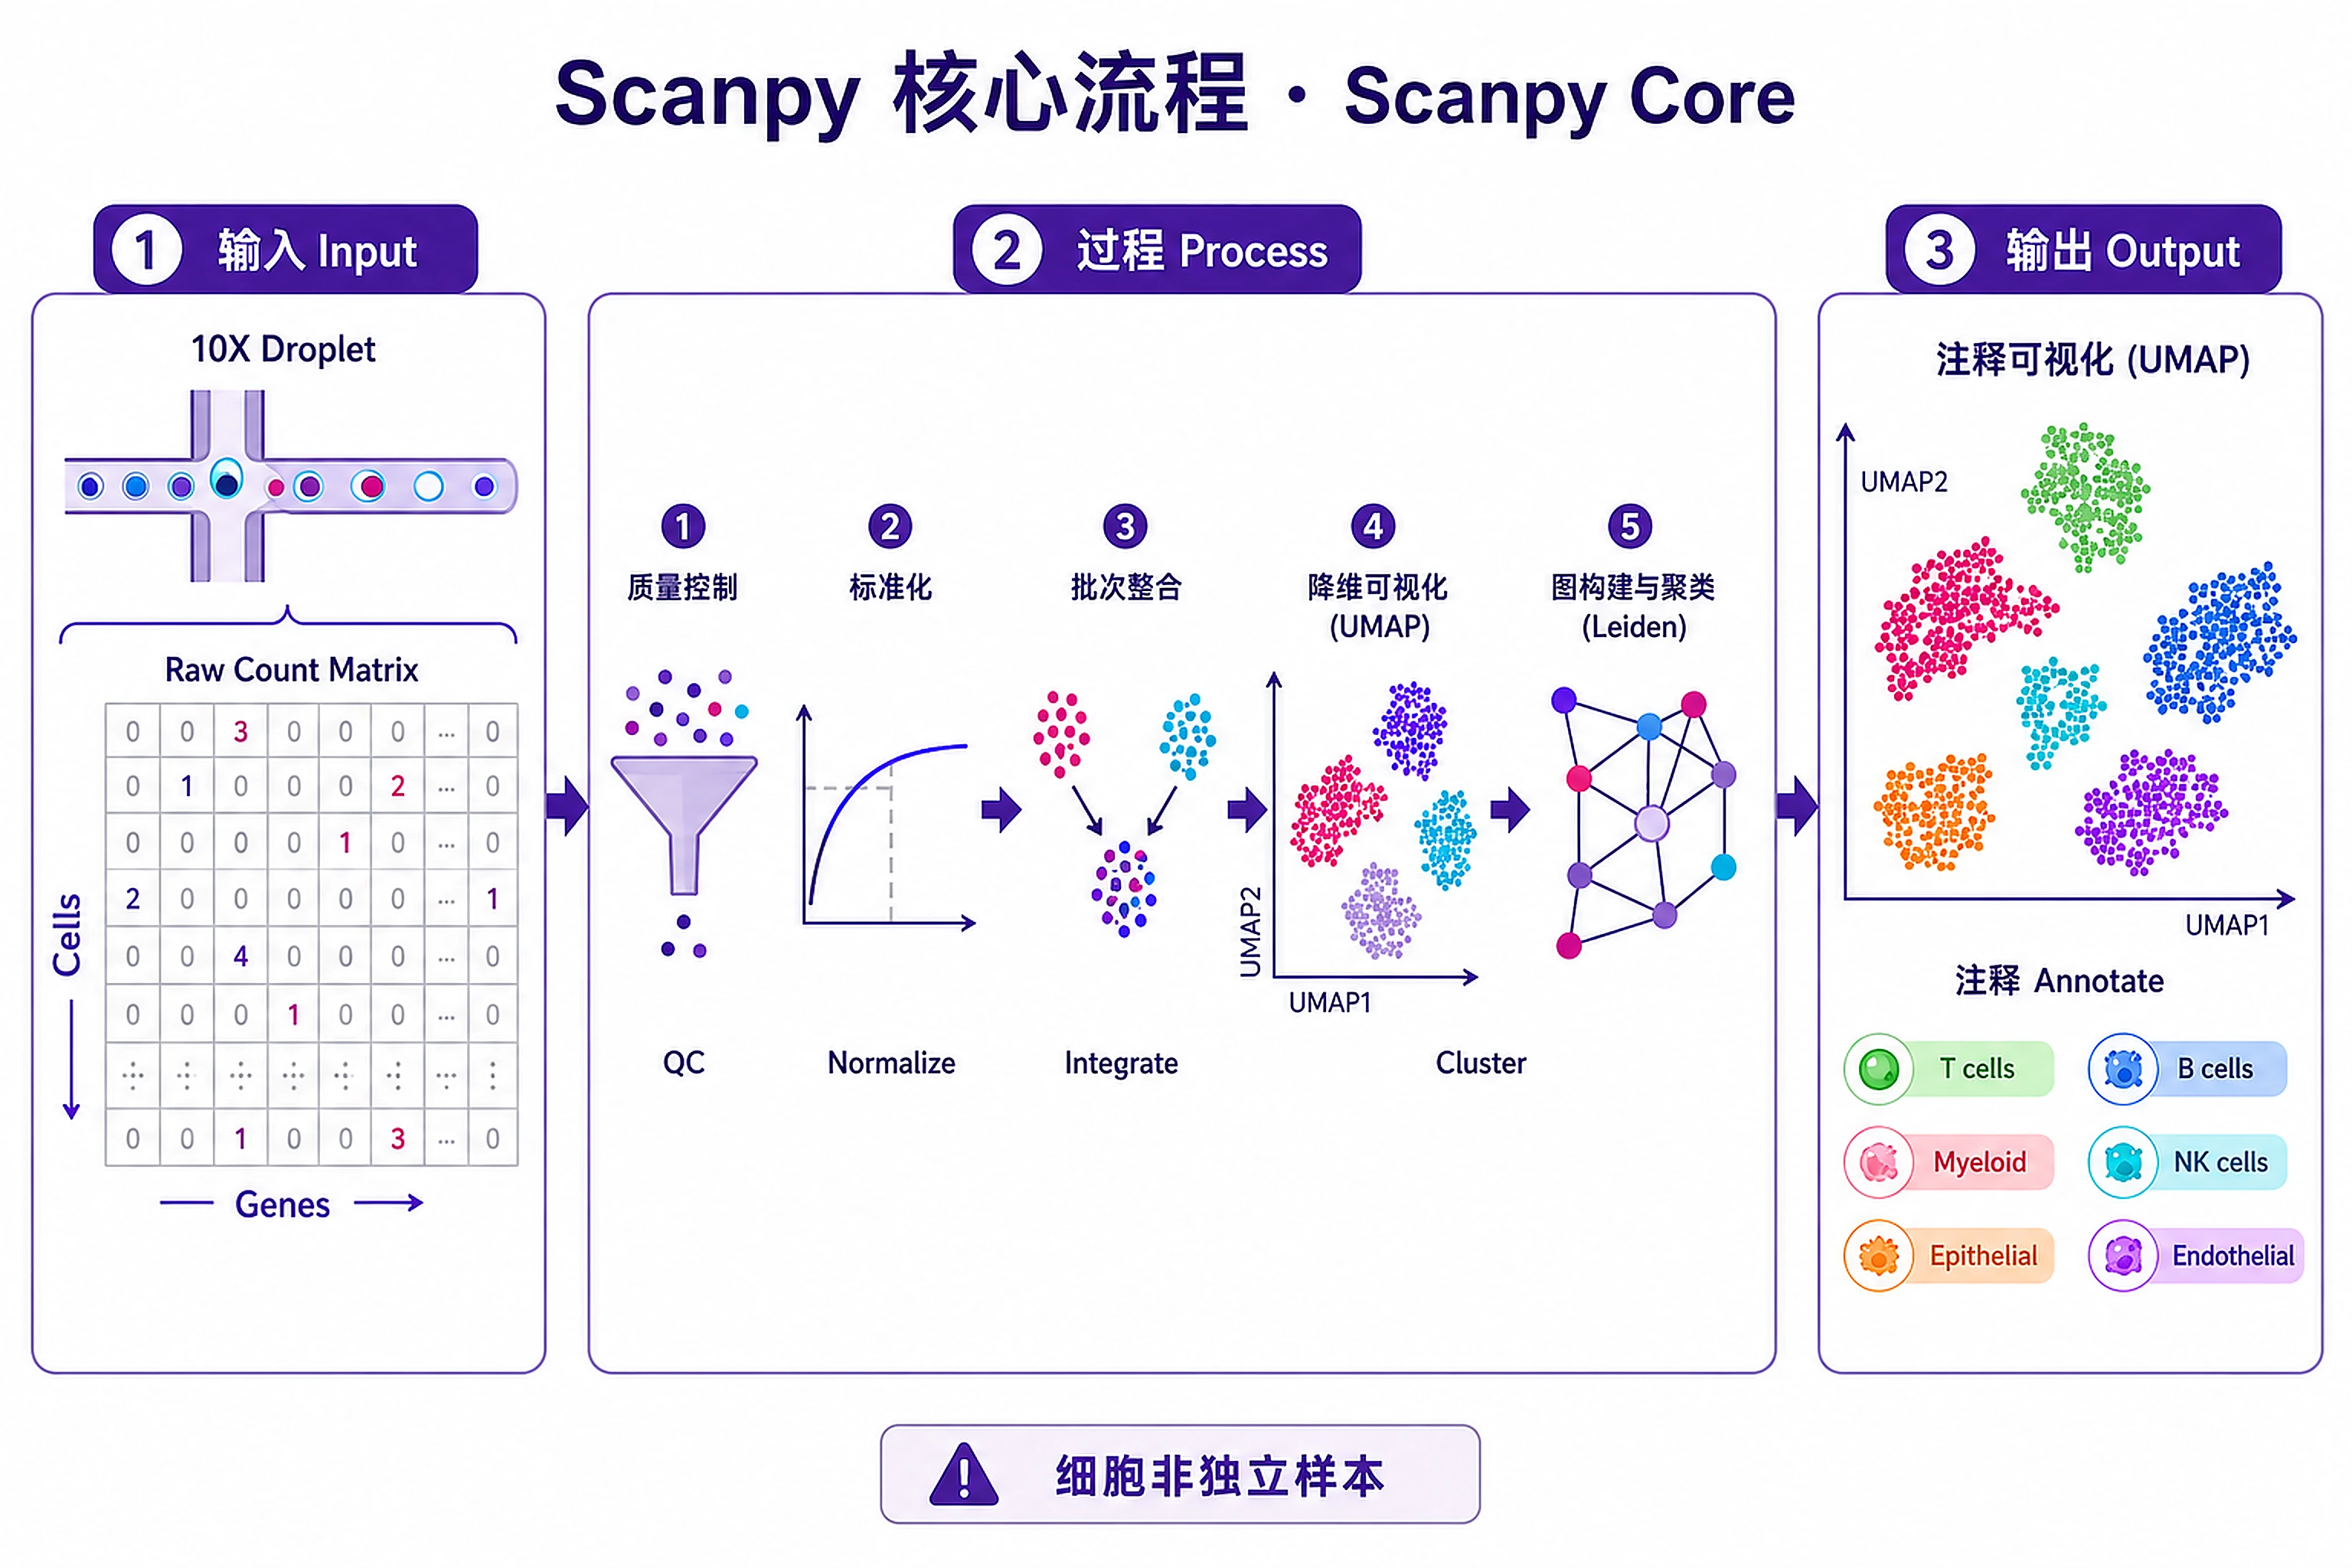
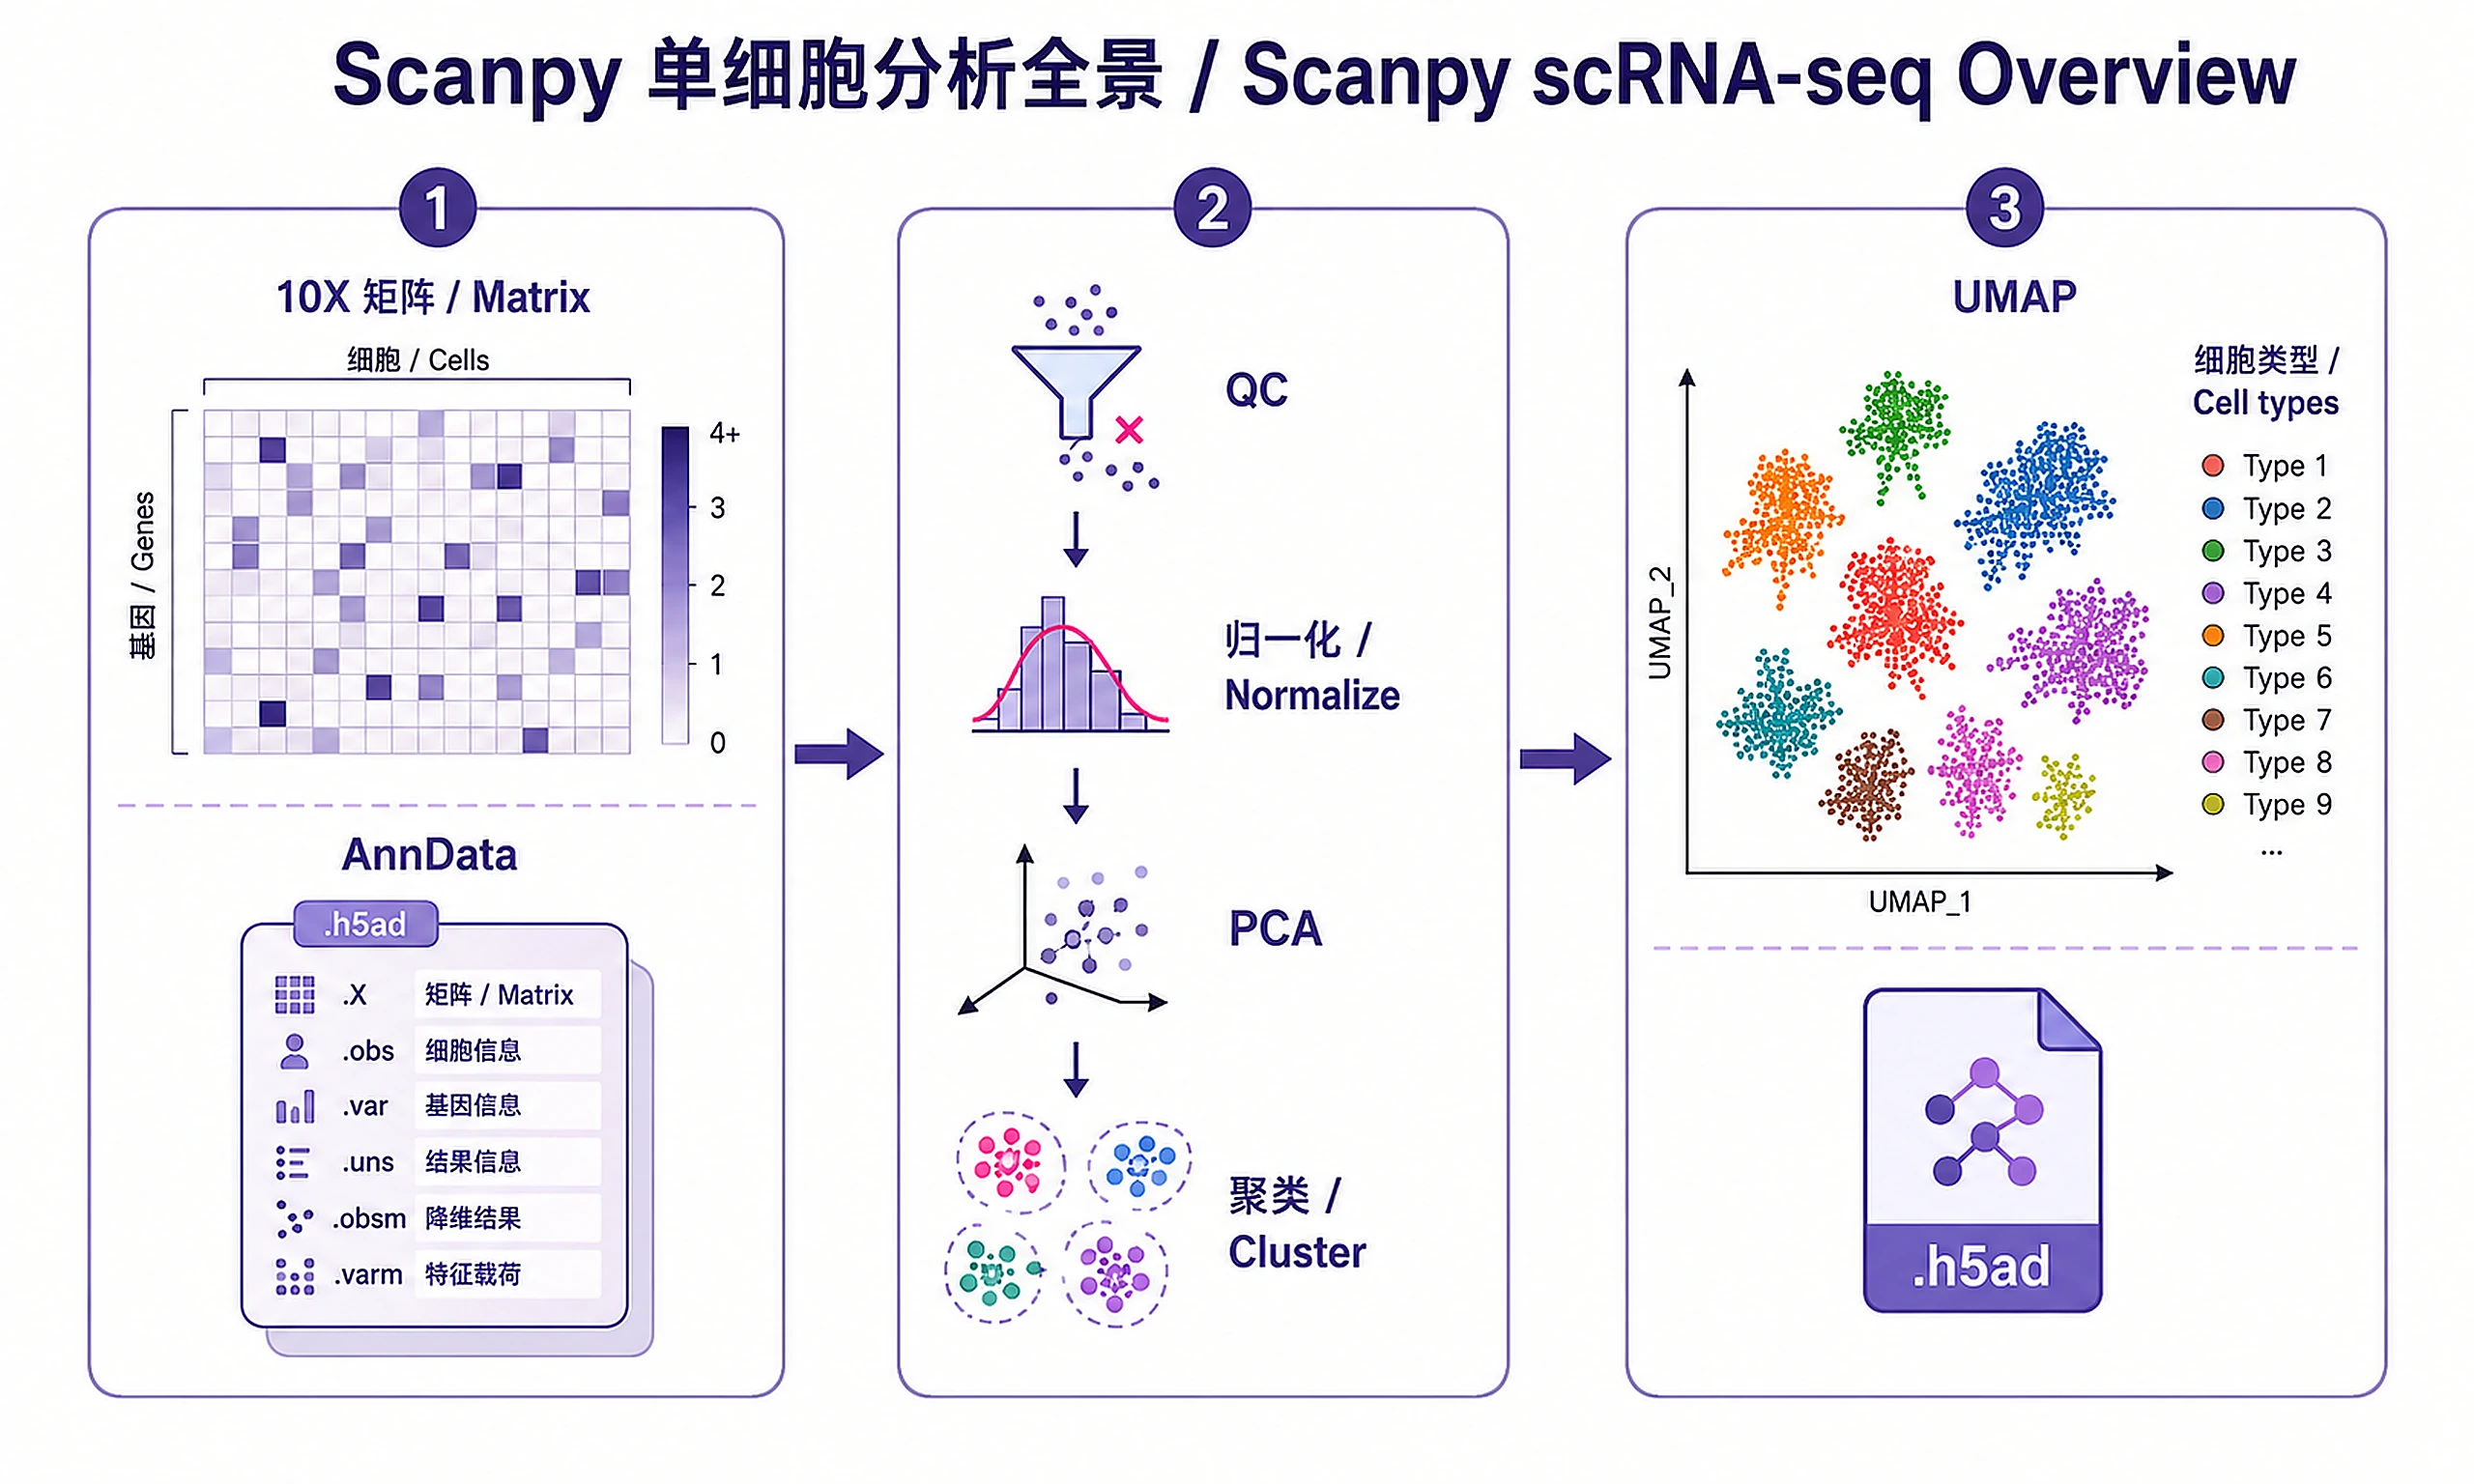
Scanpy Core Analysis
Full scRNA-seq in Scanpy: raw matrix to cell-type labels.
Overview
Problem. Take raw matrices to annotated cell types.
Learning goals
- The standard pipeline skeleton
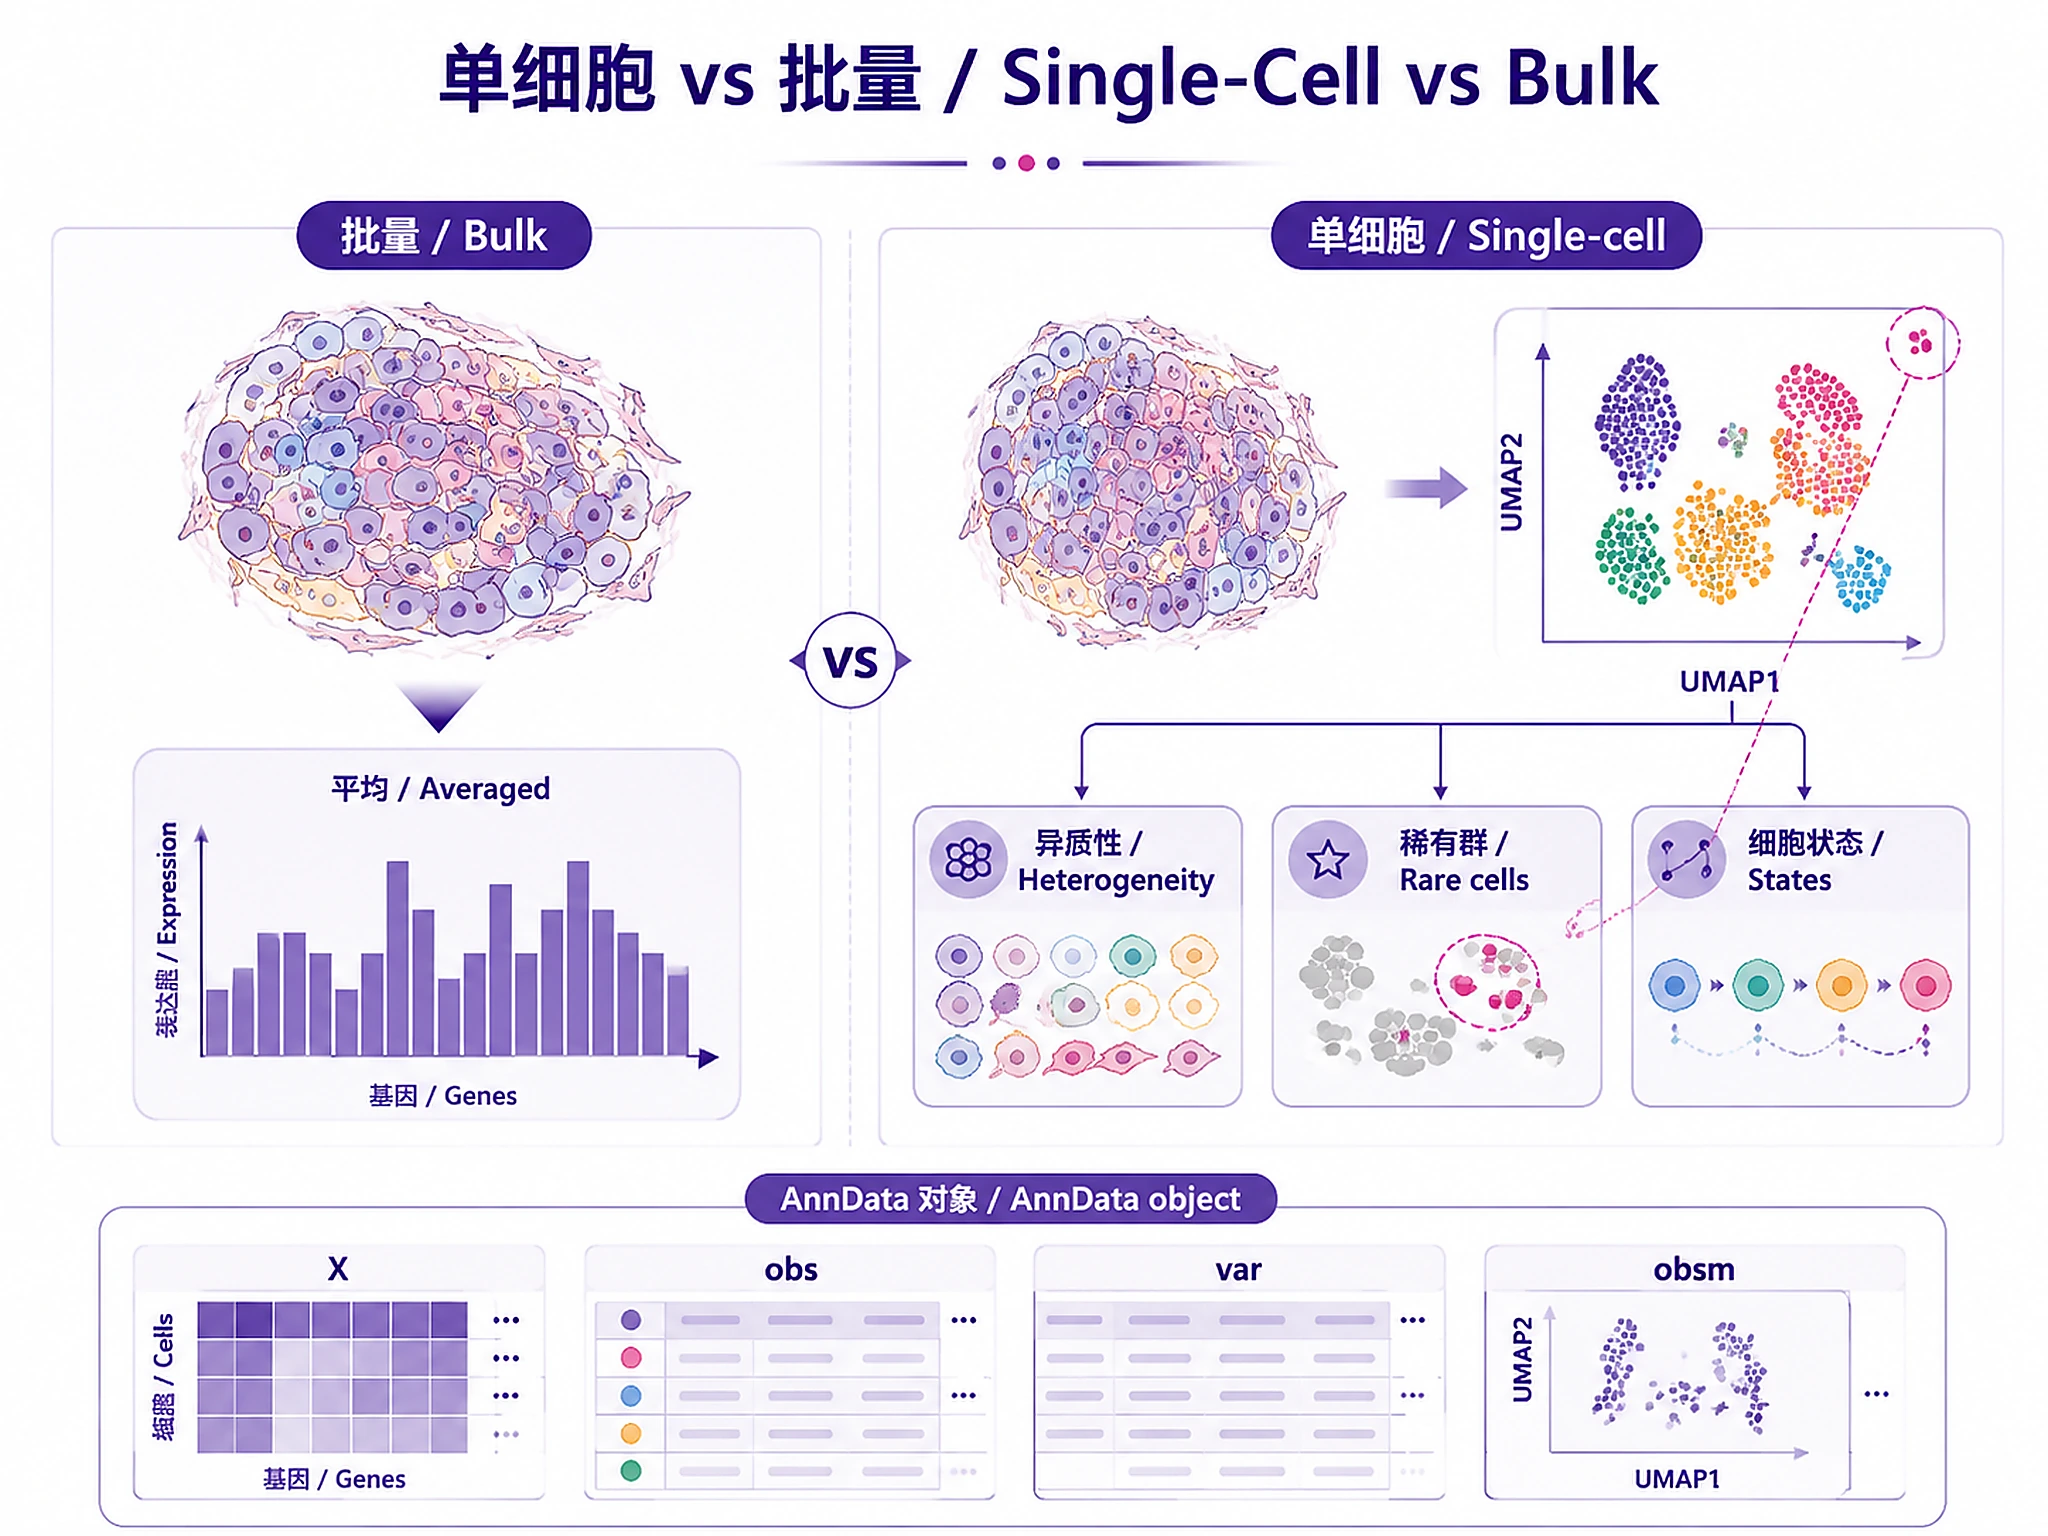
- Use pseudobulk; cells aren't independent samples
Figures
Tutorial
Complete workflow for single-cell RNA-seq analysis using Scanpy and the scverse ecosystem. Process raw data through quality control, normalization, clustering, and cell type annotation with publication-ready visualizations.
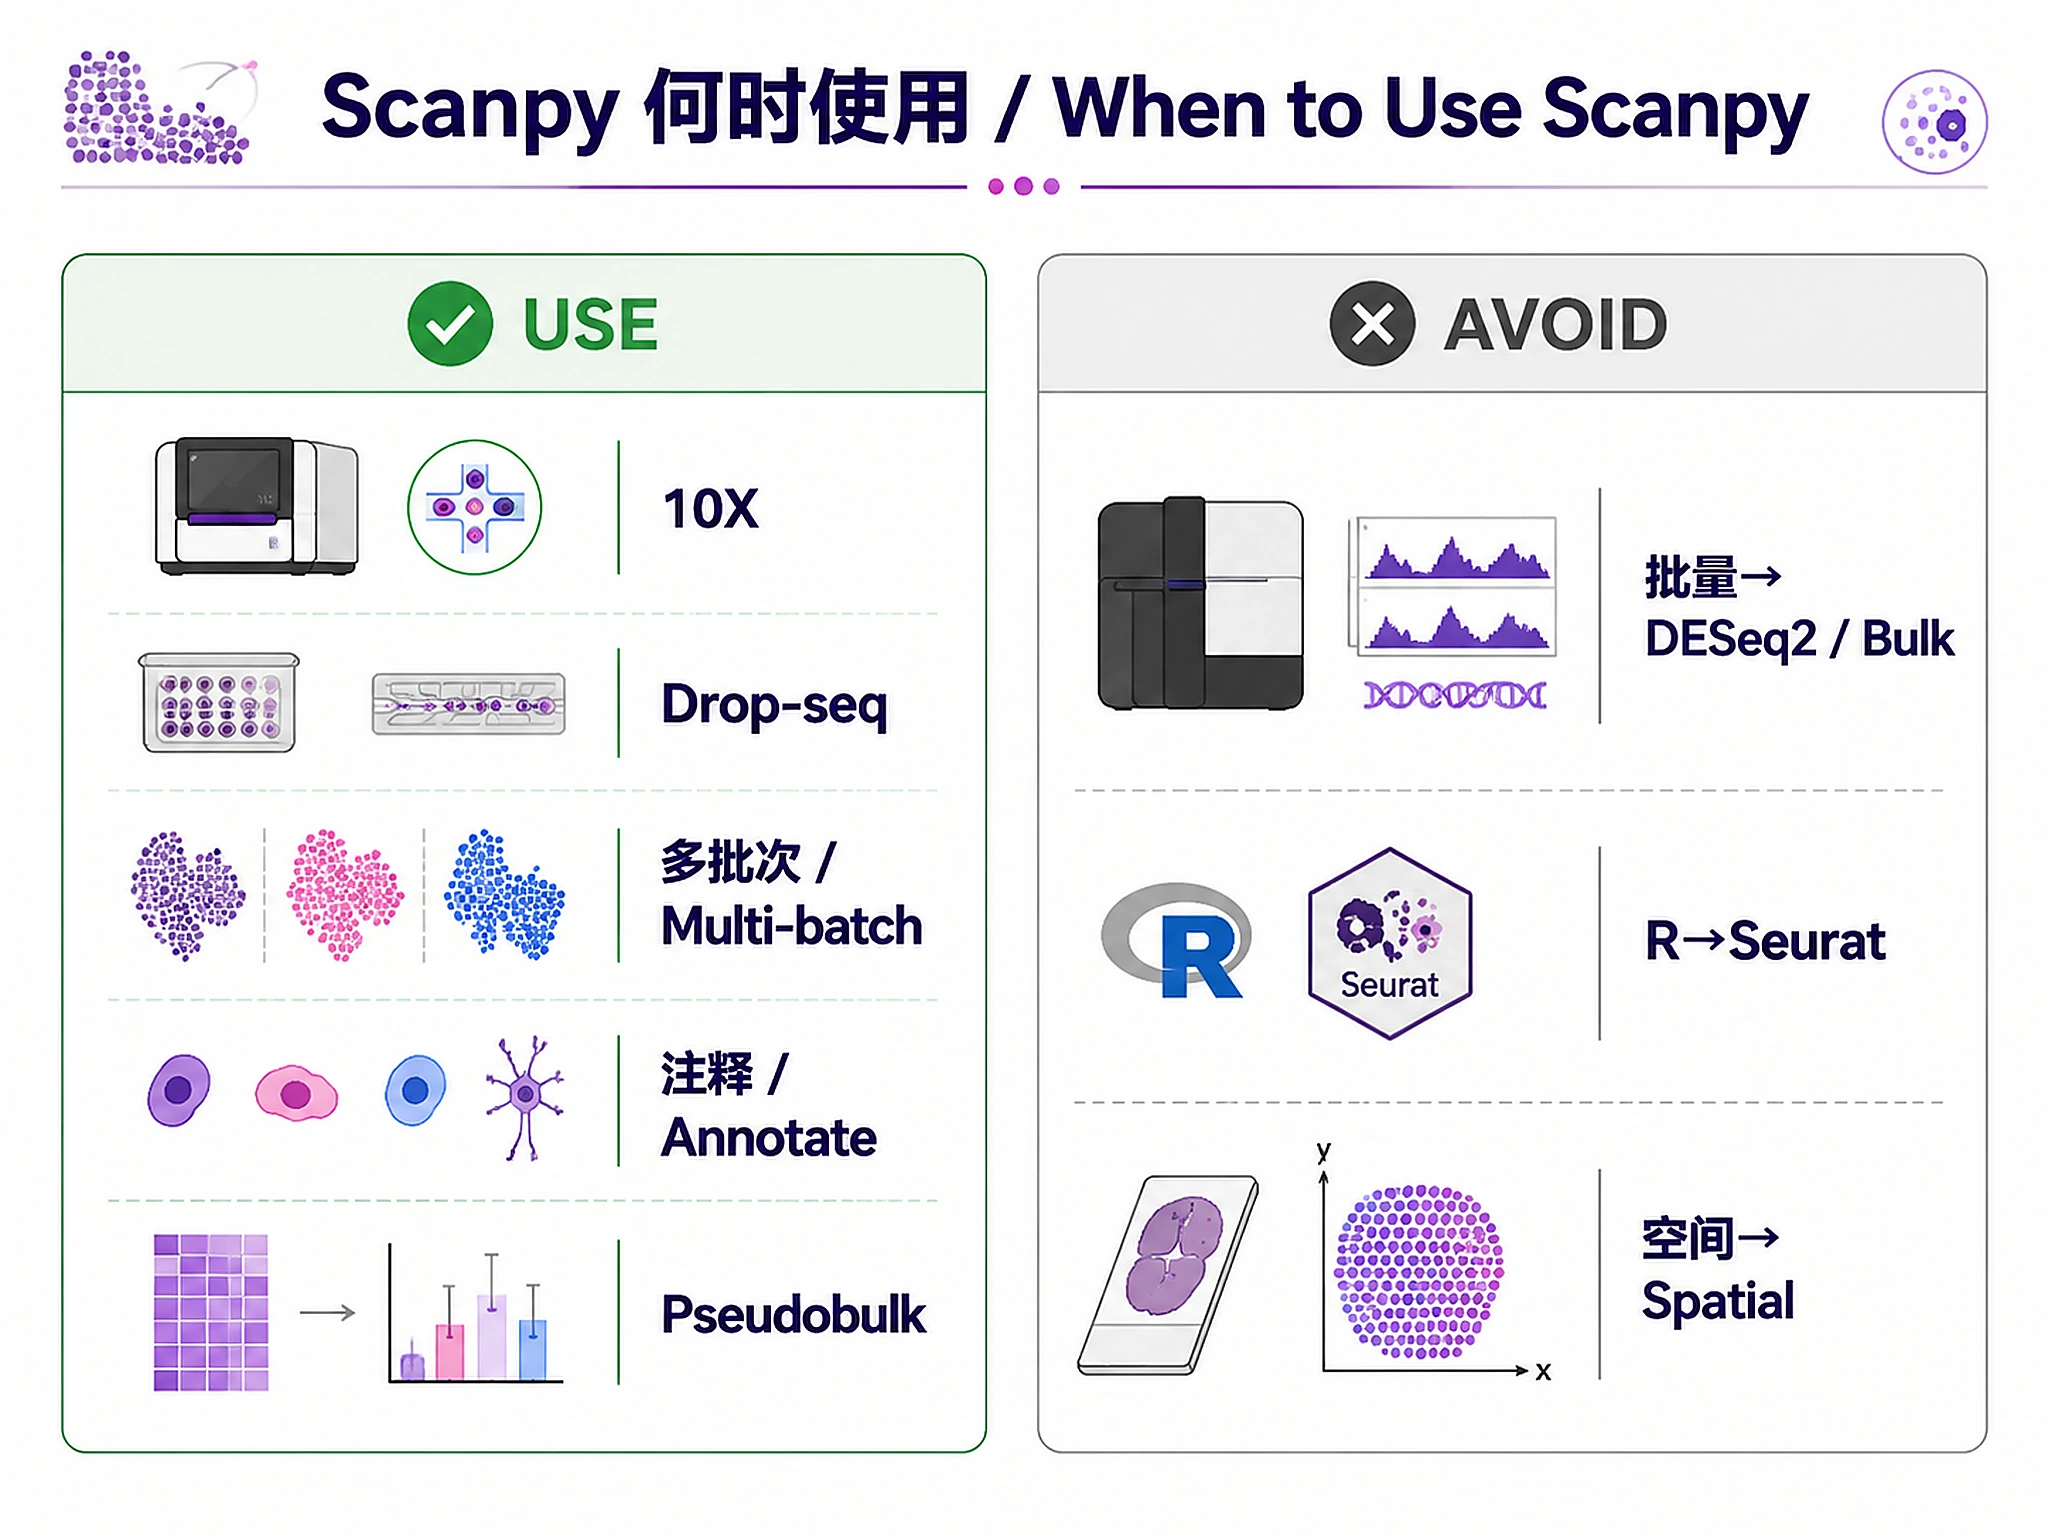
When to Use This Skill
- Analyze 10X Chromium data (CellRanger output, H5 files, raw/filtered matrices)
- Process Drop-seq, Smart-seq2, or inDrop single-cell RNA-seq data
- Integrate multi-batch data using scVI, scANVI, or Harmony
- Annotate cell types manually or with automated reference-based methods
- Compare conditions using pseudobulk differential expression (multi-sample data)
Don't use for: Bulk RNA-seq (use bulk-rnaseq-counts-to-de-deseq2), R-based scRNA-seq (use scrnaseq-seurat-core-analysis), Spatial transcriptomics (coming soon)
Installation
| Package | Version | License | Commercial Use | Installation |
|---|---|---|---|---|
| scanpy | ≥1.9 | BSD-3-Clause | Permitted | pip install scanpy |
| anndata | ≥0.8 | BSD-3-Clause | Permitted | pip install anndata |
| numpy | ≥1.20 | BSD-3-Clause | Permitted | pip install numpy |
| pandas | ≥1.3 | BSD-3-Clause | Permitted | pip install pandas |
| matplotlib | ≥3.4 | PSF | Permitted | pip install matplotlib |
| seaborn | ≥0.12 | BSD-3-Clause | Permitted | pip install seaborn |
| adjustText | ≥0.8 | MIT | Permitted | pip install adjustText |
| scrublet | ≥0.2.3 | MIT | Permitted | pip install scrublet |
| scvi-tools | ≥1.0 | BSD-3-Clause | Permitted | pip install scvi-tools |
| harmonypy | ≥0.0.9 | GPL-3 | Permitted | pip install harmonypy |
| celltypist | ≥1.0 | MIT | Permitted | pip install celltypist |
| pydeseq2 | ≥0.4 | MIT | Permitted | pip install pydeseq2 |
Install all: pip install scanpy anndata numpy pandas matplotlib seaborn adjustText scrublet
Minimum versions: Python ≥3.8, scanpy ≥1.9, anndata ≥0.8
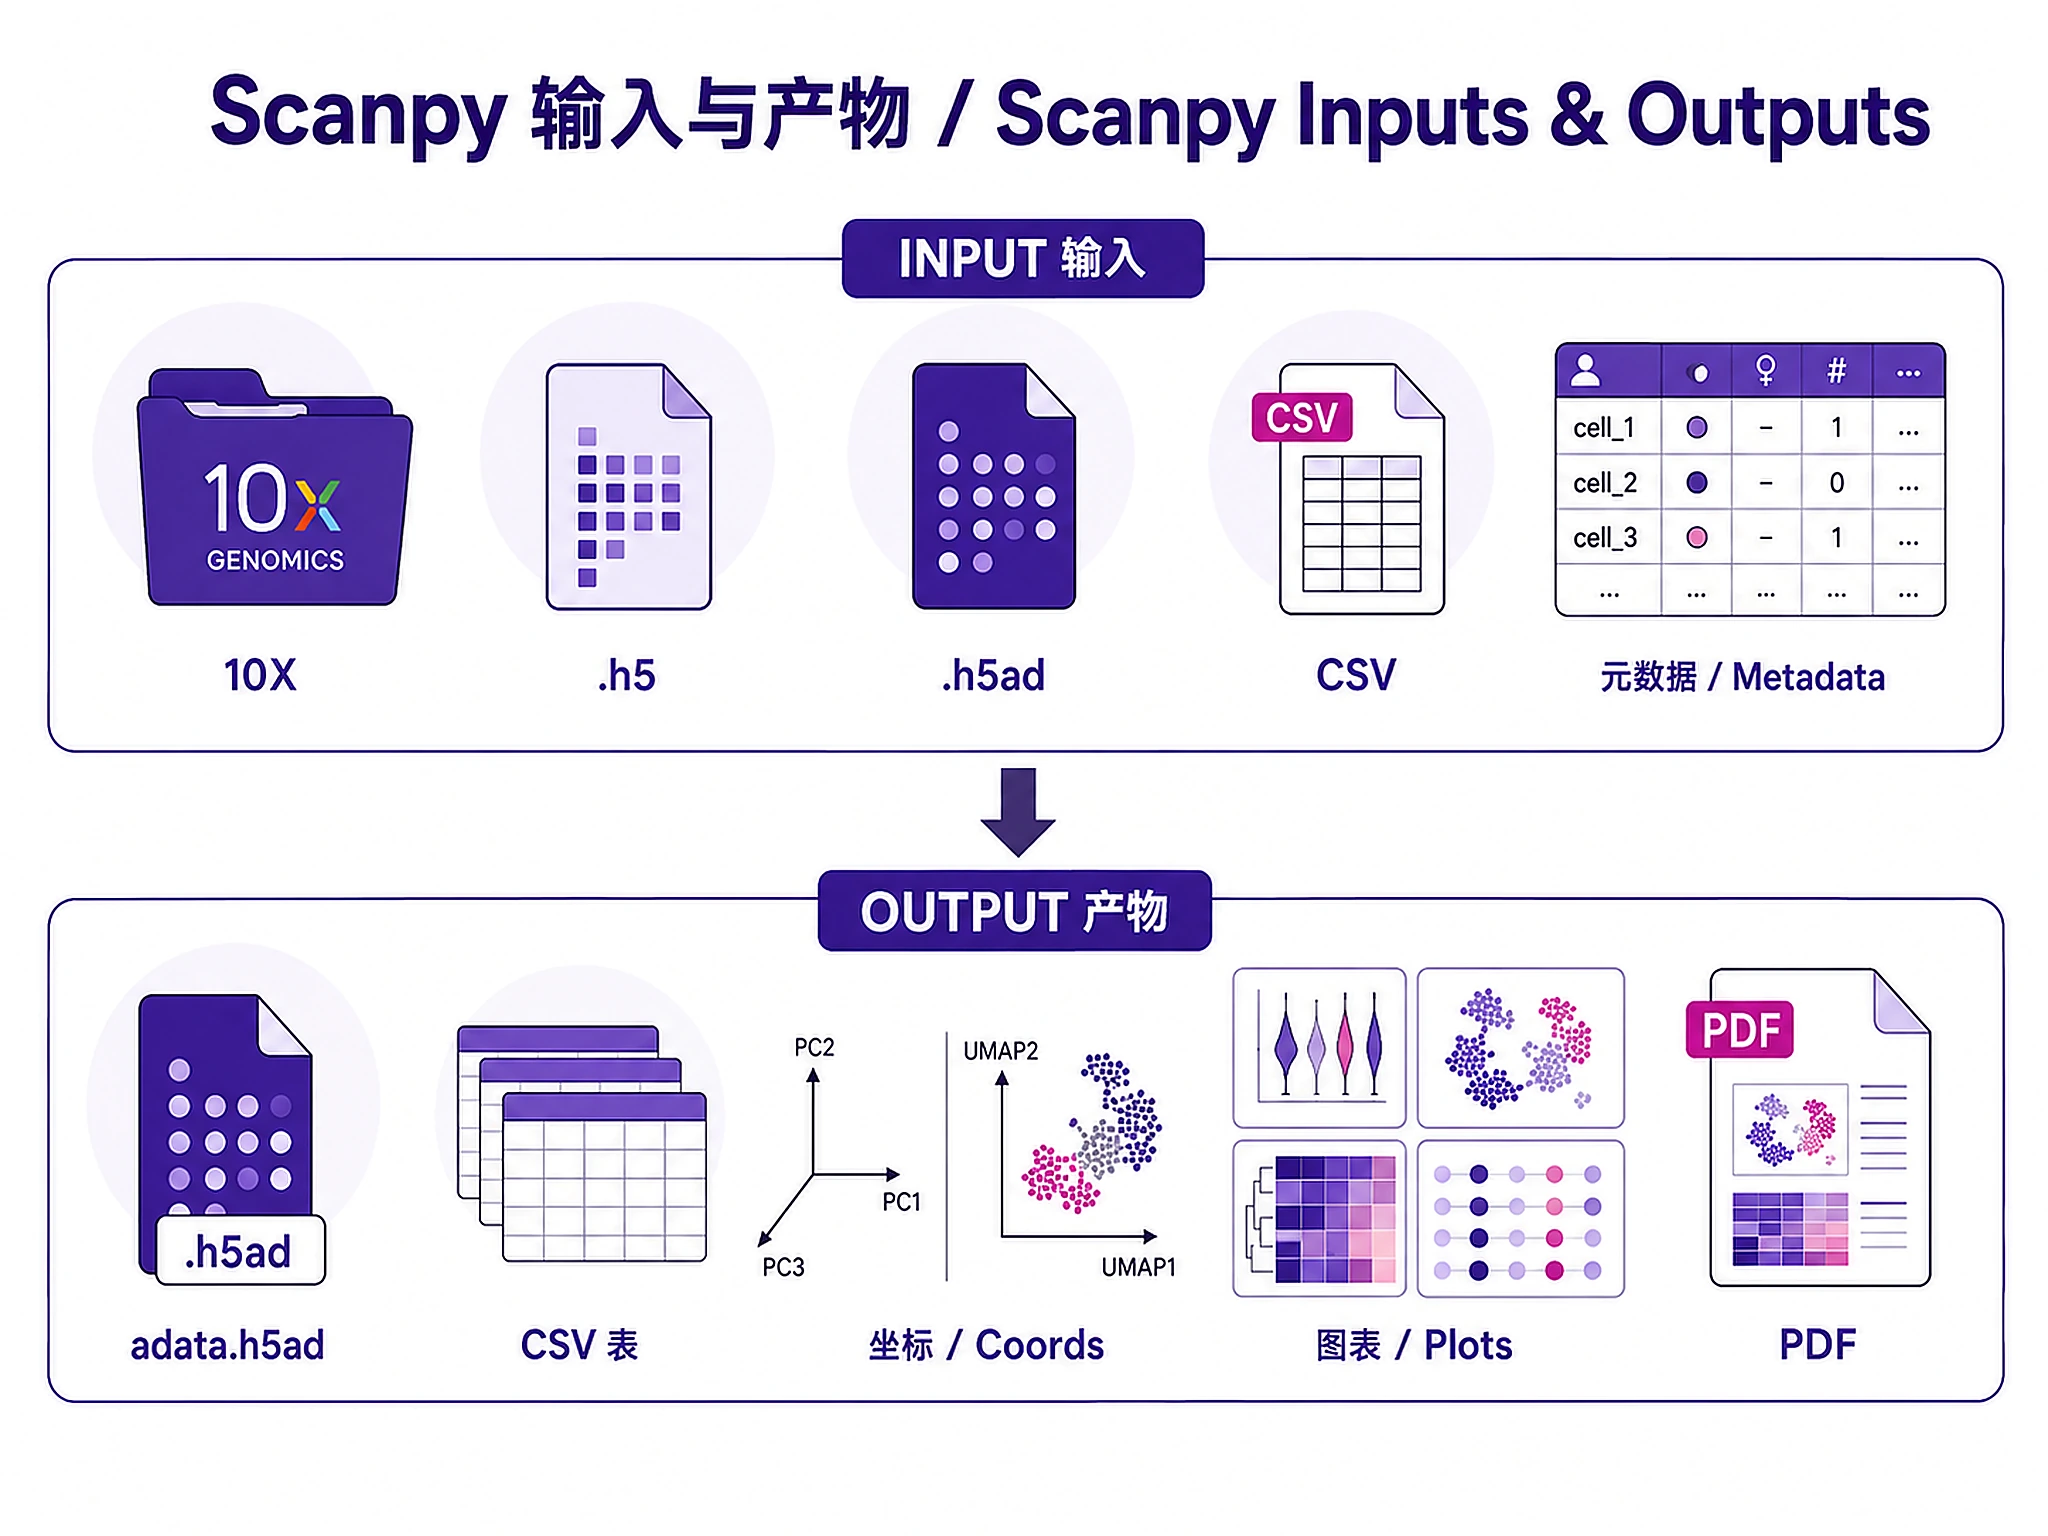
Inputs
Required:
- Raw or filtered count matrix: CellRanger output (
filtered_feature_bc_matrix/), H5 files (.h5), AnnData (.h5ad), or count matrices (CSV/TSV)
Optional: Sample metadata (CSV/TSV) with sample IDs, conditions, batches, donor IDs
Data requirements: Min 500 cells/sample (1000+ recommended), Human or Mouse, UMI-based or read counts. See references/qc_guidelines.md for tissue-specific thresholds.
Outputs
Analysis objects:
adata_processed.h5ad- Complete annotated AnnData object- Load with:
import scanpy as sc; adata = sc.read_h5ad('adata_processed.h5ad') - Contains: raw counts, normalized data, QC metrics, clusters, cell types, UMAP/PCA
- Note:
adata.Xcontains log-normalized (not scaled) data. Scaled data is used internally for PCA but not stored in .X. This is correct for downstream analysis (DE, visualization). - Required for: trajectory inference, cell-cell communication, downstream analyses
Reports:
scrna_analysis_report.pdf- Agent-generated comprehensive PDF with Methods, Results, Figures, Conclusionsanalysis_summary.txt- Text summary of dataset, QC, clustering, integration (generated byexport_anndata_results())
⚠️ PDF style rules:
- US Letter page size (8.5 × 11 in) — always set page dimensions explicitly; do not rely on library defaults
- No Unicode superscripts — use
3.36e-06or3.36 × 10^(-6), not Unicode superscript chars (they render as ■ in PDF fonts) - No half-empty pages — group headings with their content; only page-break before major sections (Results, Conclusions)
- Figures ≥80% page width — multi-panel figures must be large enough to read; never embed below 50% width
Tables: cell_metadata.csv, expression_matrix_counts.csv, expression_matrix_normalized.csv, pca_coordinates.csv, umap_coordinates.csv, cluster_markers_all.csv, {celltype}_deseq2_results.csv
Visualizations (PNG + SVG at 300 DPI): QC violins, UMAP plots, marker heatmaps, dot plots, volcano/MA plots
Clarification Questions
Default settings (use unless user specifies otherwise):
- Format: Filtered 10X CellRanger output | Species: Human | Tissue: PBMC
- Normalization: Standard (target sum + log1p) | Clustering: Test 0.4, 0.6, 0.8, 1.0
1. Input Files (ASK THIS FIRST):
- Do you have specific single-cell data file(s) to analyze?
- Expected: CellRanger output, H5, H5AD, or count matrix
- Or use example/demo data? (PBMC 3k dataset available)
2. Data format and species:
- (If using your own data) What format? Filtered 10X (default), Raw 10X, H5, H5AD? Human or Mouse? Tissue type?
- (If using example data) Defaults apply: filtered 10X, human, PBMC — skip to Q3
3. Batch structure:
- a) Single sample (no integration needed)
- b) Multiple batches (scVI recommended, Harmony for speed)
4. Analysis scope:
- a) Standard: QC + normalize + cluster + annotate (recommended)
- b) Standard + pseudobulk DE (requires ≥2 samples per condition)
- c) Custom: specify which steps
5. Clustering granularity:
- a) Coarse (0.3-0.5) — major cell types only
- b) Standard (0.6-0.8) — recommended
- c) Fine (1.0-1.5) — subtypes
- d) Test multiple: 0.4, 0.6, 0.8, 1.0 (recommended)
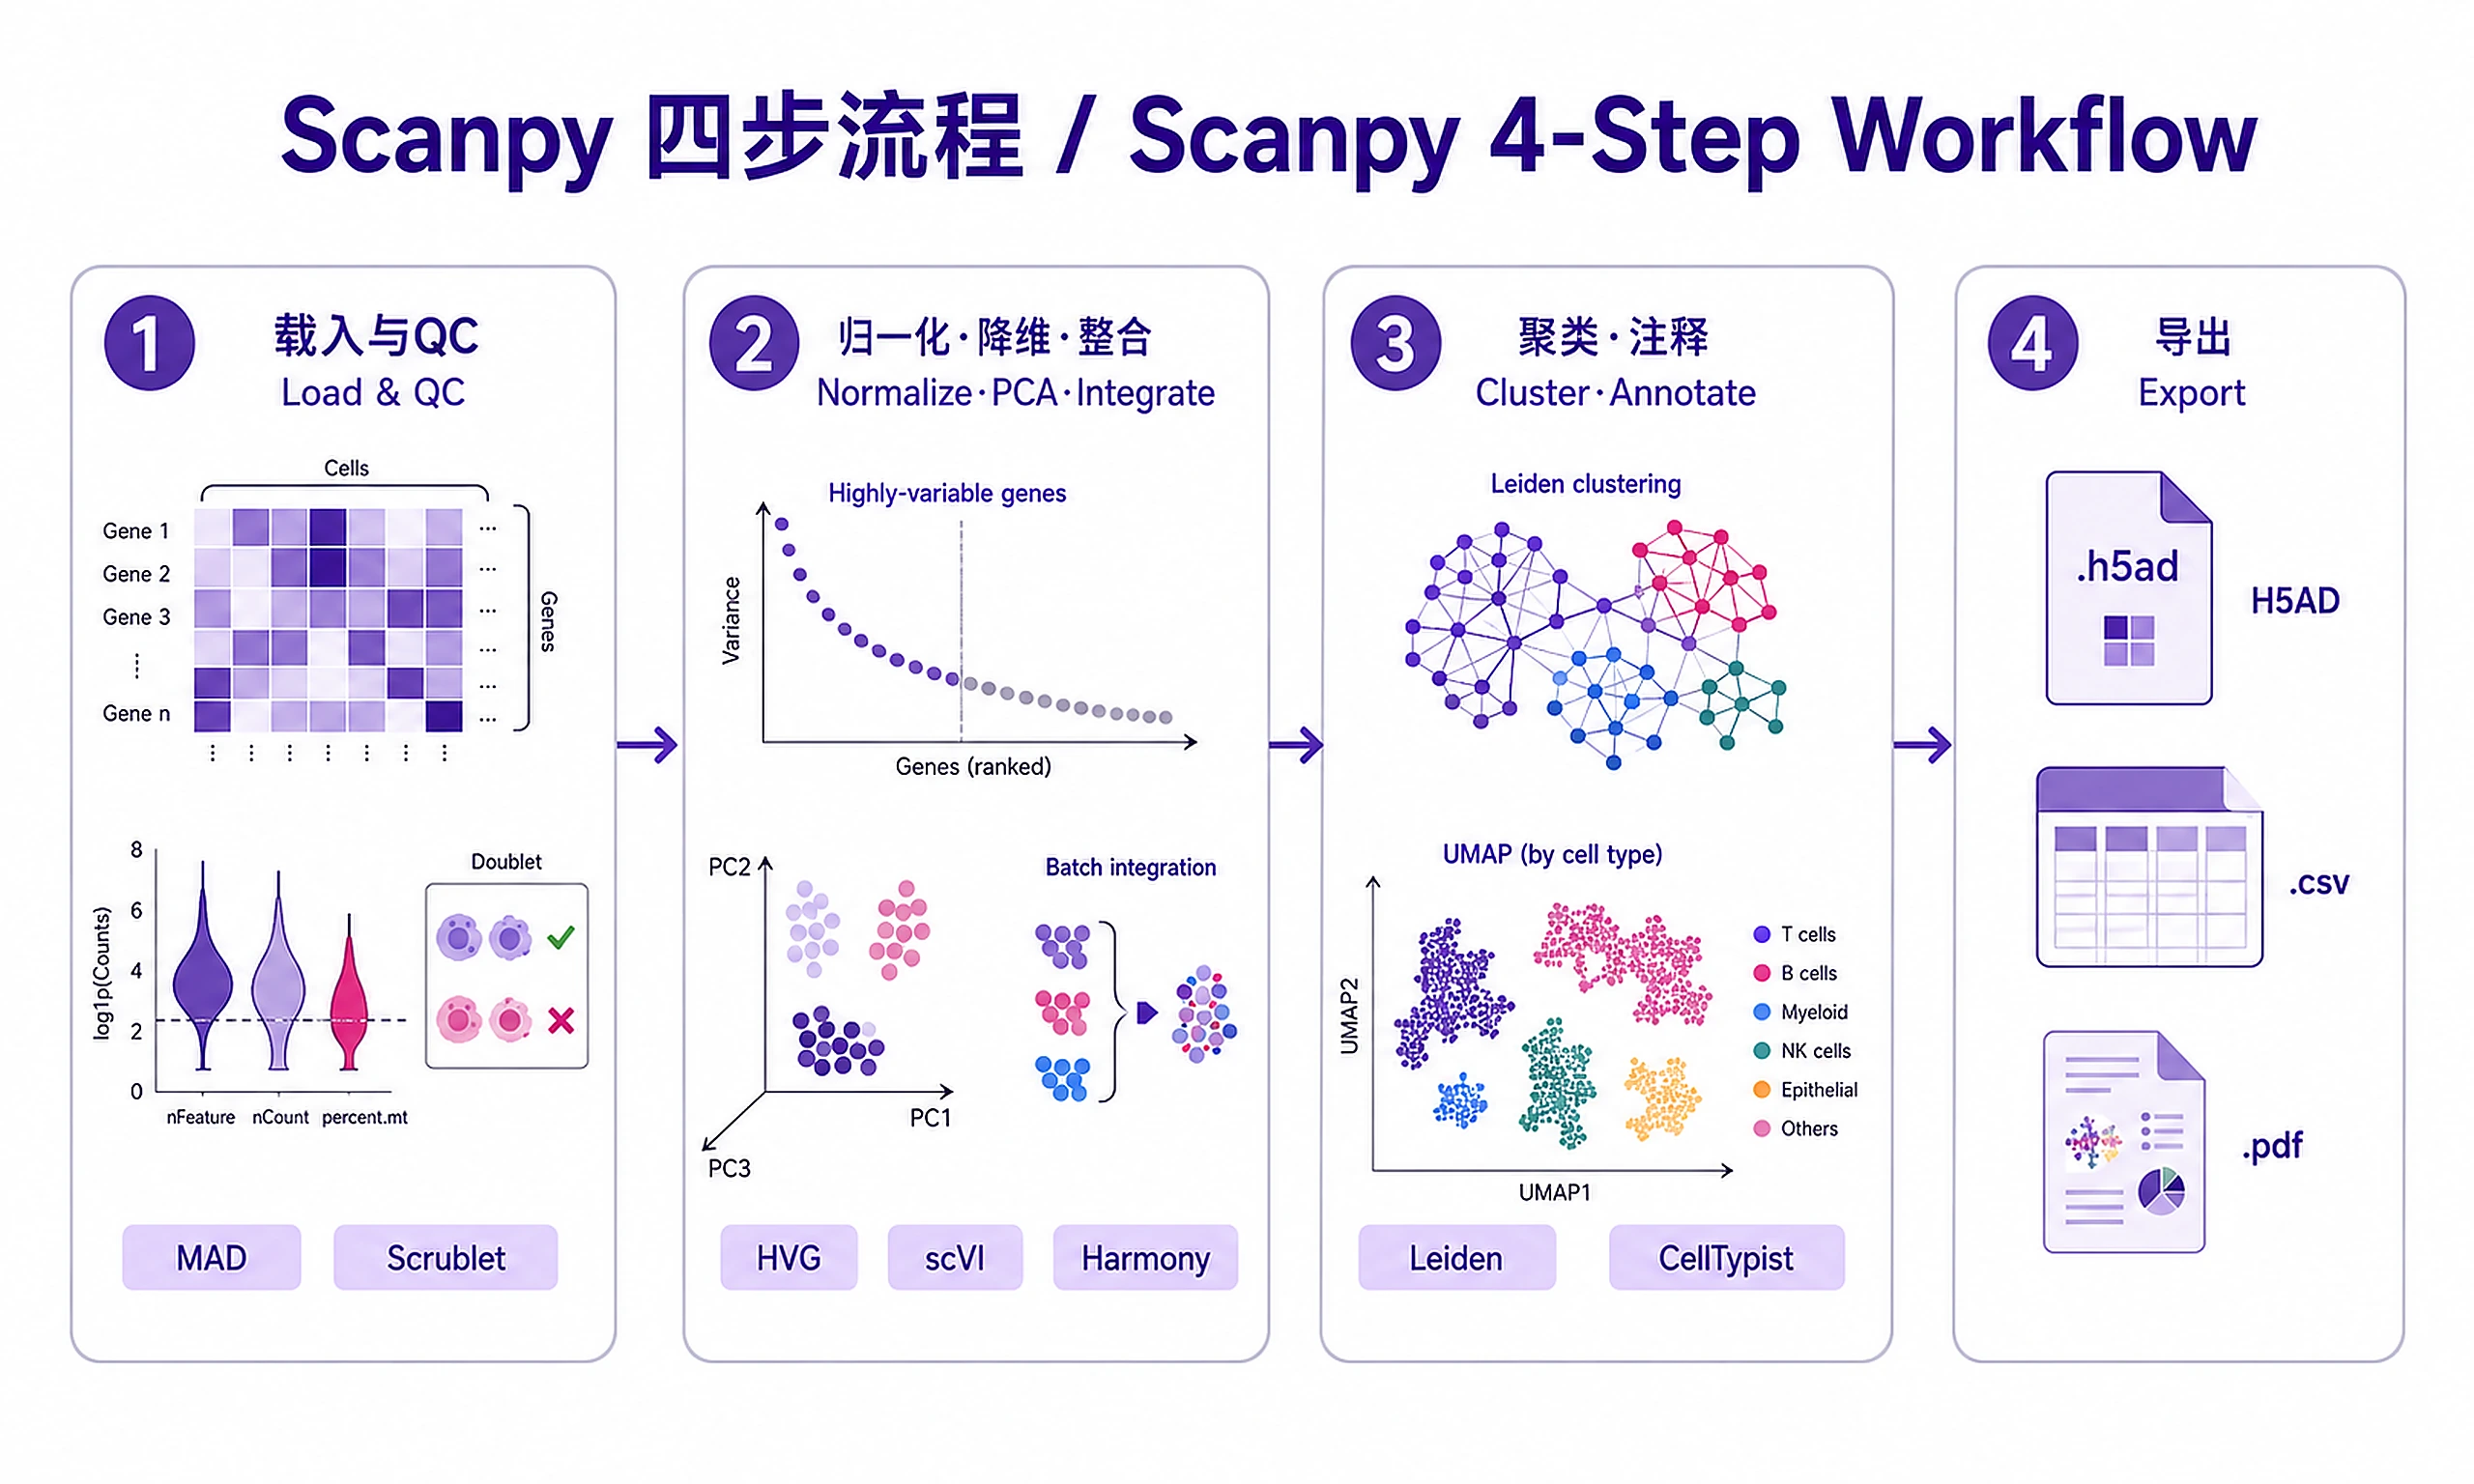
Standard Workflow
🚨 MANDATORY: USE SCRIPTS EXACTLY AS SHOWN - DO NOT WRITE INLINE CODE 🚨
Detailed step-by-step code: references/workflow-details.md
CRITICAL - DO NOT:
- Write inline analysis code → STOP: Use the script functions
- Write custom export code → STOP: Use
export_anndata_results() - Skip verification messages → STOP: Check for "✓" messages after each step
IF SCRIPTS FAIL - Script Failure Hierarchy:
- Fix and Retry (90%) - Install missing package, re-run script
- Modify Script (5%) - Edit the script file itself, document changes
- Use as Reference (4%) - Read script, adapt approach, cite source
- Write from Scratch (1%) - Only if genuinely impossible, explain why
NEVER skip directly to writing inline code without trying the script first.
Step 1 — Load and QC
# Load data (Option A: example, Option B: your data)
from load_example_data import load_example_data
adata = load_example_data("pbmc3k")

# QC metrics + adaptive filtering + doublet detection
from qc_metrics import calculate_qc_metrics, batch_mad_outlier_detection
from filter_cells import run_scrublet_detection, filter_by_mad_outliers
adata = calculate_qc_metrics(adata, species="human")
adata = batch_mad_outlier_detection(adata, batch_key="batch")  # creates 'outlier' column
adata = run_scrublet_detection(adata, batch_key="batch")
adata = filter_by_mad_outliers(adata, remove_doublets=True)
DO NOT write inline QC code. Doublet rate auto-scales per batch (~0.8% per 1,000 cells). Aim for >70% cell retention. For raw data, prepend ambient RNA correction: references/ambient_rna_correction.md
✅ VERIFICATION: "✓ Data loaded successfully!" → QC metrics added → filtering summary with retention %.
Step 2 — Normalize, reduce, integrate
from normalize_data import run_standard_normalization
from find_variable_genes import find_highly_variable_genes
from scale_and_pca import scale_data, run_pca_analysis
adata = run_standard_normalization(adata, target_sum=1e4)
adata = find_highly_variable_genes(adata, n_top_genes=2000)
adata = scale_data(adata, vars_to_regress=["total_counts", "pct_counts_mt"])
adata = run_pca_analysis(adata, n_pcs=50)

# Multi-batch only: integration + diagnostics
from integrate_scvi import run_scvi_integration
from integration_diagnostics import compute_lisi_scores
adata = run_scvi_integration(adata, batch_key="batch", condition_key="condition")
lisi = compute_lisi_scores(adata, batch_key="batch", use_rep="X_scVI")
DO NOT write inline normalization or integration code. The integration script auto-detects batch-condition confounding. Details →
✅ VERIFICATION:
- Normalization:
"✓ Normalization complete" - PCA:
"PCA loadings verified: N HVG rows have non-zero loadings"— if you see a WARNING about zero loadings, re-run PCA withuse_highly_variable=True - After PCA, call
suggest_n_pcs(adata)to get recommended PC count for Step 3 - Integration (multi-batch): LISI scores printed
Step 3 — Cluster, annotate, visualize
from cluster_cells import build_neighbor_graph, cluster_leiden_multiple_resolutions
from run_umap import run_umap_reduction
from find_markers import find_all_cluster_markers
from plot_dimreduction import plot_umap_clusters
use_rep = "X_scVI" if "X_scVI" in adata.obsm else "X_pca"
# Default n_pcs=30 is standard. NEVER use <15 PCs.
adata = build_neighbor_graph(adata, use_rep=use_rep, n_neighbors=10, n_pcs=30)
adata = cluster_leiden_multiple_resolutions(adata, resolutions=[0.4, 0.6, 0.8, 1.0])
adata = run_umap_reduction(adata)
markers = find_all_cluster_markers(adata, cluster_key="leiden_0.8")
plot_umap_clusters(adata, cluster_key="leiden_0.8", output_dir="results/umap")

# Annotate (manual or CellTypist)
from annotate_celltypes import annotate_clusters_manual
annotations = {"0": "CD4 T cells", "1": "CD14+ Monocytes", ...}
adata = annotate_clusters_manual(adata, annotations, cluster_key="leiden_0.8")
DO NOT write inline clustering or annotation code. CellTypist validates labels post-hoc (flags suspect ILC/HSC, contamination, low-complexity). Markers →
⚠️ n_pcs for neighbor graph: Default is 30 PCs (standard). Using <15 PCs risks collapsing distinct populations. If you used suggest_n_pcs() in Step 2, pass that value here.
For pseudobulk DE (multi-sample, ≥2 replicates/condition): scripts/pseudobulk_de.py. Script blocks with N=1. Details →
✅ VERIFICATION:
- Cluster counts → UMAP plots saved → marker genes identified → cell type annotations added
- After
find_all_cluster_markers(): verify the returned DataFrame columns and printmarkers.head()to confirm values are sensible before saving to CSV.
Step 4 — Export results
from export_results import export_anndata_results

export_anndata_results(adata, output_dir="results", cluster_key="cell_type")
DO NOT write custom export code. Use export_anndata_results().
Exports: H5AD, expression matrices (raw + normalized CSV), cell metadata, UMAP/PCA coordinates, text summary.
✅ VERIFICATION: You MUST see:
=== Export Complete ===
If you don't see "Export Complete": The export did not complete. Re-run the export function.
⚠️ Large datasets (>20k cells): H5AD export may take 10-60 seconds depending on dataset size. The script prints progress updates (size estimate, compression method, elapsed time). If export appears stuck for >2 minutes, interrupt and retry with save_h5ad(adata, path, compression=None) to skip compression.
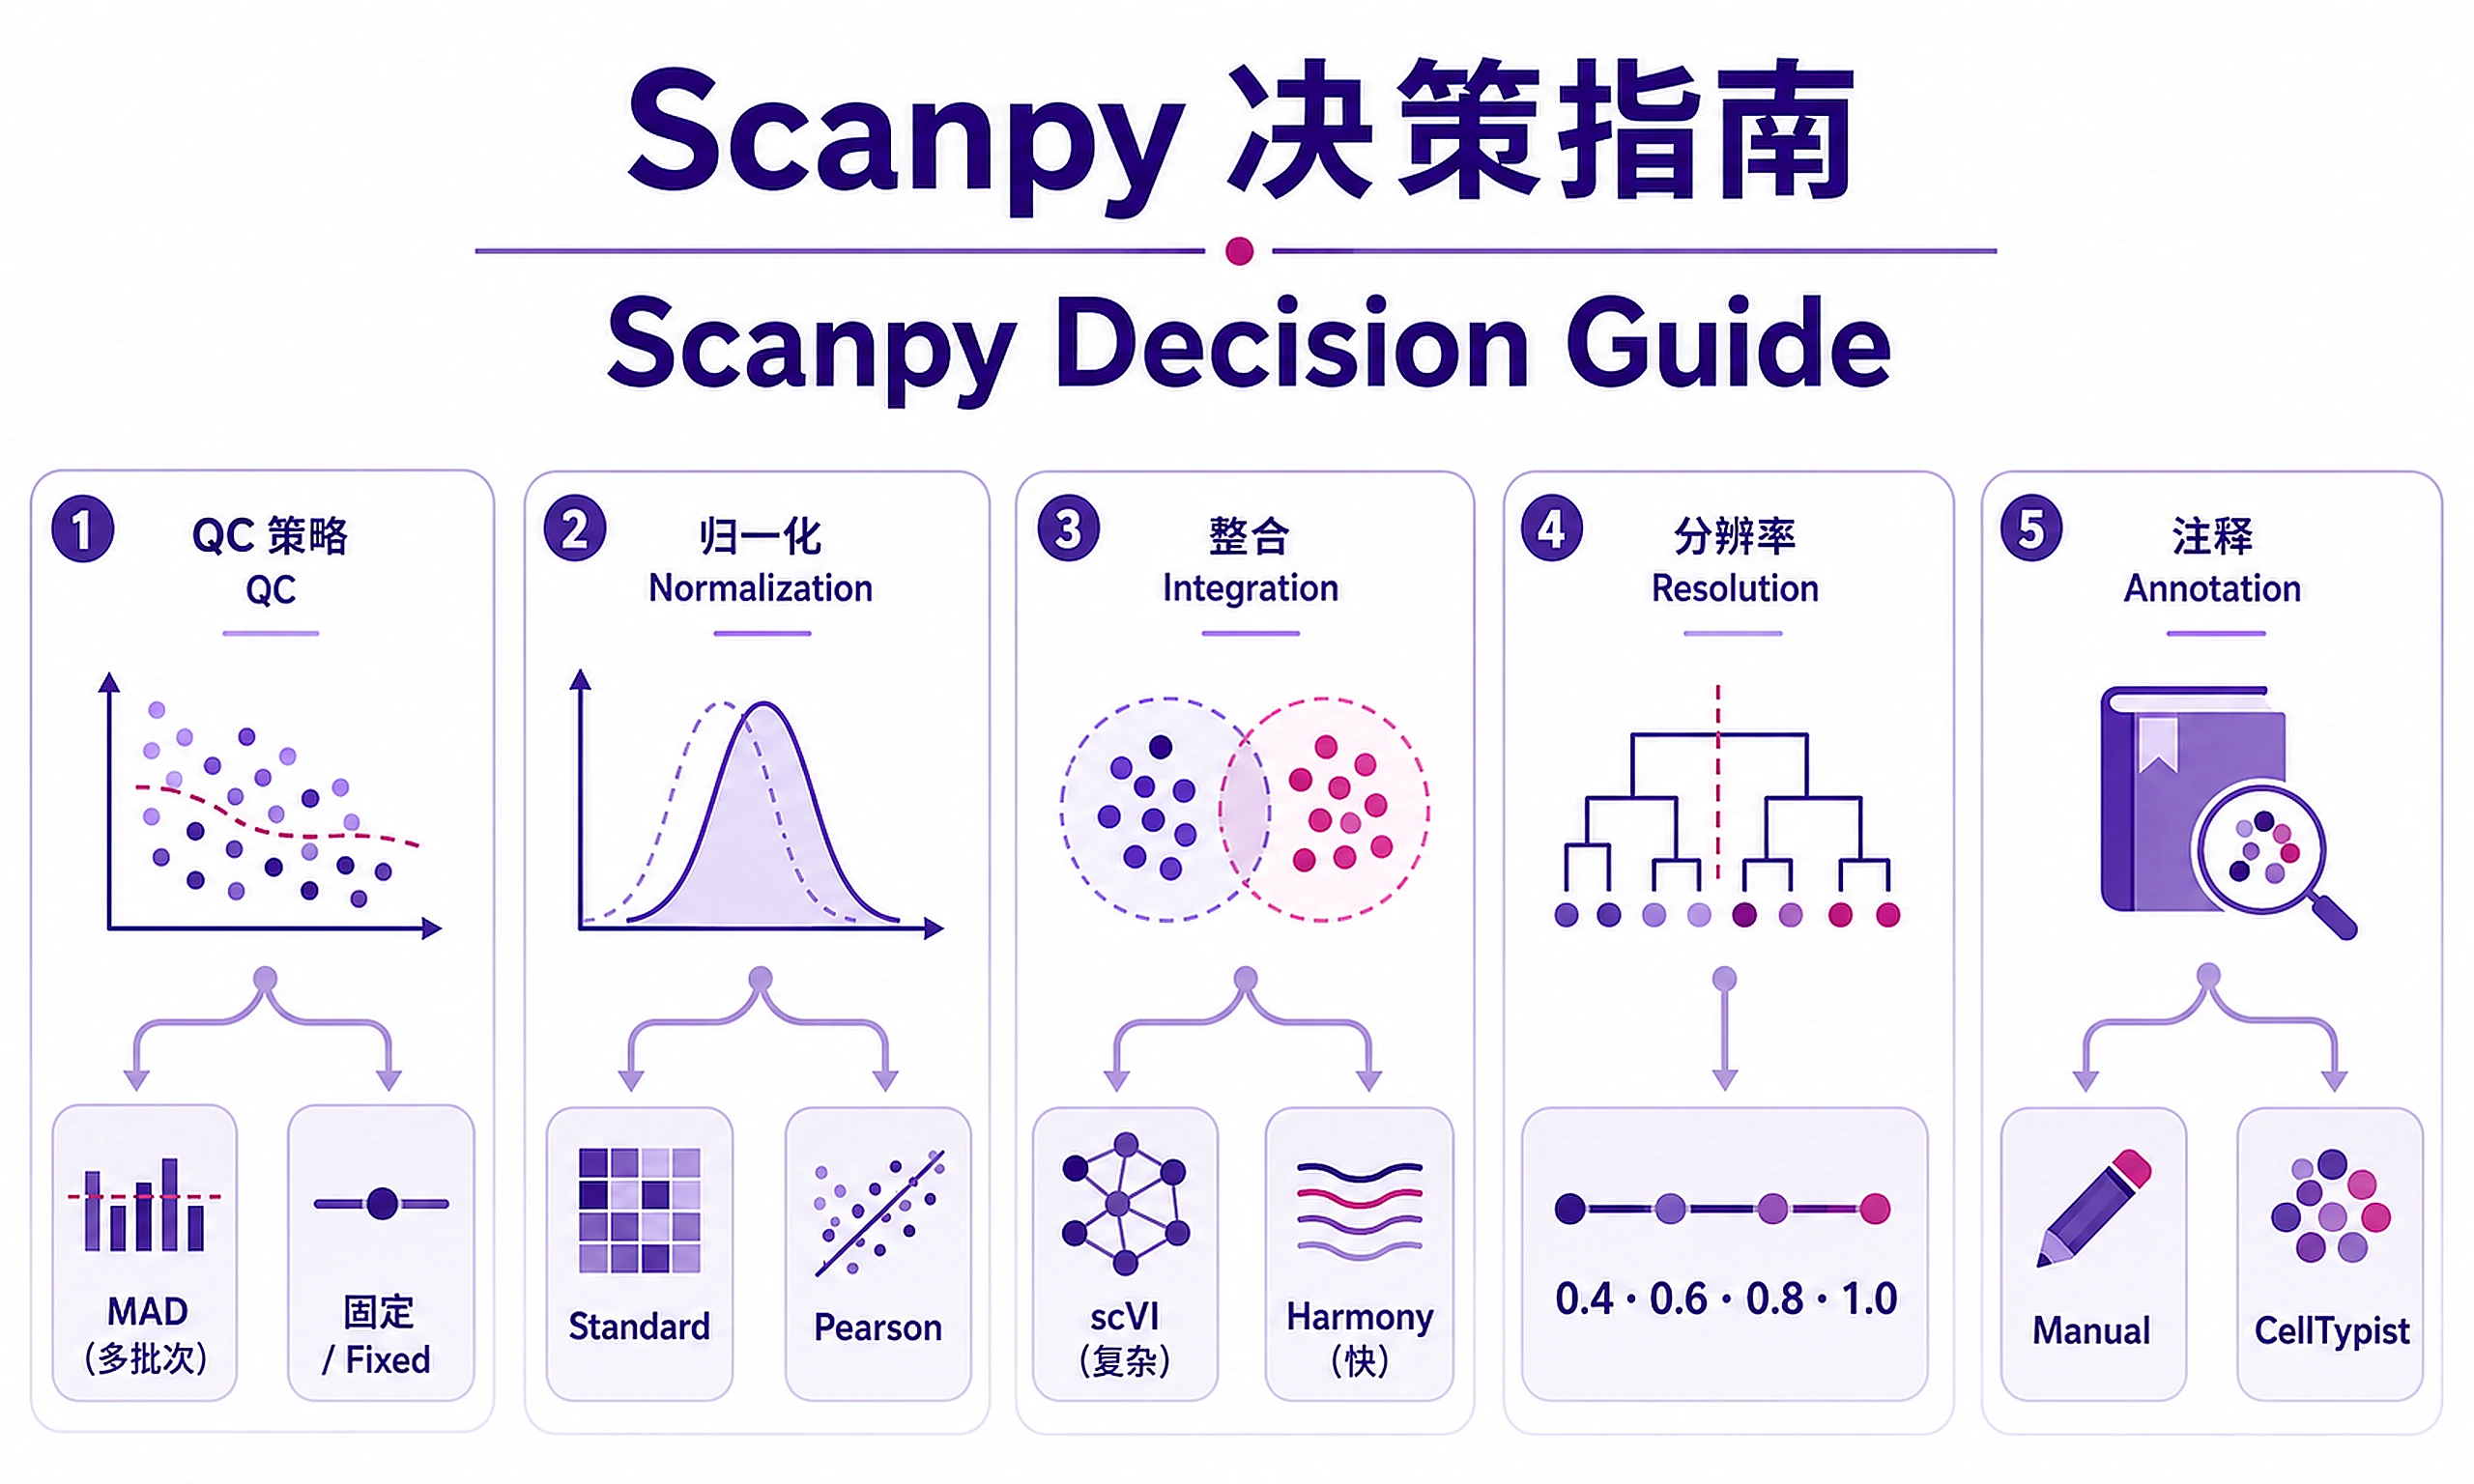
Decision Guide
| Decision | Quick Guide | Reference |
|---|---|---|
| Ambient RNA | Skip for filtered/PBMC. CellBender for raw/high-soup (brain, lung, tumor) | ambient_rna_correction.md |
| QC Strategy | MAD (multi-batch). Fixed (single batch, tissue-specific) | qc_guidelines.md |
| Normalization | Standard (most data). Pearson (heteroscedastic) | scanpy_best_practices.md |
| Integration | scVI (complex batches). Harmony (fast, simple) | integration_methods.md |
| Resolution | Test 0.4, 0.6, 0.8, 1.0. Choose by biology and stability | scanpy_best_practices.md |
| Annotation | Manual (accurate). CellTypist (fast). Both (validate) | marker_gene_database.md |
Complete working examples: references/common-patterns.md
Common Issues
| Issue | Cause | Solution |
|---|---|---|
ImportError: No module named 'scanpy' |
Not installed | pip install scanpy anndata numpy pandas matplotlib seaborn |
| Low cell retention (<70%) | Strict QC thresholds | Use MAD (nmads=5→7) or tissue-specific thresholds |
| Out of memory | Large dataset (>50k cells) | Use backed mode or subsample |
| Clusters driven by batch | Insufficient integration | Use scVI, increase n_latent, check confounding |
| Poor UMAP separation | Wrong parameters | Check PCA elbow, use 20-40 PCs, adjust n_neighbors |
| High MT% in all cells | Degradation or tissue-specific | Check distribution — bimodal: stricter filter; uniform: may be biological |
FileNotFoundError: barcodes.tsv.gz |
Wrong directory | Verify 10X output files present. Use import_h5_data() for .h5 |
| H5AD export hangs or is very slow | Large file write with compression | Normal for >50 MB files. Script uses fast lzf compression. If still slow, pass compression=None to save_h5ad(). |
NameError after export interruption |
Kernel restart lost variables | Re-run from Step 1 to restore adata. Export is idempotent — safe to re-run. |
Expected warnings (not errors):
| Warning | Meaning | Action |
|---|---|---|
| SVG export failed | Optional SVG dependency unavailable | Normal — PNG always generated. Both created in most environments. |
| Detected doublet rate differs from expected | Scrublet threshold or pre-filtering | Inspect adata.obs['doublet_score'].hist(). Adjust threshold if needed. |
| Pseudobulk DE blocked: N=1 | Insufficient replicates | Need ≥2 per condition. Use cell-level Wilcoxon for exploratory only. |
| Batch-condition confounding | Condition has 1 sample | Clustering valid. Composition comparisons need caveats. |
| CellTypist labels suspect (ILC, HSC) | Automated misclassification | Cross-check markers. Relabel ILC→NK or HSC→Unassigned. |
| Multimodal data detected | RNA-only workflow on CITE-seq | Note in reports: "RNA modality only; ADT not analyzed." |
Detailed troubleshooting: references/troubleshooting_guide.md
Suggested Next Steps
- Functional Enrichment — functional-enrichment-from-degs for pathway analysis of DE results
- Trajectory Analysis — PAGA, Palantir, or scVelo for developmental datasets
- Cell-Cell Communication — CellPhoneDB, LIANA, or NicheNet for ligand-receptor interactions
Related Skills
Alternative: scrnaseq-seurat-core-analysis (R-based) | Downstream: functional-enrichment-from-degs, de-results-to-plots, de-results-to-gene-lists | Complementary: bulk-omics-clustering, experimental-design-statistics
References
- Scanpy: Wolf FA, et al. (2018) Genome Biol. 19:15.
- Best Practices: Luecken MD, Theis FJ. (2019) Mol Syst Biol. 15:e8746.
- Pseudobulk DE: Squair JW, et al. (2021) Nat Commun. 12:5692.
- scVI: Lopez R, et al. (2018) Nat Methods. 15:1053-1058.
Detailed guides: workflow-details.md | common-patterns.md | scanpy_best_practices.md | qc_guidelines.md | integration_methods.md | pseudobulk_de_guide.md | marker_gene_database.md | troubleshooting_guide.md
Scripts: scripts/ | Evaluation: assets/eval/complete_example_analysis.py
Code preview
scripts/annotate_celltypes.py
"""
============================================================================
CELL TYPE ANNOTATION
============================================================================

This script annotates clusters with biological cell type identities.

Functions:
  - annotate_clusters_manual(): Manual annotation based on marker genes
  - annotate_with_celltypist(): Automated annotation using CellTypist
  - plot_annotated_umap(): Visualize annotations on UMAP
  - create_annotation_summary(): Summary statistics of annotations

Usage:
  from annotate_celltypes import annotate_clusters_manual, plot_annotated_umap
  annotations = {"0": "CD4 T cells", "1": "CD14+ Monocytes"}
  adata = annotate_clusters_manual(adata, annotations, cluster_key='leiden_0.8')
  plot_annotated_umap(adata, output_dir='results/annotation')
"""

from pathlib import Path
from typing import Dict, Optional, Union

import matplotlib.pyplot as plt
import pandas as pd


def _save_plot(fig: plt.Figure, base_path: Union[str, Path], dpi: int = 300) -> None:
    """
    Save plot in both PNG and SVG formats with graceful fallback.

    Parameters
    ----------
    fig : matplotlib.figure.Figure
        Figure object to save
    base_path : str or Path
        Base path for output files (without extension)
    dpi : int, optional
        Resolution for PNG (default: 300)

    Returns
    -------
    None
        Saves files to disk
    """
    base_path = Path(base_path)

    # Always save PNG
    png_path = base_path.with_suffix('.png')
    try:
        fig.savefig(png_path, dpi=dpi, bbox_inches='tight', format='png')
        print(f"  Saved: {png_path}")
    except Exception as e:
        print(f"  Warning: PNG export failed: {e}")

    # Always try SVG
    svg_path = base_path.with_suffix('.svg')
    try:
        fig.savefig(svg_path, bbox_inches='tight', format='svg')
        print(f"  Saved: {svg_path}")
    except Exception as e:
        print(f"  (SVG export failed, PNG available)")


def annotate_clusters_manual(
    adata: 'AnnData',
    annotations: Dict[str, str],
    cluster_key: str = 'leiden_0.8',
    annotation_key: str = 'cell_type',
    inplace: bool = True
) -> Optional['AnnData']:
    """
    Manually annotate clusters with cell type identities.

    Parameters
    ----------
    adata : AnnData
        AnnData object
    annotations : dict
        Dictionary mapping cluster IDs to cell type names
scripts/cluster_cells.py
"""
============================================================================
CELL CLUSTERING
============================================================================

This script performs graph-based clustering using the Leiden algorithm.

Functions:
  - build_neighbor_graph(): Compute k-nearest neighbors graph
  - cluster_leiden(): Leiden clustering at single resolution
  - cluster_leiden_multiple_resolutions(): Test multiple resolutions
  - plot_clustering_tree(): Visualize clustering hierarchy

Usage:
  from cluster_cells import build_neighbor_graph, cluster_leiden_multiple_resolutions
  adata = build_neighbor_graph(adata, n_neighbors=10, n_pcs=30)
  adata = cluster_leiden_multiple_resolutions(adata, resolutions=[0.4, 0.6, 0.8, 1.0])
"""

from typing import List, Optional

import numpy as np


def build_neighbor_graph(
    adata: 'AnnData',
    n_neighbors: int = 10,
    n_pcs: int = 30,
    metric: str = 'euclidean',
    random_state: int = 0,
    use_rep: Optional[str] = None,
    inplace: bool = True
) -> Optional['AnnData']:
    """
    Compute k-nearest neighbors graph.

    Parameters
    ----------
    adata : AnnData
        AnnData object with PCA
    n_neighbors : int, optional
        Number of neighbors (default: 10)
    n_pcs : int, optional
        Number of PCs to use (default: 30). Standard range: 20-30.
    metric : str, optional
        Distance metric (default: 'euclidean')
    random_state : int, optional
        Random seed (default: 0)
    use_rep : str, optional
        Representation to use (e.g., 'X_pca', 'X_scVI'). Default: None (uses X_pca)
    inplace : bool, optional
        Modify AnnData in place (default: True)

    Returns
    -------
    AnnData or None
        AnnData object with neighbor graph if inplace=False, else None
    """
    import scanpy as sc

    if not inplace:
        adata = adata.copy()

    # Determine representation
    if use_rep is not None and use_rep in adata.obsm:
        print(f"Building neighbor graph with k={n_neighbors} using {use_rep}...")
    elif 'X_pca' not in adata.obsm:
        raise ValueError("PCA not found. Run run_pca_analysis first.")
    else:
        print(f"Building neighbor graph with k={n_neighbors}...")

    # Warn if too few PCs
    if n_pcs is not None and n_pcs < 15:
        print(f"  WARNING: n_pcs={n_pcs} is very low. Standard is 20-30 PCs.")
        print(f"     Using <15 PCs risks collapsing distinct cell populations.")

    print(f"  Using {n_pcs} PCs")

    neighbors_kwargs = dict(
        n_neighbors=n_neighbors,
scripts/export_results.py
"""
============================================================================
RESULTS EXPORT
============================================================================

This script exports processed data, tables, and figures.

Functions:
  - export_anndata_results(): Export all results from analysis
  - save_h5ad(): Save AnnData object
  - export_expression_matrix(): Export expression matrices
  - export_metadata(): Export cell metadata
  - export_embeddings(): Export dimensionality reduction coordinates

Usage:
  from export_results import export_anndata_results
  export_anndata_results(adata, output_dir='results', cluster_key='cell_type')
"""

import tempfile
import time
from pathlib import Path
from typing import List, Optional, Union

import pandas as pd


def _check_multimodal_data(adata: 'AnnData') -> None:
    """
    Check if AnnData contains multimodal data (ADT/protein, ATAC, etc.)
    that was not analyzed in the RNA-only workflow.

    Prints informational messages so users and reports are clear about
    which modalities were analyzed.
    """
    multimodal_hints = []

    # Check .obsm for protein/ADT embeddings
    if hasattr(adata, 'obsm') and adata.obsm is not None:
        for key in adata.obsm.keys():
            key_lower = key.lower()
            if any(term in key_lower for term in ['adt', 'protein', 'cite', 'antibody']):
                multimodal_hints.append(f"ADT/protein data detected in .obsm['{key}']")
            if any(term in key_lower for term in ['atac', 'peaks', 'chromatin']):
                multimodal_hints.append(f"ATAC/chromatin data detected in .obsm['{key}']")

    # Check .uns for modality info
    if hasattr(adata, 'uns') and adata.uns is not None:
        for key in adata.uns.keys():
            key_lower = key.lower()
            if any(term in key_lower for term in ['adt', 'protein', 'cite']):
                multimodal_hints.append(f"ADT/protein metadata in .uns['{key}']")

    # Check var for feature types (common in 10X multiome/CITE-seq)
    if 'feature_types' in adata.var.columns:
        feature_types = adata.var['feature_types'].unique()
        non_rna = [ft for ft in feature_types
                   if ft not in ['Gene Expression', 'gene_expression', 'Gene']]
        if non_rna:
            multimodal_hints.append(
                f"Non-RNA feature types in .var['feature_types']: {non_rna}"
            )

    if multimodal_hints:
        print(f"\n  [INFO] MULTIMODAL DATA DETECTED:")
        print(f"     This analysis used RNA expression data only.")
        print(f"     Additional modalities found but not analyzed:")
        for hint in multimodal_hints:
            print(f"       - {hint}")
        print(f"     If this is CITE-seq data, ADT/protein features were not included")
        print(f"     in normalization, integration, or clustering.")
        print(f"     Add a note to reports: 'RNA modality only; ADT features not analyzed.'")


def _estimate_h5ad_size_mb(adata: 'AnnData') -> float:
    """Estimate H5AD file size in MB from AnnData dimensions."""
    import scipy.sparse as sp

    total_bytes = 0