Regulatory Network (pySCENIC)
Discover TF regulons and per-cell activity de novo.
Overview
Problem. Which TFs drive which targets, and per-cell activity.
Learning goals
- Co-express → motif-validate → score
- Co-expression alone is noisy; motifs validate
Figures
Tutorial
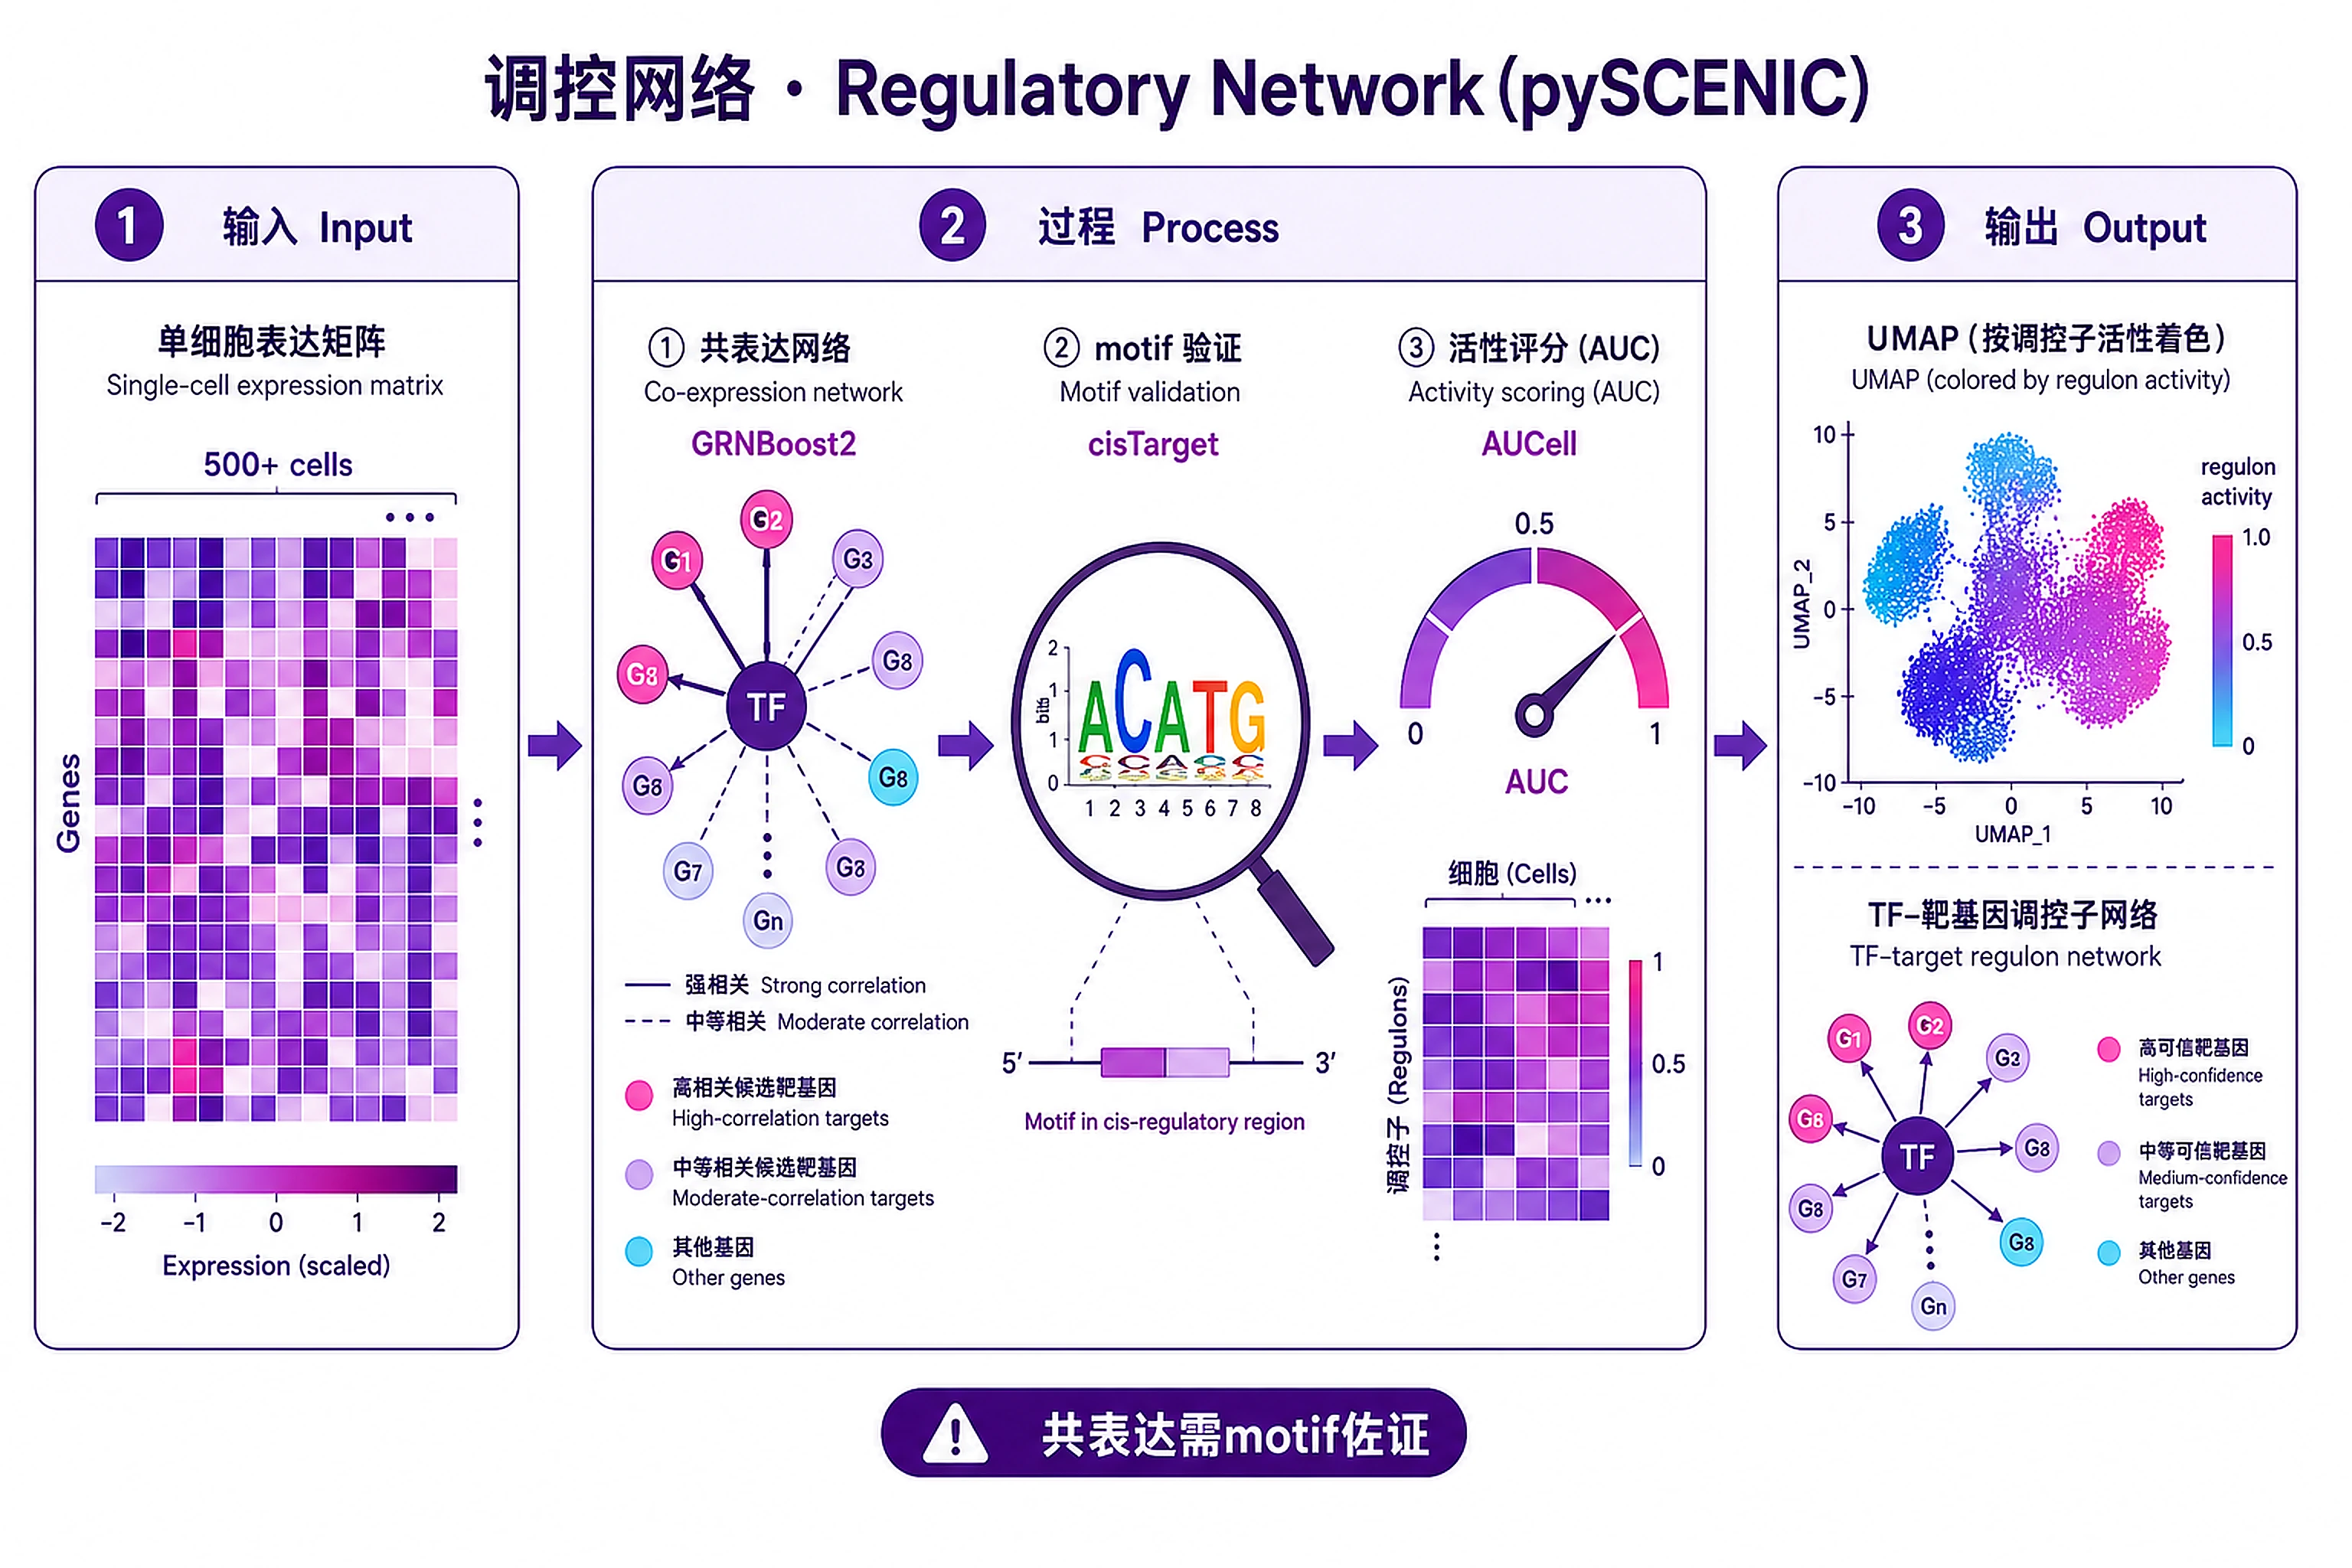
Infer gene regulatory networks (GRNs) de novo from single-cell RNA-seq data using pySCENIC. This workflow discovers transcription factor (TF) regulons directly from expression patterns and calculates cell-level TF activity scores.
When to Use This Skill
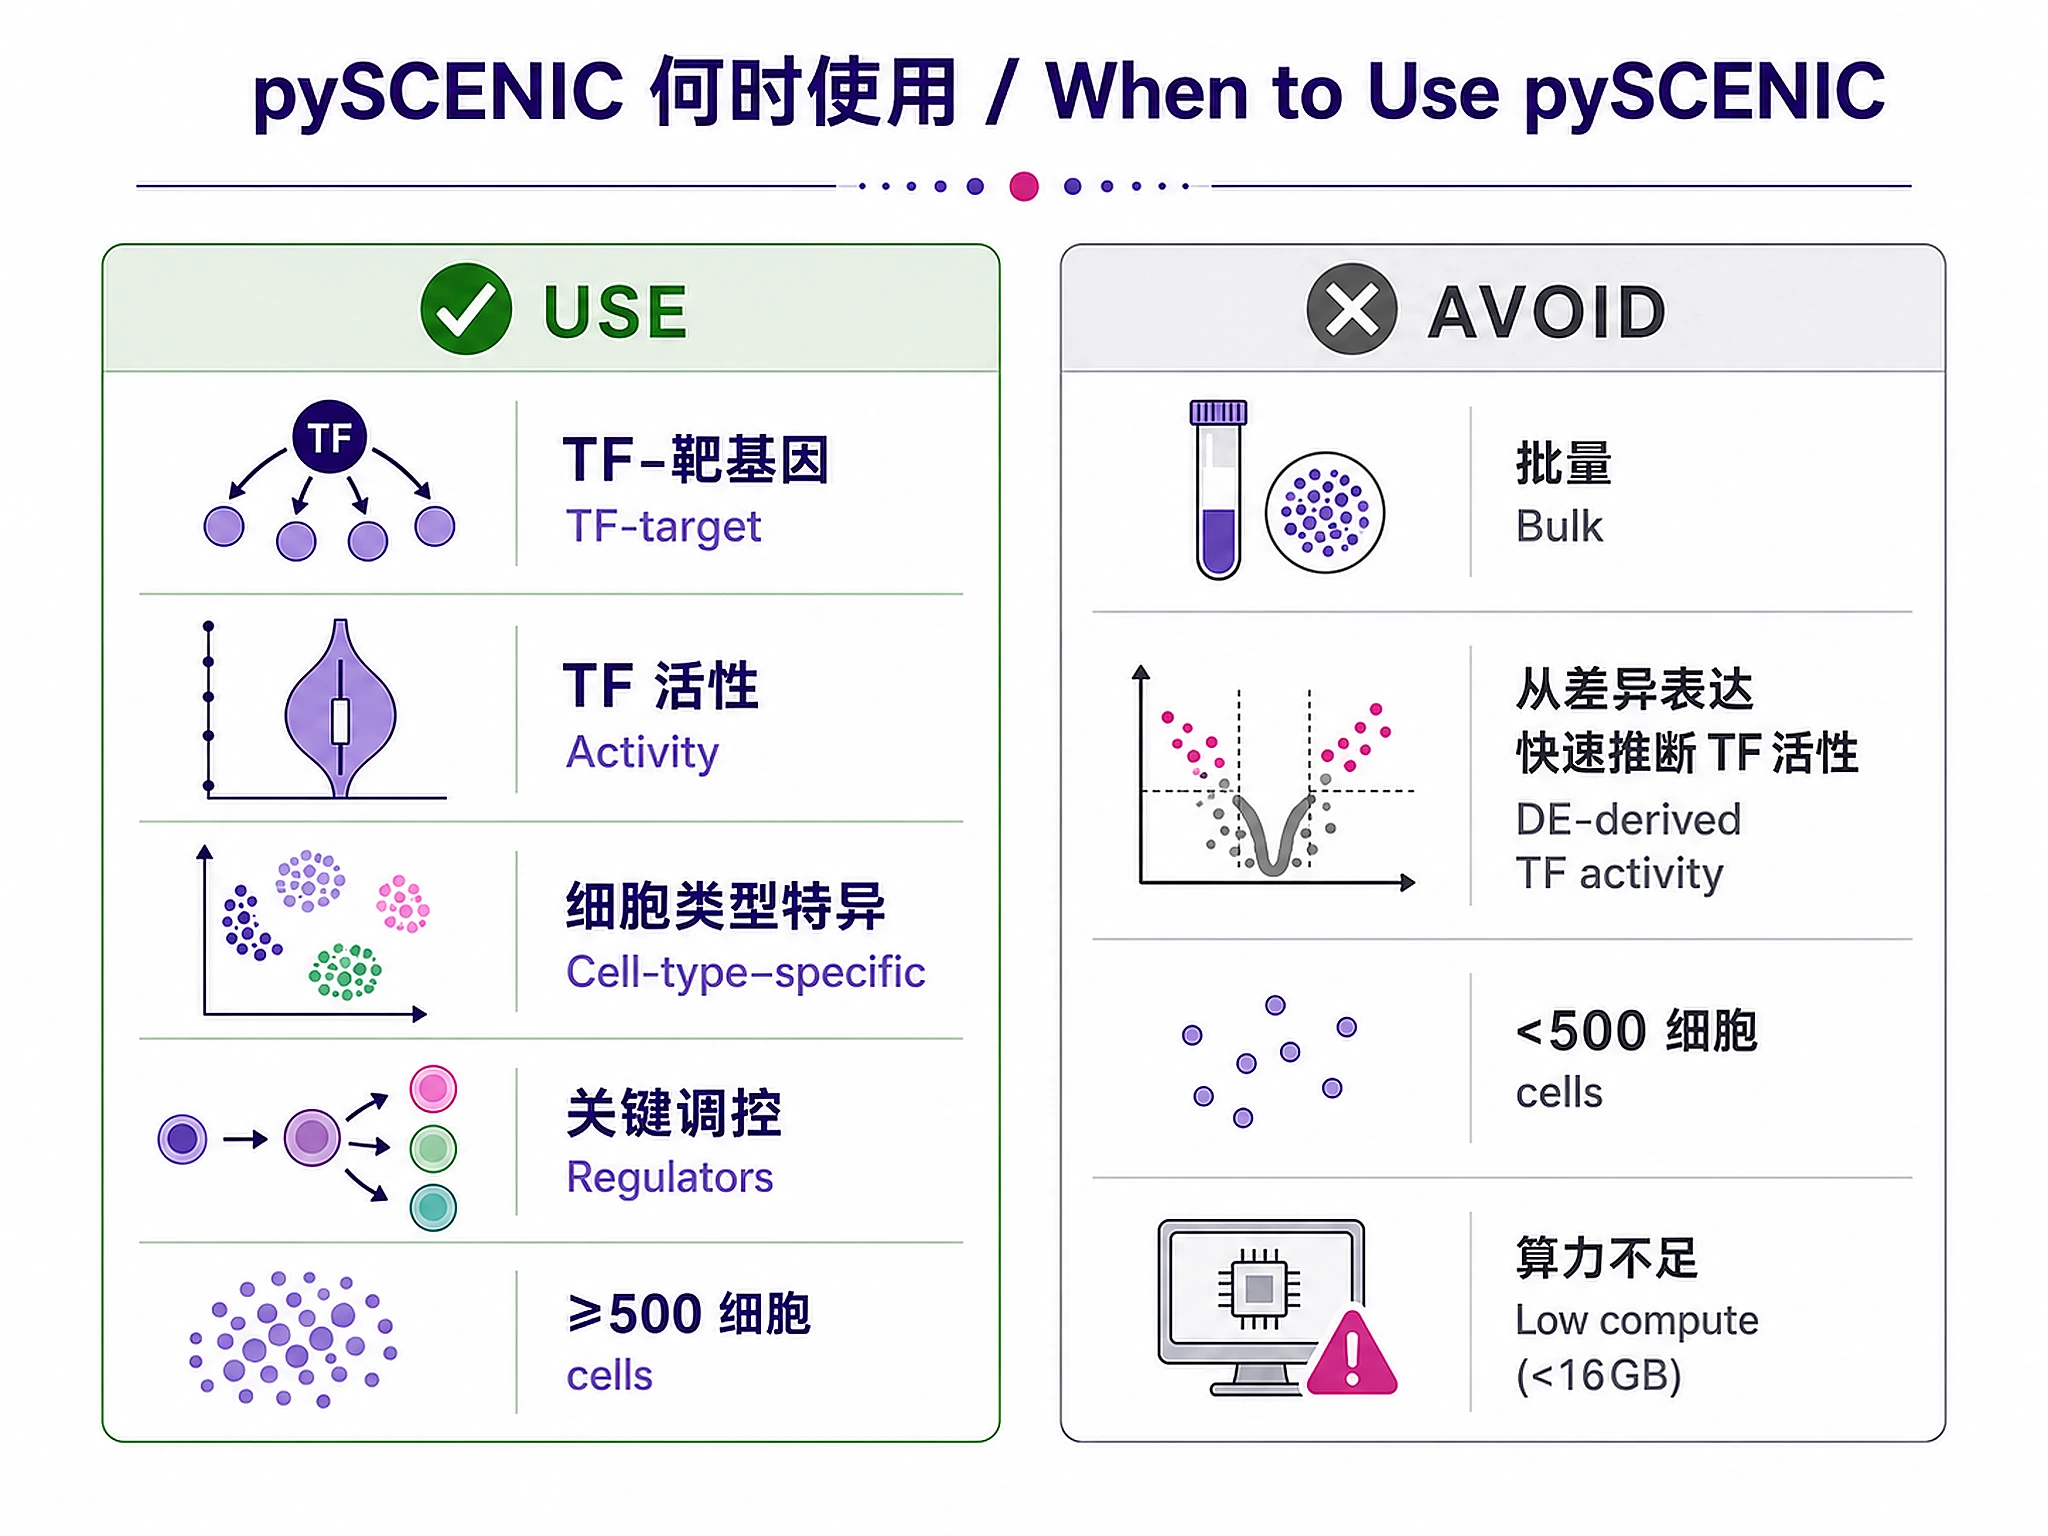
Use pySCENIC GRN inference when you need to:
- ✅ Discover TF-target relationships de novo from single-cell RNA-seq data
- ✅ Calculate cell-level TF activity scores for regulatory programs
- ✅ Identify cell-type-specific transcriptional programs
- ✅ Find key regulators driving cell state transitions or differentiation
- ✅ Compare regulatory programs across conditions, tissues, or species
Don't use this skill for:
- ❌ Bulk RNA-seq with few samples → Use functional-enrichment-from-degs or tf-activity workflows
- ❌ Quick TF activity from DE results → Use curated network approaches (faster, less computational)
- ❌ <500 cells → Insufficient for robust GRN inference
- ❌ Limited computational resources → Requires 16GB+ RAM, several hours runtime
Key Concept: Unlike curated network approaches, pySCENIC infers TF-target relationships directly from your data using co-expression analysis, then validates them using motif enrichment in cis-regulatory regions.
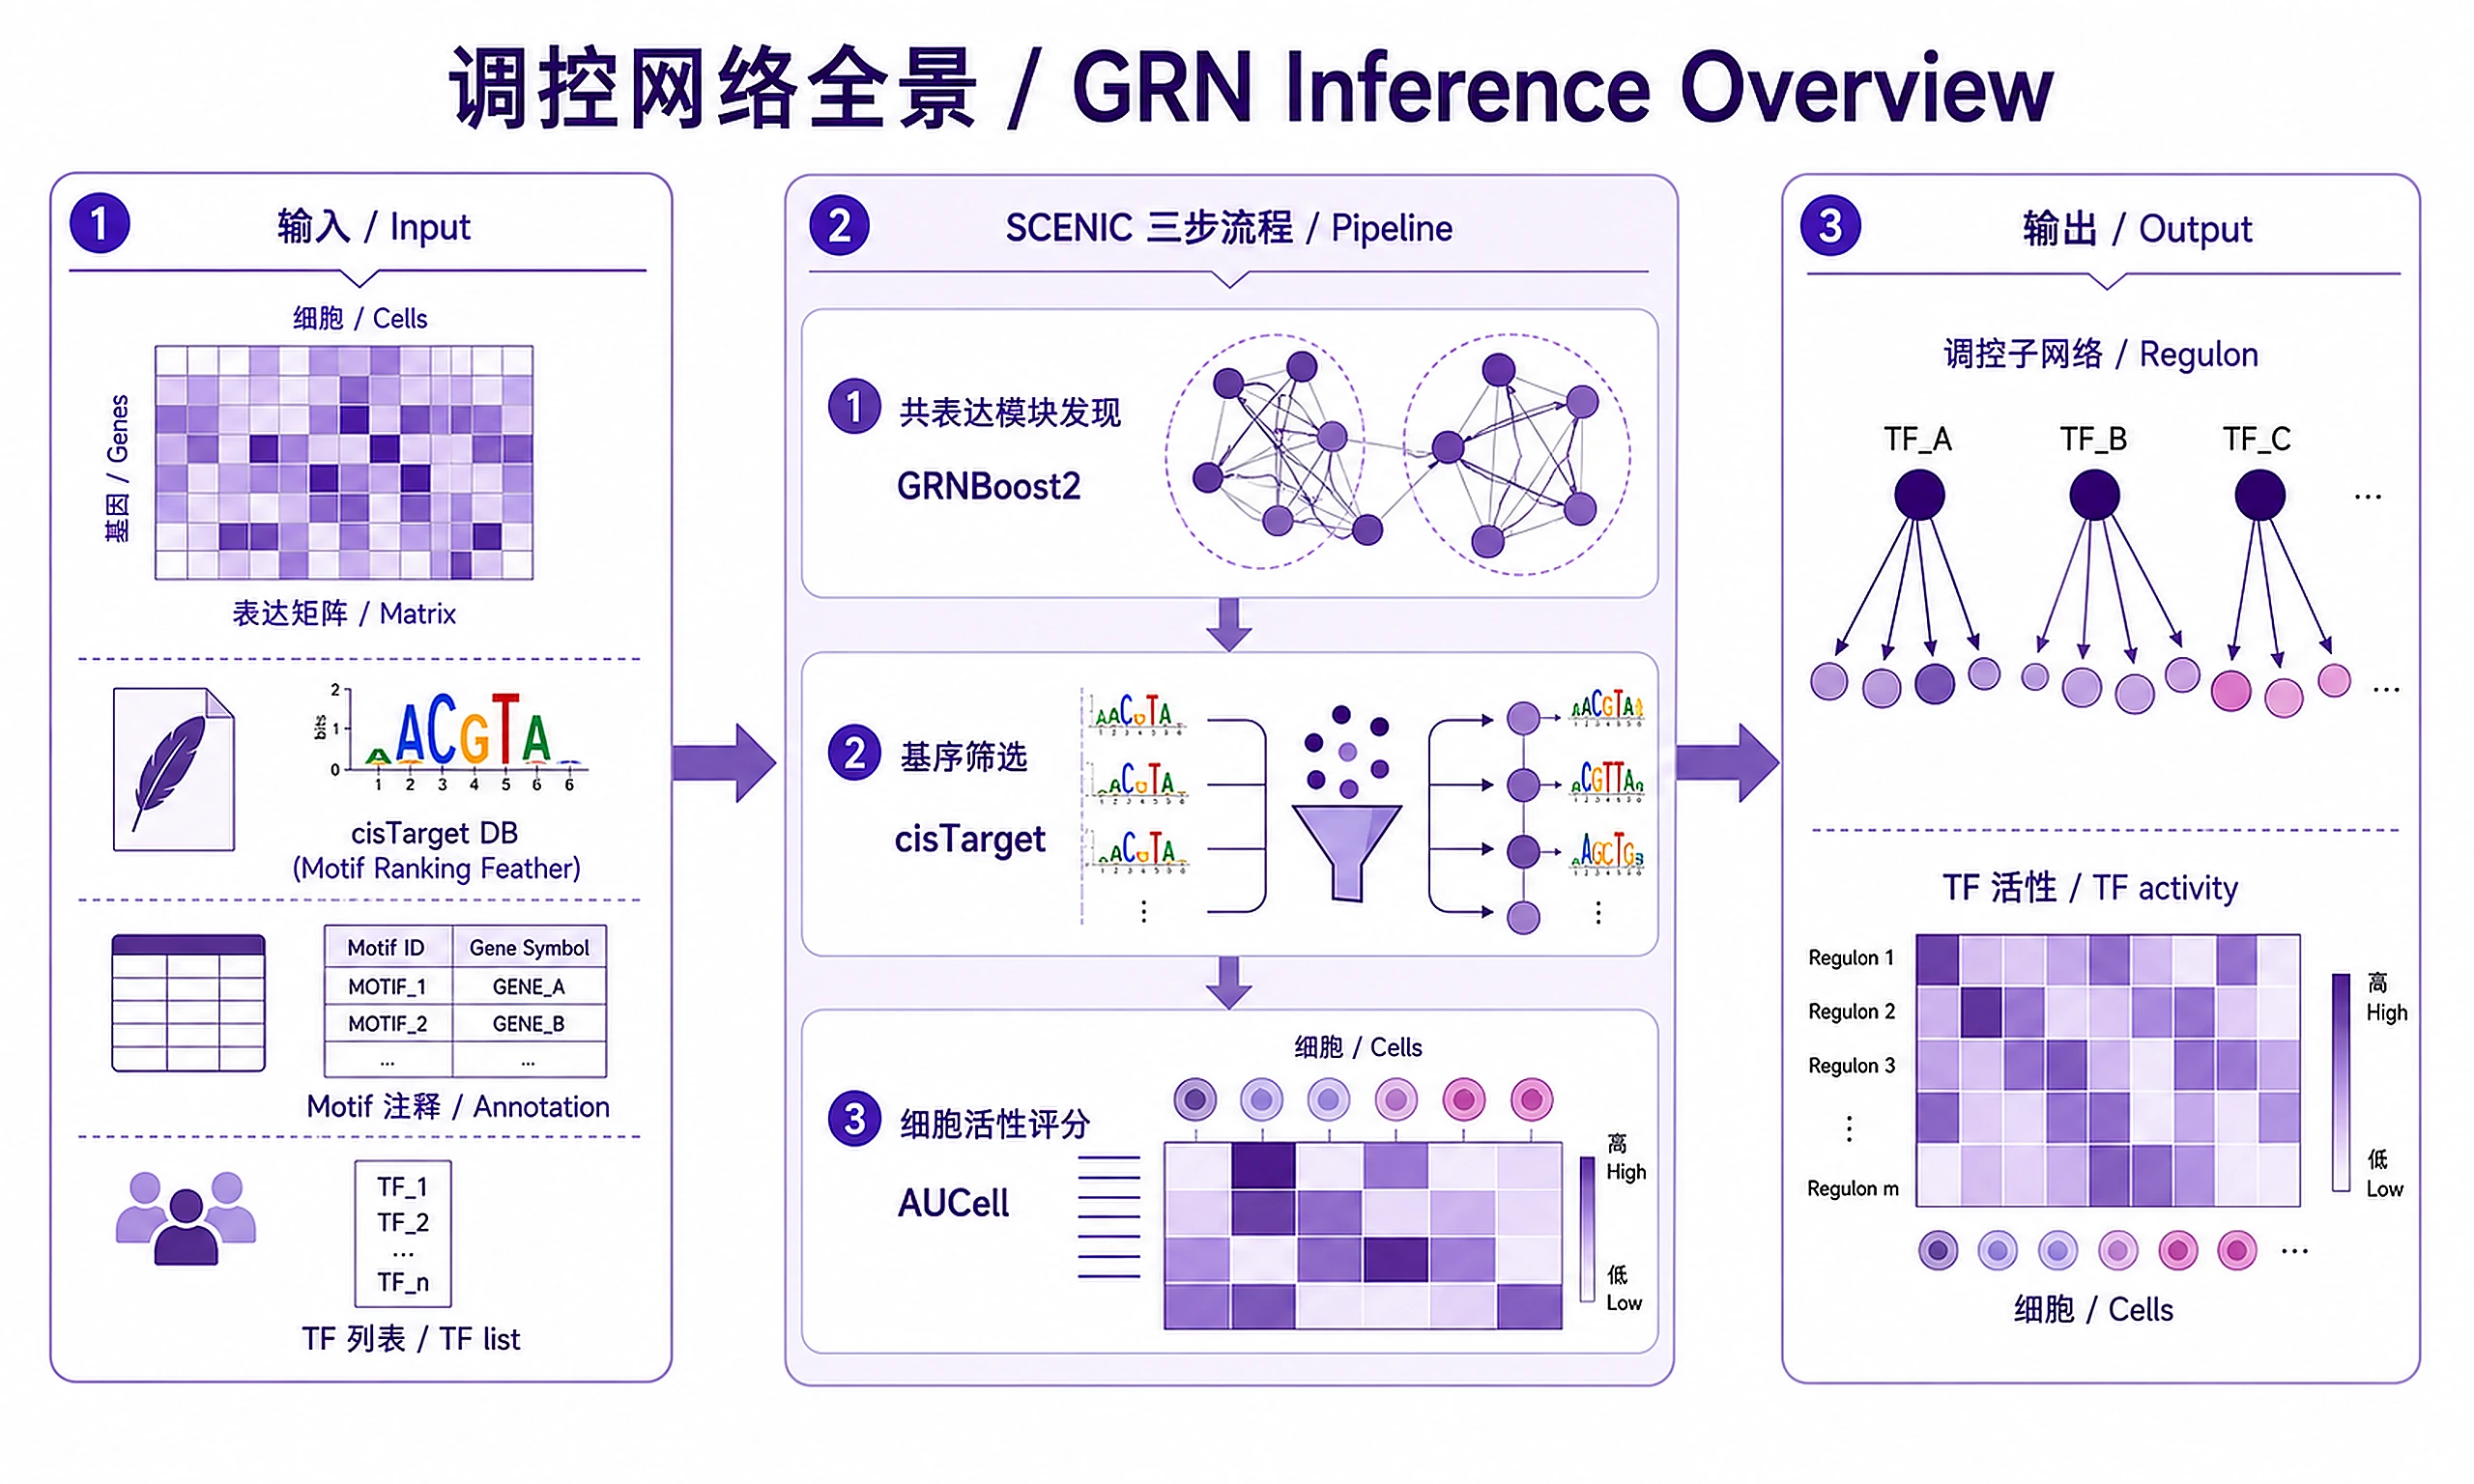
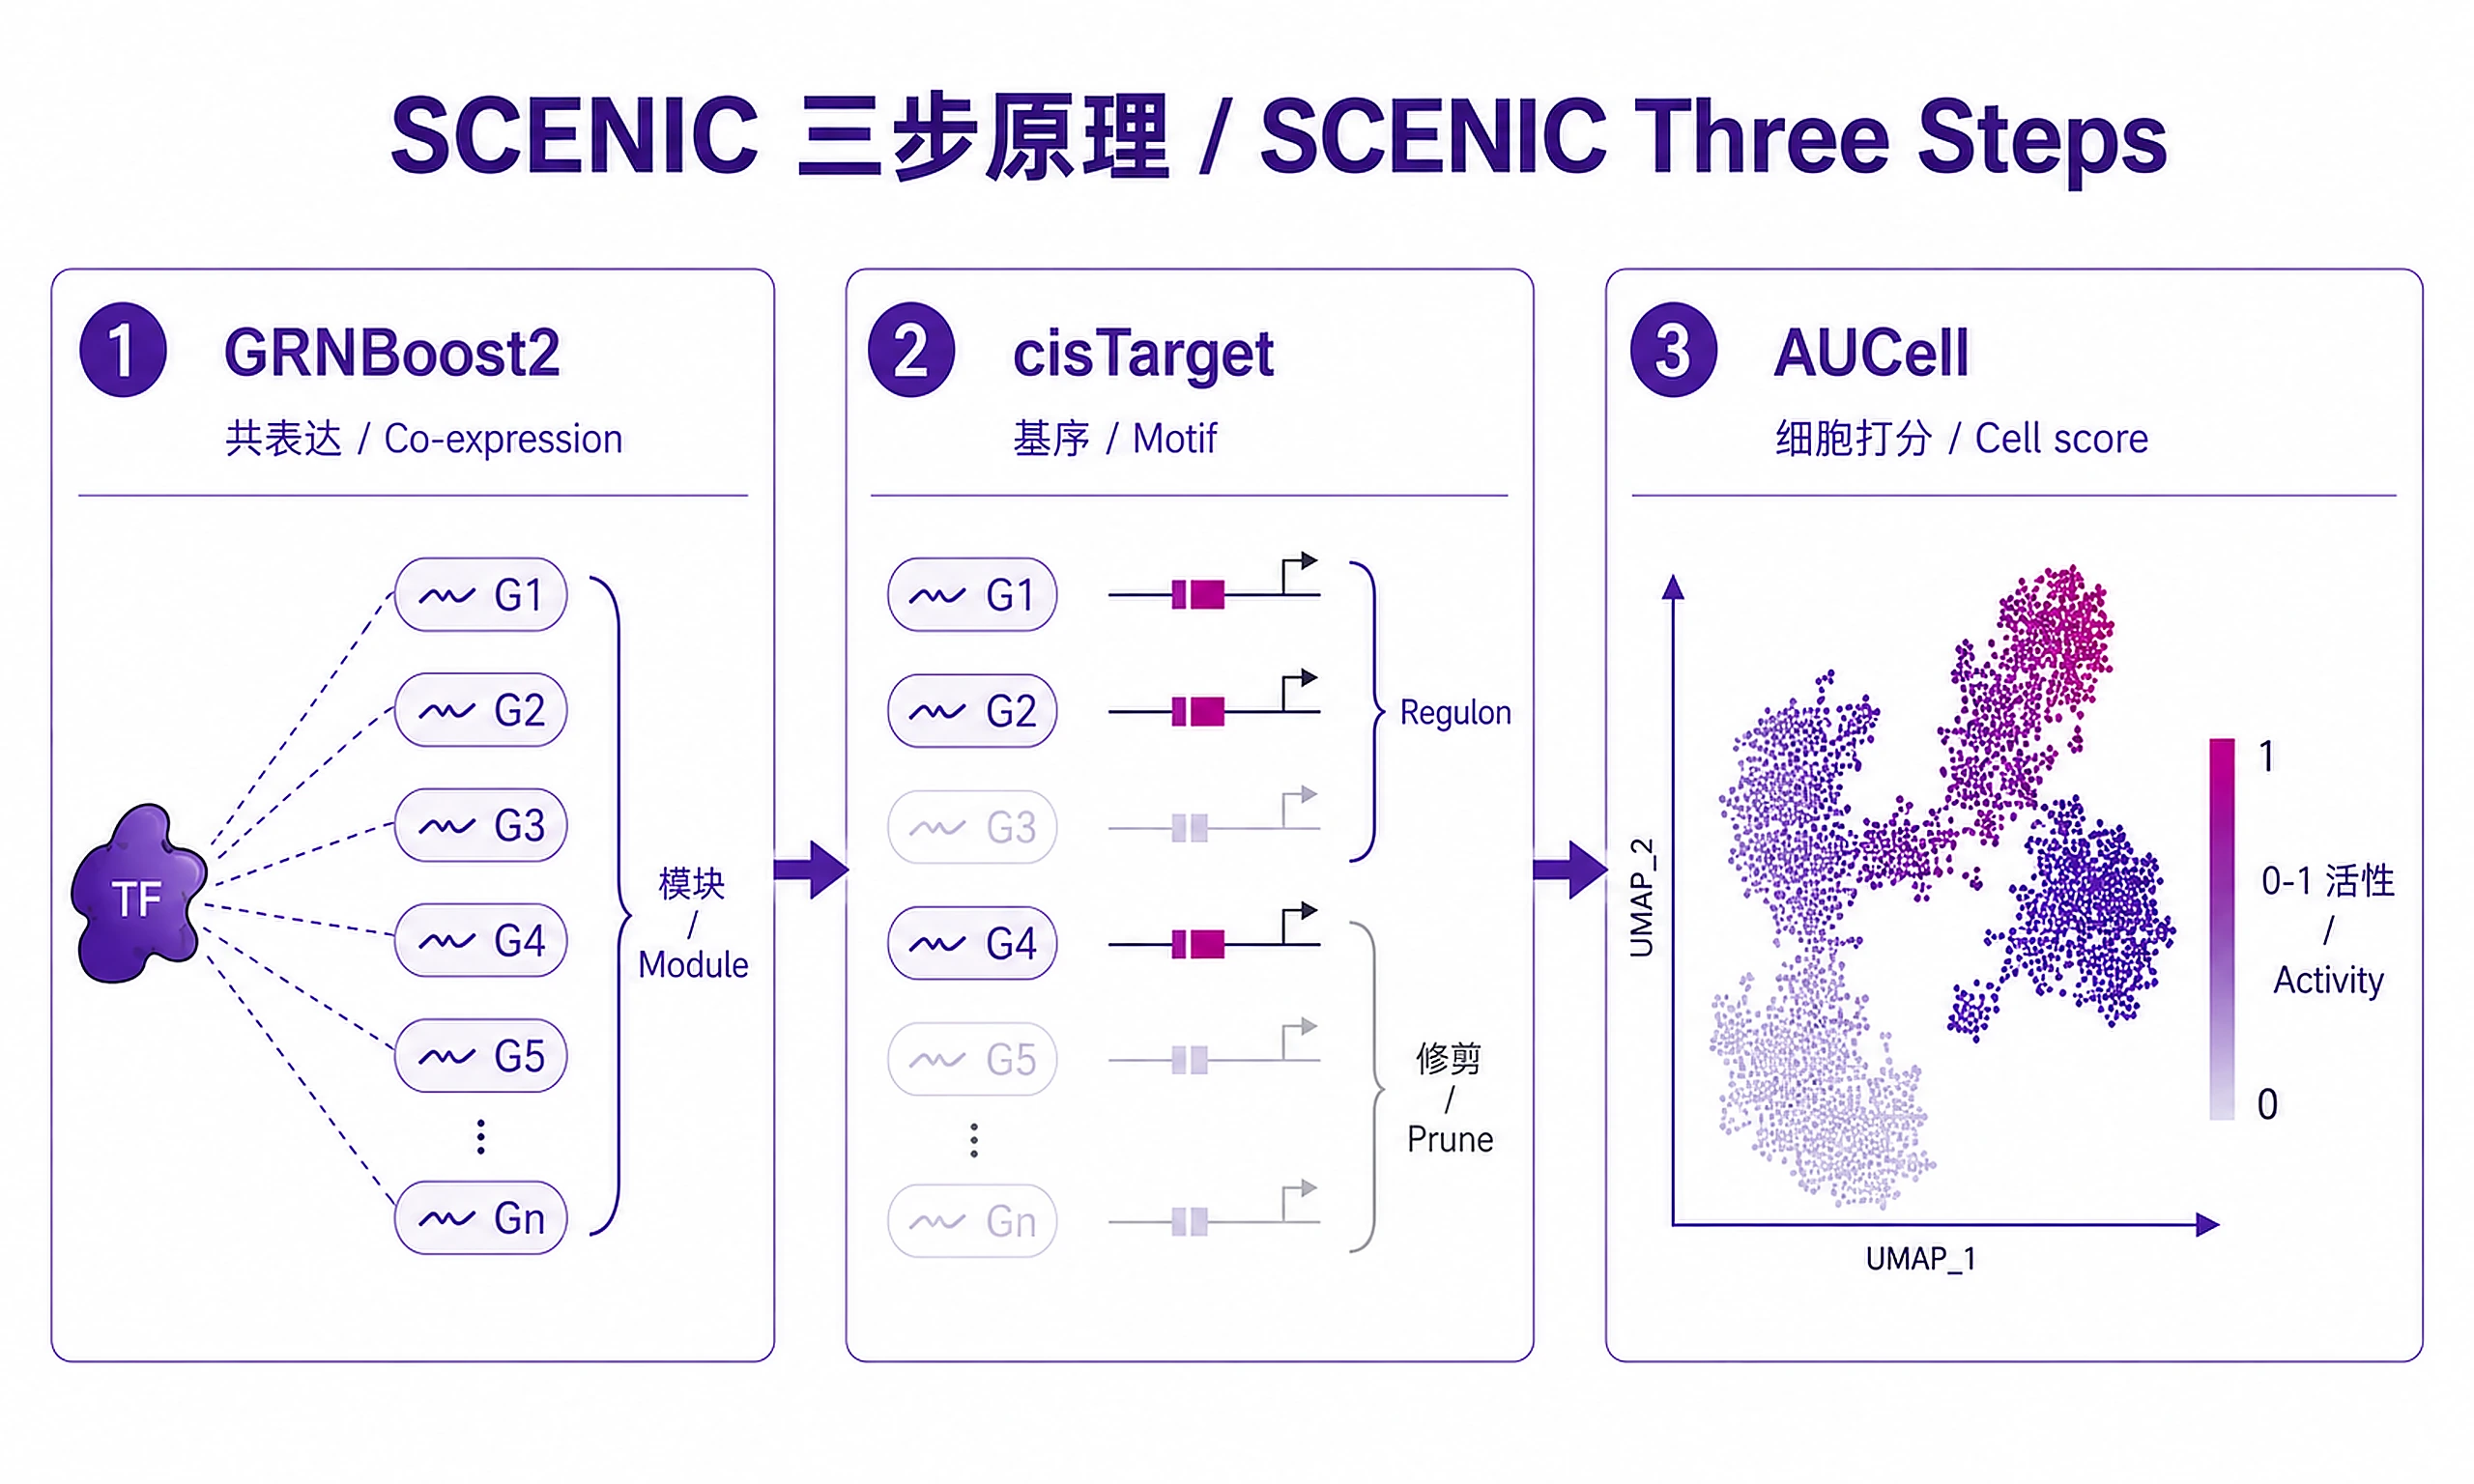
The SCENIC Pipeline:
- GRN Inference (GRNBoost2): Identify co-expression modules linking TFs to potential target genes
- Regulon Prediction (cisTarget): Prune targets to those with TF binding motifs in promoters
- Cell Activity Scoring (AUCell): Score each cell for regulon activity
Quick Start
Fastest way to test the workflow (~10-15 minutes):
# Step 1: Load example PBMC data (500 cells)
from scripts.load_example_data import load_pbmc3k_example
adata, ex_matrix = load_pbmc3k_example(preprocess=True, subsample=500)

# Step 2: Run complete GRN workflow
from scripts.run_grn_workflow import run_complete_grn_workflow
results = run_complete_grn_workflow(
    ex_matrix=ex_matrix,
    tf_list_file="pyscenic_databases/allTFs_hg38.txt",
    database_glob="pyscenic_databases/*.feather",
    motif_annotations_file="pyscenic_databases/motifs-v10nr_clust-nr.hgnc-m0.001-o0.0.tbl",
    output_dir="scenic_test_results",
    n_workers=4
)

# Step 3: Visualize and export
from scripts.integrate_with_adata import integrate_with_adata
from scripts.plot_regulon_visualizations import generate_all_visualizations
from scripts.export_all import export_all

adata = integrate_with_adata(adata, results['auc_matrix'], results['regulons'])
generate_all_visualizations(results['auc_matrix'], results['regulons'], adata,
                            output_dir="scenic_test_results/plots")
export_all(results['regulons'], results['auc_matrix'], results['auc_summary'],
           results['adjacencies'], output_dir="scenic_test_results")
Expected output: 20-40 regulons, 13 output files (CSVs, plots, integrated H5AD)
Note: Requires databases to be downloaded first (see Installation → Reference Databases section).
Installation
Required Software
| Software | Version | License | Commercial Use | Installation |
|---|---|---|---|---|
| pySCENIC | ≥0.12.0 | GPL-3.0 | ✅ Permitted | pip install pyscenic |
| arboreto | ≥0.1.6 | BSD-3-Clause | ✅ Permitted | Installed with pySCENIC |
| ctxcore | ≥0.2.0 | GPL-3.0 | ✅ Permitted | Installed with pySCENIC |
| scanpy | ≥1.9 | BSD-3-Clause | ✅ Permitted | pip install scanpy |
| pandas | ≥1.3 | BSD-3-Clause | ✅ Permitted | pip install pandas |
| numpy | ≥1.20 | BSD-3-Clause | ✅ Permitted | pip install numpy |
| loompy | ≥3.0 | BSD-3-Clause | ✅ Permitted | pip install loompy |
| networkx | ≥2.6 | BSD-3-Clause | ✅ Permitted | pip install networkx |
| seaborn | ≥0.11 | BSD-3-Clause | ✅ Permitted | pip install seaborn |
| matplotlib | ≥3.4 | PSF-based | ✅ Permitted | pip install matplotlib |
| reportlab | ≥3.6 | BSD | ✅ Permitted | pip install reportlab |
Minimum Python version: Python ≥3.8
Quick install:
pip install pyscenic scanpy pandas numpy loompy networkx seaborn matplotlib reportlab
Note: pySCENIC automatically installs arboreto (for GRNBoost2) and ctxcore (for cisTarget) as dependencies.
Reference Databases (Required)
Download species-specific databases from SCENIC resources:
For human (hg38):
wget https://resources.aertslab.org/cistarget/databases/homo_sapiens/hg38/refseq_r80/mc_v10_clust/gene_based/hg38_10kbp_up_10kbp_down_full_tx_v10_clust.genes_vs_motifs.rankings.feather
wget https://resources.aertslab.org/cistarget/motif2tf/motifs-v10nr_clust-nr.hgnc-m0.001-o0.0.tbl
wget https://resources.aertslab.org/cistarget/tf_lists/allTFs_hg38.txt
For other species: See references/database_downloads.md
Database requirements:
- Motif ranking database (.feather format, ~1-2GB)
- Motif annotation file (.tbl format)
- TF list for your species
Inputs
Required Input
-
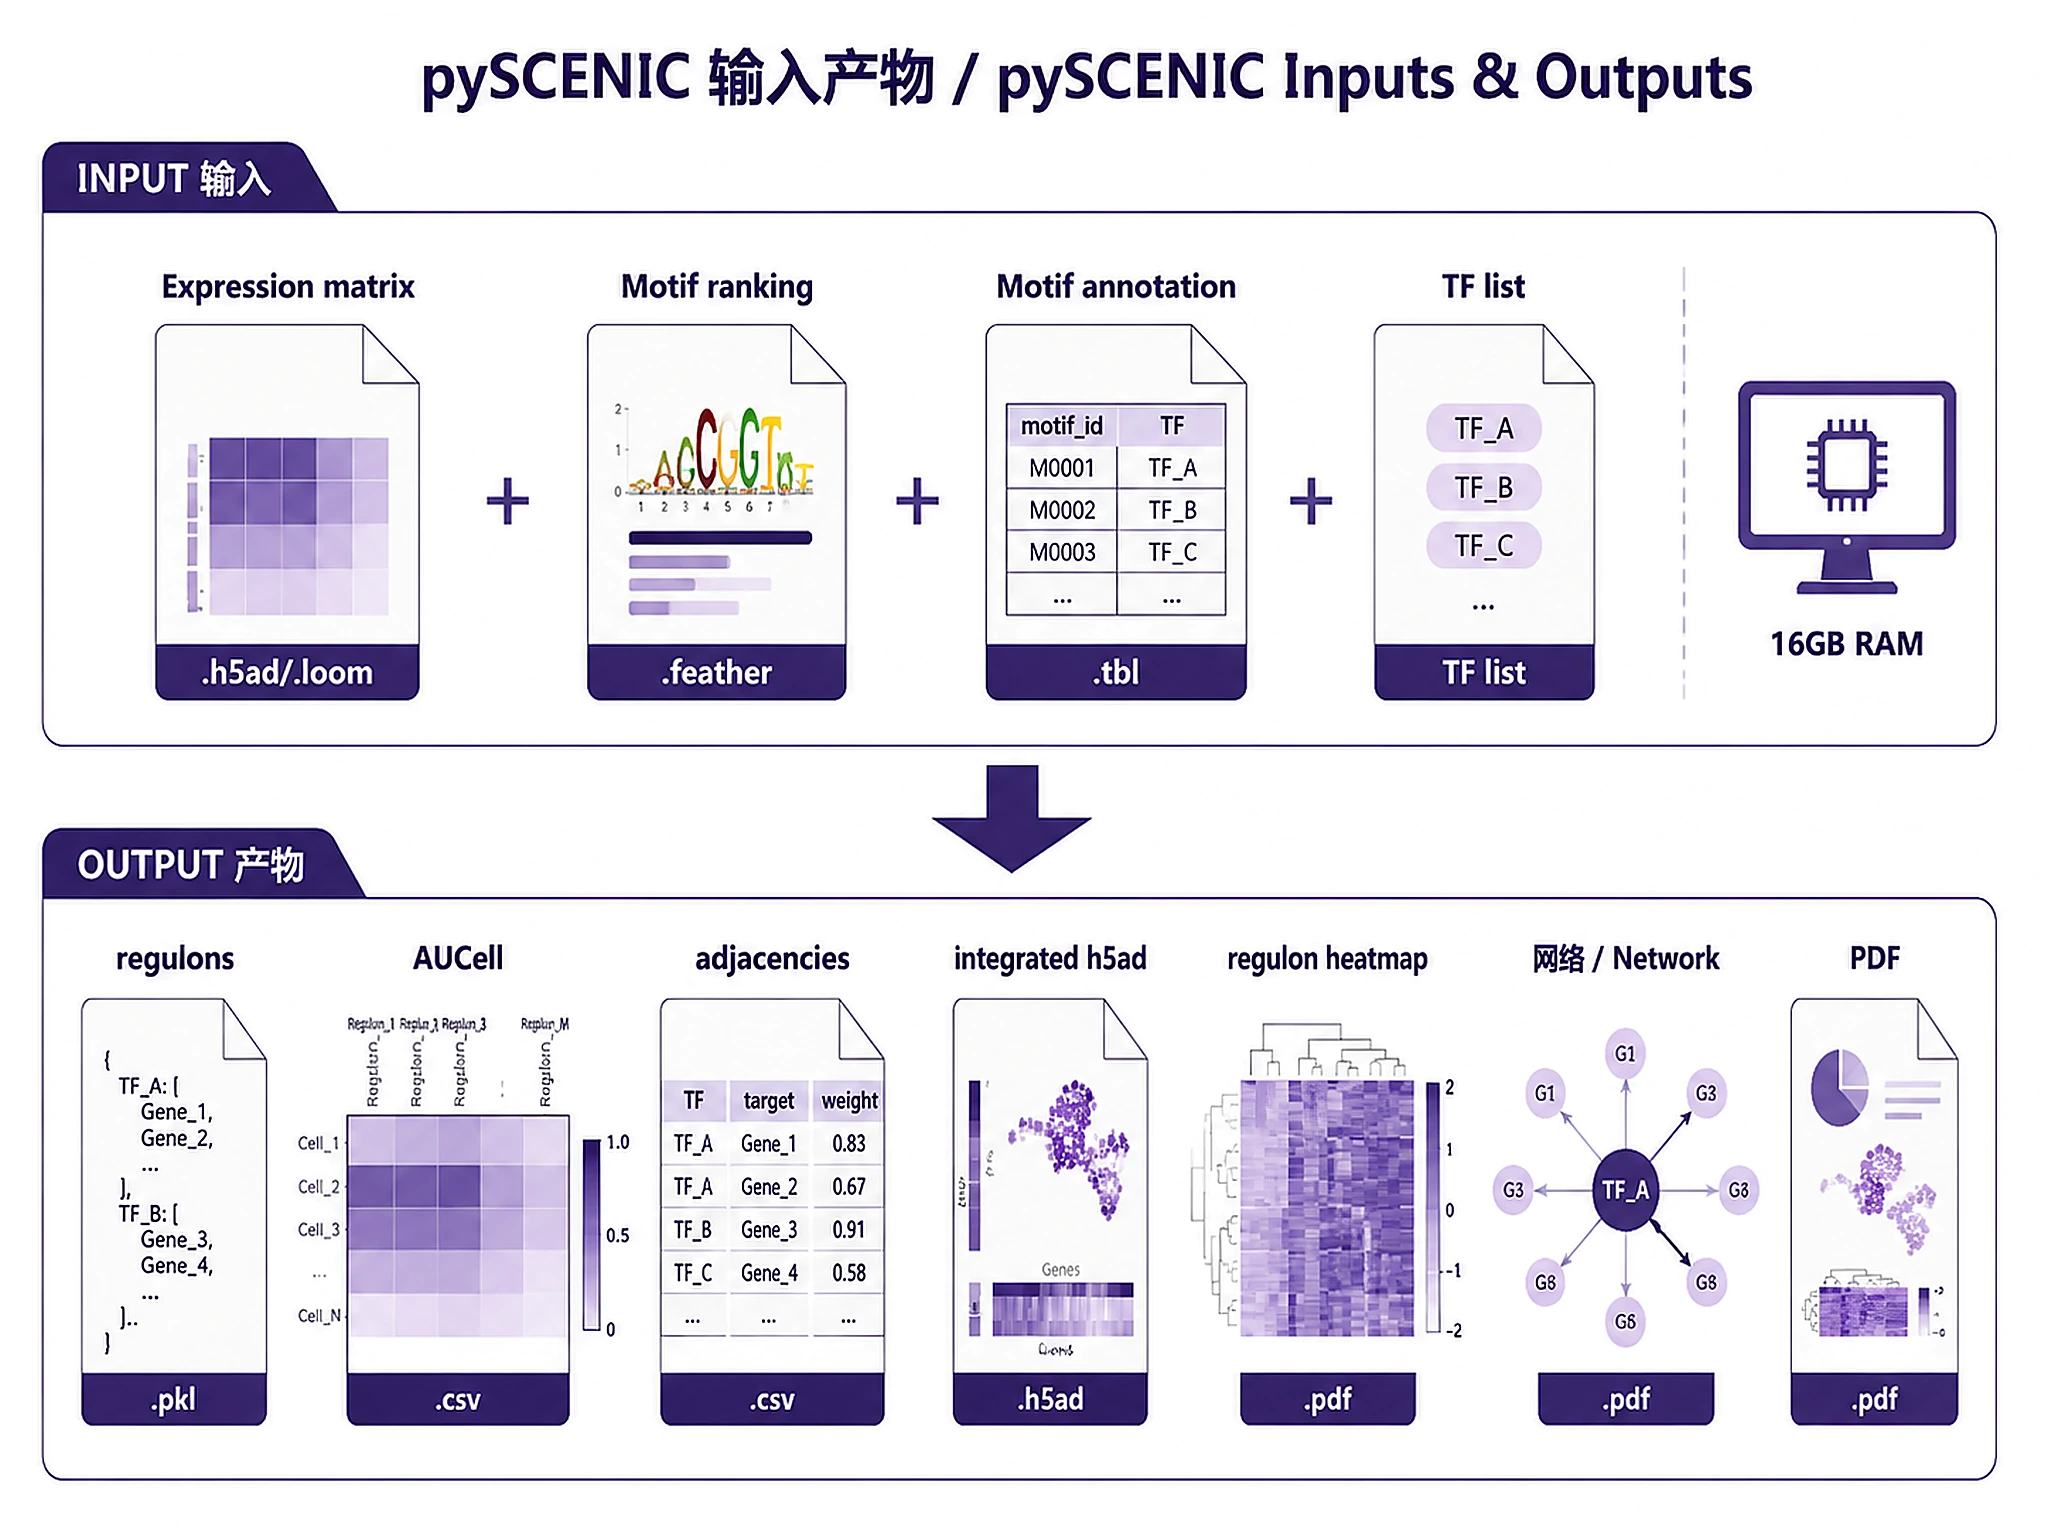
Single-cell expression matrix (one of):
- AnnData object (.h5ad) with raw or normalized counts
- Loom file (.loom)
- CSV/TSV matrix (genes × cells)
-
Reference databases (downloaded from SCENIC resources):
- Motif ranking database (e.g.,
hg38_10kbp_up_10kbp_down_full_tx_v10_clust.genes_vs_motifs.rankings.feather) - Motif annotation file (e.g.,
motifs-v10nr_clust-nr.hgnc-m0.001-o0.0.tbl) - TF list (e.g.,
allTFs_hg38.txt)
- Motif ranking database (e.g.,
Data Requirements
- Minimum cells: 500 (1,000+ recommended for robust GRN inference)
- Minimum genes: 2,000+ expressed genes
- Memory: 16GB+ RAM (more for large datasets)
- Runtime: 1-4 hours depending on dataset size
- QC: Apply basic quality filtering before SCENIC (remove low-quality cells/genes)
Outputs
Files Generated
Analysis objects (Pickle):
regulons.pkl- Regulon objects for downstream analysis- Load with:
regulons = pickle.load(open('regulons.pkl', 'rb')) - Required for: Downstream TF activity analysis, network visualization
auc_matrix.pkl- AUCell activity matrix (cells × regulons)- Load with:
auc_matrix = pickle.load(open('auc_matrix.pkl', 'rb'))
Results (CSV):
adjacencies.csv- Raw TF-target co-expression (GRNBoost2 output)regulons.csv- Final TF-target relationships after motif pruningaucell_matrix.csv- Cell × Regulon activity scores (values 0-1)aucell_summary.csv- Per-regulon statisticsscenic_regulon_summary.csv- Comprehensive regulon summary
Integrated data:
adata_with_scenic.h5ad- AnnData with integrated regulon activities
Visualizations (PNG + SVG):
regulon_heatmap.png/.svg- Top regulons by varianceregulon_network.png/.svg- TF-target network visualization
Reports:
scenic_report.md- Analysis summary with top regulonsscenic_analysis_report.pdf- Publication-quality PDF with Introduction, Methods, Results (embedded figures), Conclusions- Requires:
pip install reportlab(optional — markdown report generated regardless)
Clarification Questions
Before running, confirm:
-
Input Files (ASK THIS FIRST):
- Do you have single-cell RNA-seq data to analyze?
- If uploaded: Is this the .h5ad/.loom/matrix file you'd like to use?
- Expected formats: AnnData (.h5ad), Loom (.loom), CSV/TSV matrix
- Or use example/demo data? Use
load_example_data.pyfor PBMC 3k (~2,700 cells, 30-45 min test)
-
Species?
- Human (hg38) - most common, databases readily available
- Mouse (mm10) - databases available
- Other species - check database availability first
-
Dataset size?
- 500-2,000 cells → Minimum viable, ~1-2 hours
- 2,000-10,000 cells → Good, ~2-3 hours
- 10,000+ cells → Excellent, may need subsampling, 3-4 hours
-
Do you have the cisTarget databases downloaded?
- Yes → Provide paths to .feather, .tbl, and TF list files
- No → Will download during setup (~2-3GB, 10-15 min)
-
What outputs do you need?
- Regulons only (TF-target relationships)
- AUCell scores (cell-level TF activity)
- Both with visualizations (recommended)
Standard Workflow
🚨 MANDATORY: USE SCRIPTS EXACTLY AS SHOWN - DO NOT WRITE INLINE CODE 🚨
Step 1 - Load data and run GRN inference:
# Load expression data
# Option A: Load your own data
from scripts.load_expression_data import load_expression_data
adata, ex_matrix = load_expression_data("scrnaseq_data.h5ad")

# Option B: Load example PBMC 3k data for testing
# from scripts.load_example_data import load_pbmc3k_example
# adata, ex_matrix = load_pbmc3k_example()

# Run GRN inference with GRNBoost2
from scripts.run_grn_workflow import run_complete_grn_workflow
results = run_complete_grn_workflow(
    ex_matrix=ex_matrix,
    tf_list_file="allTFs_hg38.txt",
    database_glob="pyscenic_databases/*.feather",
    motif_annotations_file="pyscenic_databases/motifs-v10nr_clust-nr.hgnc-m0.001-o0.0.tbl",
    output_dir="scenic_results"
)
DO NOT write inline GRNBoost2, cisTarget, or AUCell code. Use the script.
✅ VERIFICATION: You should see:
"✓ Data loaded successfully: X cells, Y genes""✓ GRN inference completed: X TF-target pairs""✓ cisTarget pruning completed: X regulons""✓ AUCell scoring completed"
Step 2 - Integrate with AnnData:
from scripts.integrate_with_adata import integrate_with_adata
adata = integrate_with_adata(
    adata,
    results['auc_matrix'],
    results['regulons'],
    output_file="scenic_results/adata_with_scenic.h5ad"
)
✅ VERIFICATION: "✓ Integration completed: regulon activities added to adata.obsm['X_aucell']"
Step 3 - Generate visualizations:
from scripts.plot_regulon_visualizations import generate_all_visualizations
generate_all_visualizations(
    results['auc_matrix'],
    results['regulons'],
    adata,
    top_n=20,
    output_dir="scenic_results/plots"
)
DO NOT write inline plotting code (matplotlib, seaborn, etc.). Just use the script.
The script handles PNG + SVG export with graceful fallback.
✅ VERIFICATION: "✓ All visualizations generated successfully!"
Step 4 - Export results:
from scripts.export_all import export_all
export_all(
    regulons=results['regulons'],
    auc_matrix=results['auc_matrix'],
    auc_summary=results['auc_summary'],
    adjacencies=results['adjacencies'],
    output_dir="scenic_results"
)
DO NOT write custom export code. Use export_all().
✅ VERIFICATION: "=== Export Complete ==="
Note: If reportlab is installed, a PDF report (scenic_analysis_report.pdf) is also generated.
⚠️ CRITICAL - DO NOT:
- ❌ Write inline GRNBoost2/cisTarget code → STOP: Use
run_complete_grn_workflow() - ❌ Write inline plotting code → STOP: Use
generate_all_visualizations() - ❌ Write custom export code → STOP: Use
export_all() - ❌ Try to install system dependencies → Script checks availability
⚠️ IF SCRIPTS FAIL - Script Failure Hierarchy:
- Fix and Retry (90%) - Install missing package, re-run script
- Modify Script (5%) - Edit the script file itself, document changes
- Use as Reference (4%) - Read script, adapt approach, cite source
- Write from Scratch (1%) - Only if genuinely impossible, explain why
NEVER skip directly to writing inline code without trying the script first.
Common Issues
| Error | Cause | Solution |
|---|---|---|
| Memory error during GRNBoost2 | Dataset too large | Subsample to 5,000-10,000 cells or filter to top 2,000-5,000 variable genes |
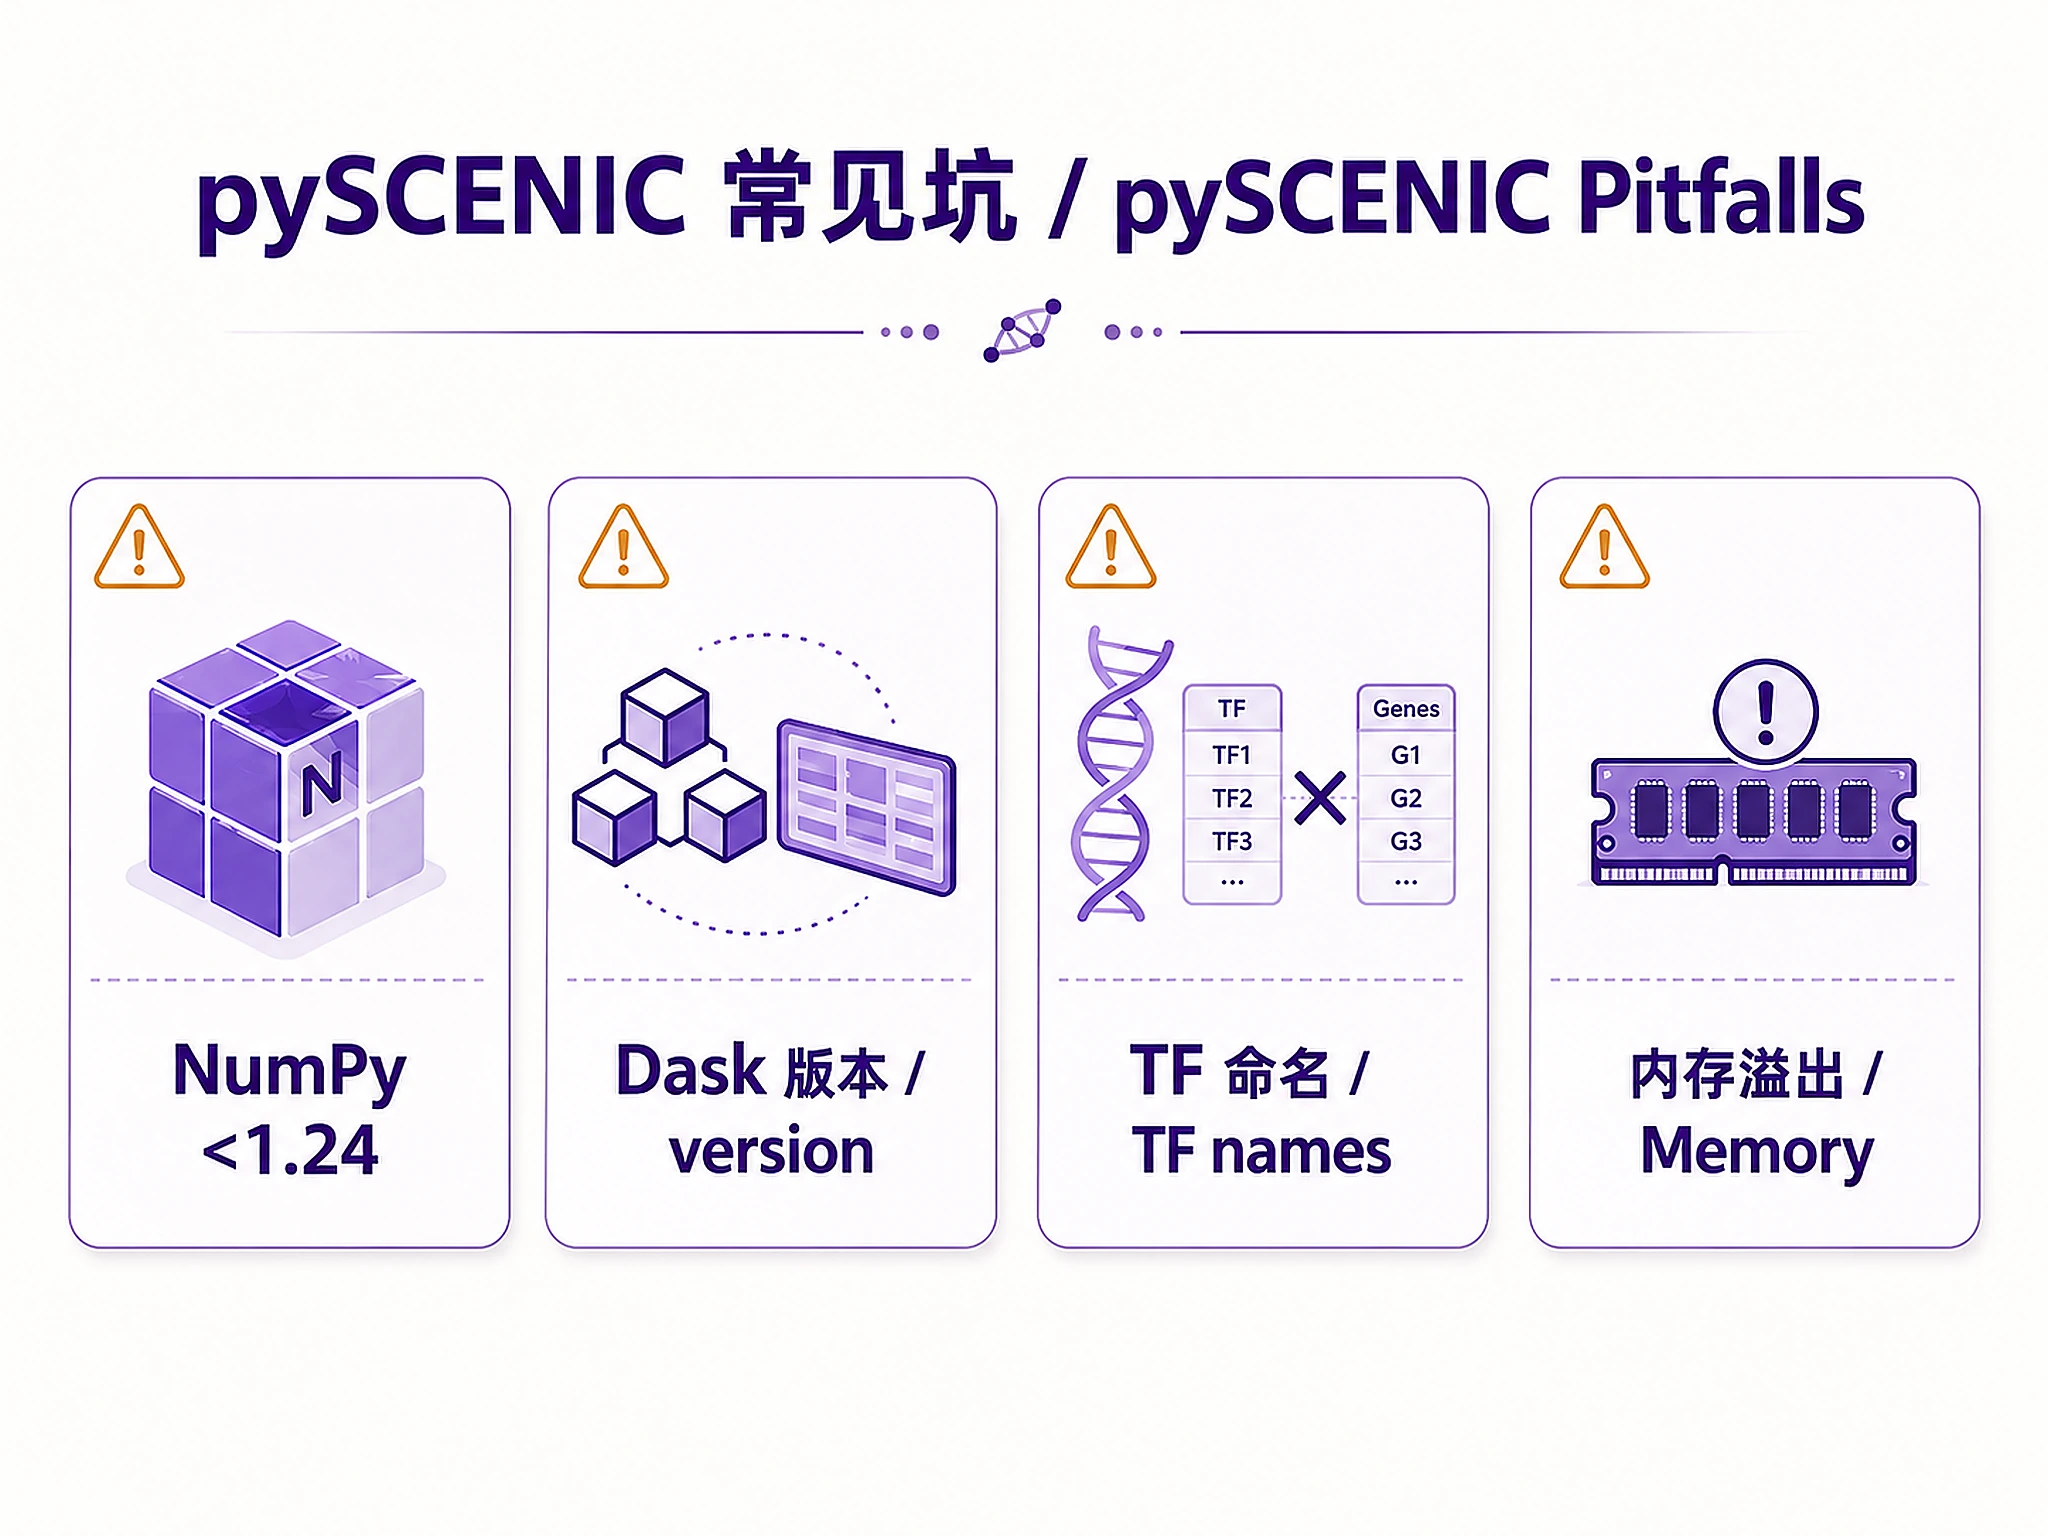
| No regulons found | TF names don't match gene symbols | Check TF list uses same nomenclature (HGNC/MGI); verify gene names in data |
| cisTarget database error | Wrong format or corrupted file | Re-download databases; ensure using Feather v2 format (.feather) |
| Very slow GRN inference | Too many genes or single-threaded | Filter to variable genes; increase n_workers parameter (4-8 recommended) |
| AUCell scores all low | Poor regulon quality or normalization | Check regulon sizes (need 10+ genes); verify input is normalized counts |
| Database loading fails | Path incorrect or file not found | Use absolute paths to databases; verify files exist |
| SVG export error | Missing optional dependency | Normal - script falls back to PNG automatically. Both formats will be created. |
| NumPy AttributeError: np.object | Incompatible NumPy version | Install NumPy <1.24: pip install 'numpy<1.24.0' - pySCENIC 0.12.1 requires NumPy 1.20-1.23 |
| TypeError: Must supply at least one delayed object | Incompatible Dask version | Install Dask 2023.5.0: pip install 'dask[complete]==2023.5.0' 'distributed==2023.5.0' and uninstall dask-expr if present |
Suggested Next Steps
After completing pySCENIC analysis:
- Identify key regulators: Focus on high-variance regulons with cell-type-specific activity
- Validate regulons: Compare with literature, ChIP-seq data, or perturbation experiments
- Downstream analysis: - Differential regulon activity between conditions (Scanpy/Seurat) - Trajectory analysis with regulon dynamics (RNA velocity + SCENIC) - Integration with other modalities (ATAC-seq, ChIP-seq)
- Functional enrichment: Analyze target genes of top regulons
- Network analysis: Identify TF-TF interactions and regulatory hierarchies
Related Skills
- scrnaseq-scanpy-core-analysis - Upstream: Single-cell preprocessing and clustering
- scrnaseq-seurat-core-analysis - Upstream: Alternative single-cell preprocessing (R)
- functional-enrichment-from-degs - Related: Pathway analysis of regulon targets
- de-results-to-plots - Related: Visualizing differential activity results
References
- Aibar et al. (2017). SCENIC: single-cell regulatory network inference and clustering. Nature Methods. doi:10.1038/nmeth.4463
- Van de Sande et al. (2020). A scalable SCENIC workflow for single-cell gene regulatory network analysis. Nature Protocols. doi:10.1038/s41596-020-0336-2
- Huynh-Thu et al. (2010). Inferring regulatory networks from expression data using tree-based methods. PLoS ONE. doi:10.1371/journal.pone.0012776
- pySCENIC Documentation: https://pyscenic.readthedocs.io/
- SCENIC Resources: https://resources.aertslab.org/cistarget/
Code preview
scripts/export_all.py
"""
Export all pySCENIC results to standard formats.

Saves analysis objects (pickle) for downstream skills and exports
results to CSV/markdown/PDF formats for human analysis.
"""

import os
import pickle
import pandas as pd
from datetime import datetime


def export_all(regulons, auc_matrix, auc_summary, adjacencies=None, output_dir="."):
    """
    Export all pySCENIC results to pickle and CSV formats.

    This function saves all analysis objects and results for downstream use
    and generates a comprehensive analysis report.

    Parameters:
    -----------
    regulons : list
        List of Regulon objects from pySCENIC
    auc_matrix : pd.DataFrame
        AUCell activity matrix (cells x regulons)
    auc_summary : pd.DataFrame
        Summary statistics per regulon
    adjacencies : pd.DataFrame, optional
        Raw TF-target adjacencies from GRNBoost2
    output_dir : str
        Directory to save outputs (default: current directory)

    Examples:
    ---------
    >>> export_all(regulons, auc_matrix, auc_summary, adjacencies, output_dir="scenic_results")

    Outputs:
    --------
    - regulons.pkl - Regulon objects for downstream analysis
    - auc_matrix.pkl - AUCell activity matrix
    - regulons.csv - Human-readable TF-target relationships
    - aucell_matrix.csv - Cell x regulon activity scores
    - aucell_summary.csv - Per-regulon statistics
    - scenic_regulon_summary.csv - Comprehensive regulon summary
    - scenic_report.md - Analysis summary report
    - scenic_analysis_report.pdf - Publication-quality PDF report (if reportlab installed)
    """
    os.makedirs(output_dir, exist_ok=True)

    print("\nExporting pySCENIC results...")

    # 1. Save analysis objects as pickle (CRITICAL for downstream skills)
    print("  Saving analysis objects...")
    regulons_pkl = os.path.join(output_dir, "regulons.pkl")
    with open(regulons_pkl, 'wb') as f:
        pickle.dump(regulons, f)
    print(f"   Saved: {regulons_pkl}")
    print(f"   (Load with: regulons = pickle.load(open('{regulons_pkl}', 'rb')))")

    auc_matrix_pkl = os.path.join(output_dir, "auc_matrix.pkl")
    with open(auc_matrix_pkl, 'wb') as f:
        pickle.dump(auc_matrix, f)
    print(f"   Saved: {auc_matrix_pkl}")
    print(f"   (Load with: auc_matrix = pickle.load(open('{auc_matrix_pkl}', 'rb')))")

    # 2. Export regulons to CSV (human-readable)
    print("  Exporting regulon relationships...")
    regulon_data = []
    for reg in regulons:
        tf = reg.transcription_factor
        for gene in reg.genes:
            regulon_data.append({
                'TF': tf,
                'Regulon': reg.name,
                'Target': gene,
                'N_targets': len(reg.genes)
            })

    regulons_csv = os.path.join(output_dir, "regulons.csv")
scripts/generate_report.py
"""
Generate a structured PDF analysis report for pySCENIC GRN inference.

Creates a publication-quality PDF with Introduction, Methods, Results
(with embedded figures), and Conclusions sections using reportlab.

Requires: reportlab (pip install reportlab)
Falls back gracefully if reportlab is not installed.
"""

import os
from datetime import datetime

try:
    from reportlab.lib import colors
    from reportlab.lib.pagesizes import letter
    from reportlab.lib.styles import getSampleStyleSheet, ParagraphStyle
    from reportlab.lib.units import inch
    from reportlab.lib.enums import TA_CENTER
    from reportlab.platypus import (
        SimpleDocTemplate, Paragraph, Spacer, Table, TableStyle,
        Image, PageBreak, HRFlowable,
    )
    HAS_REPORTLAB = True
except ImportError:
    HAS_REPORTLAB = False


# ---------------------------------------------------------------------------
# Color constants (consistent with clinicaltrials-landscape)
# ---------------------------------------------------------------------------
if HAS_REPORTLAB:
    COLOR_PRIMARY = colors.HexColor("#1B4F72")
    COLOR_ACCENT = colors.HexColor("#E74C3C")
    COLOR_DARK = colors.HexColor("#2C3E50")
    COLOR_LIGHT_GRAY = colors.HexColor("#F2F3F4")
    COLOR_MEDIUM_GRAY = colors.HexColor("#BDC3C7")


# ---------------------------------------------------------------------------
# Style helpers
# ---------------------------------------------------------------------------

def _build_styles():
    """Create custom paragraph styles for the report."""
    styles = getSampleStyleSheet()

    styles.add(ParagraphStyle(
        "ReportTitle", parent=styles["Title"],
        fontSize=24, textColor=COLOR_PRIMARY, spaceAfter=6,
        alignment=TA_CENTER, fontName="Helvetica-Bold",
    ))
    styles.add(ParagraphStyle(
        "ReportSubtitle", parent=styles["Normal"],
        fontSize=12, textColor=COLOR_DARK, spaceAfter=20,
        alignment=TA_CENTER, fontName="Helvetica",
    ))
    styles.add(ParagraphStyle(
        "SectionHeading", parent=styles["Heading1"],
        fontSize=16, textColor=COLOR_PRIMARY, spaceBefore=18,
        spaceAfter=8, fontName="Helvetica-Bold",
    ))
    styles.add(ParagraphStyle(
        "SubHeading", parent=styles["Heading2"],
        fontSize=13, textColor=COLOR_DARK, spaceBefore=12,
        spaceAfter=6, fontName="Helvetica-Bold",
    ))
    styles.add(ParagraphStyle(
        "ReportBody", parent=styles["Normal"],
        fontSize=10, textColor=COLOR_DARK, spaceAfter=6,
        leading=14, fontName="Helvetica",
    ))
    styles.add(ParagraphStyle(
        "StatNumber", parent=styles["Normal"],
        fontSize=28, textColor=COLOR_ACCENT, alignment=TA_CENTER,
        spaceAfter=2, fontName="Helvetica-Bold",
    ))
    styles.add(ParagraphStyle(
        "StatLabel", parent=styles["Normal"],
        fontSize=9, textColor=COLOR_DARK, alignment=TA_CENTER,
scripts/integrate_with_adata.py
"""
Integrate pySCENIC results with AnnData object.
"""


def integrate_with_adata(adata, auc_matrix, regulons, output_file="adata_with_scenic.h5ad"):
    """
    Add pySCENIC results to AnnData object for downstream analysis.

    Parameters:
    -----------
    adata : AnnData
        Original AnnData object
    auc_matrix : pd.DataFrame
        AUCell matrix (cells x regulons)
    regulons : list
        List of Regulon objects
    output_file : str
        Path to save updated AnnData (default: "adata_with_scenic.h5ad")

    Returns:
    --------
    adata : AnnData
        Updated AnnData object with regulon activities in .obsm['X_aucell']

    Examples:
    ---------
    >>> adata = integrate_with_adata(adata, auc_matrix, regulons)
    >>> print(f"Added {auc_matrix.shape[1]} regulon activities to adata.obsm['X_aucell']")
    """
    # Add AUCell scores to obsm
    adata.obsm['X_aucell'] = auc_matrix.loc[adata.obs_names].values

    # Store regulon names
    adata.uns['regulon_names'] = list(auc_matrix.columns)

    # Store regulon information
    regulon_info = {}
    for reg in regulons:
        regulon_info[reg.name] = {
            'tf': reg.transcription_factor,
            'n_targets': len(reg.genes),
            'targets': list(reg.genes)[:50]  # Store top 50 targets
        }
    adata.uns['regulons'] = regulon_info

    print(f"✓ Integration completed: regulon activities added to adata.obsm['X_aucell']")
    print(f"  {auc_matrix.shape[1]} regulons added")

    # Save updated AnnData
    adata.write(output_file)
    print(f"Saved: {output_file}")

    return adata
Companion files
| Type | Path | Bytes |
|---|---|---|
| Markdown | references/cli_interface.md | 4,916 |
| Markdown | references/database_downloads.md | 6,001 |
| Python | scripts/export_all.py | 8,049 |
| Python | scripts/generate_report.py | 21,461 |
| Python | scripts/integrate_with_adata.py | 1,607 |
| Python | scripts/load_example_data.py | 6,795 |
| Python | scripts/load_expression_data.py | 1,863 |
| Python | scripts/plot_regulon_visualizations.py | 8,718 |
| Python | scripts/run_grn_workflow.py | 6,539 |
| Markdown | SKILL.md | 14,657 |
| JSON | skill.meta.json | 2,152 |