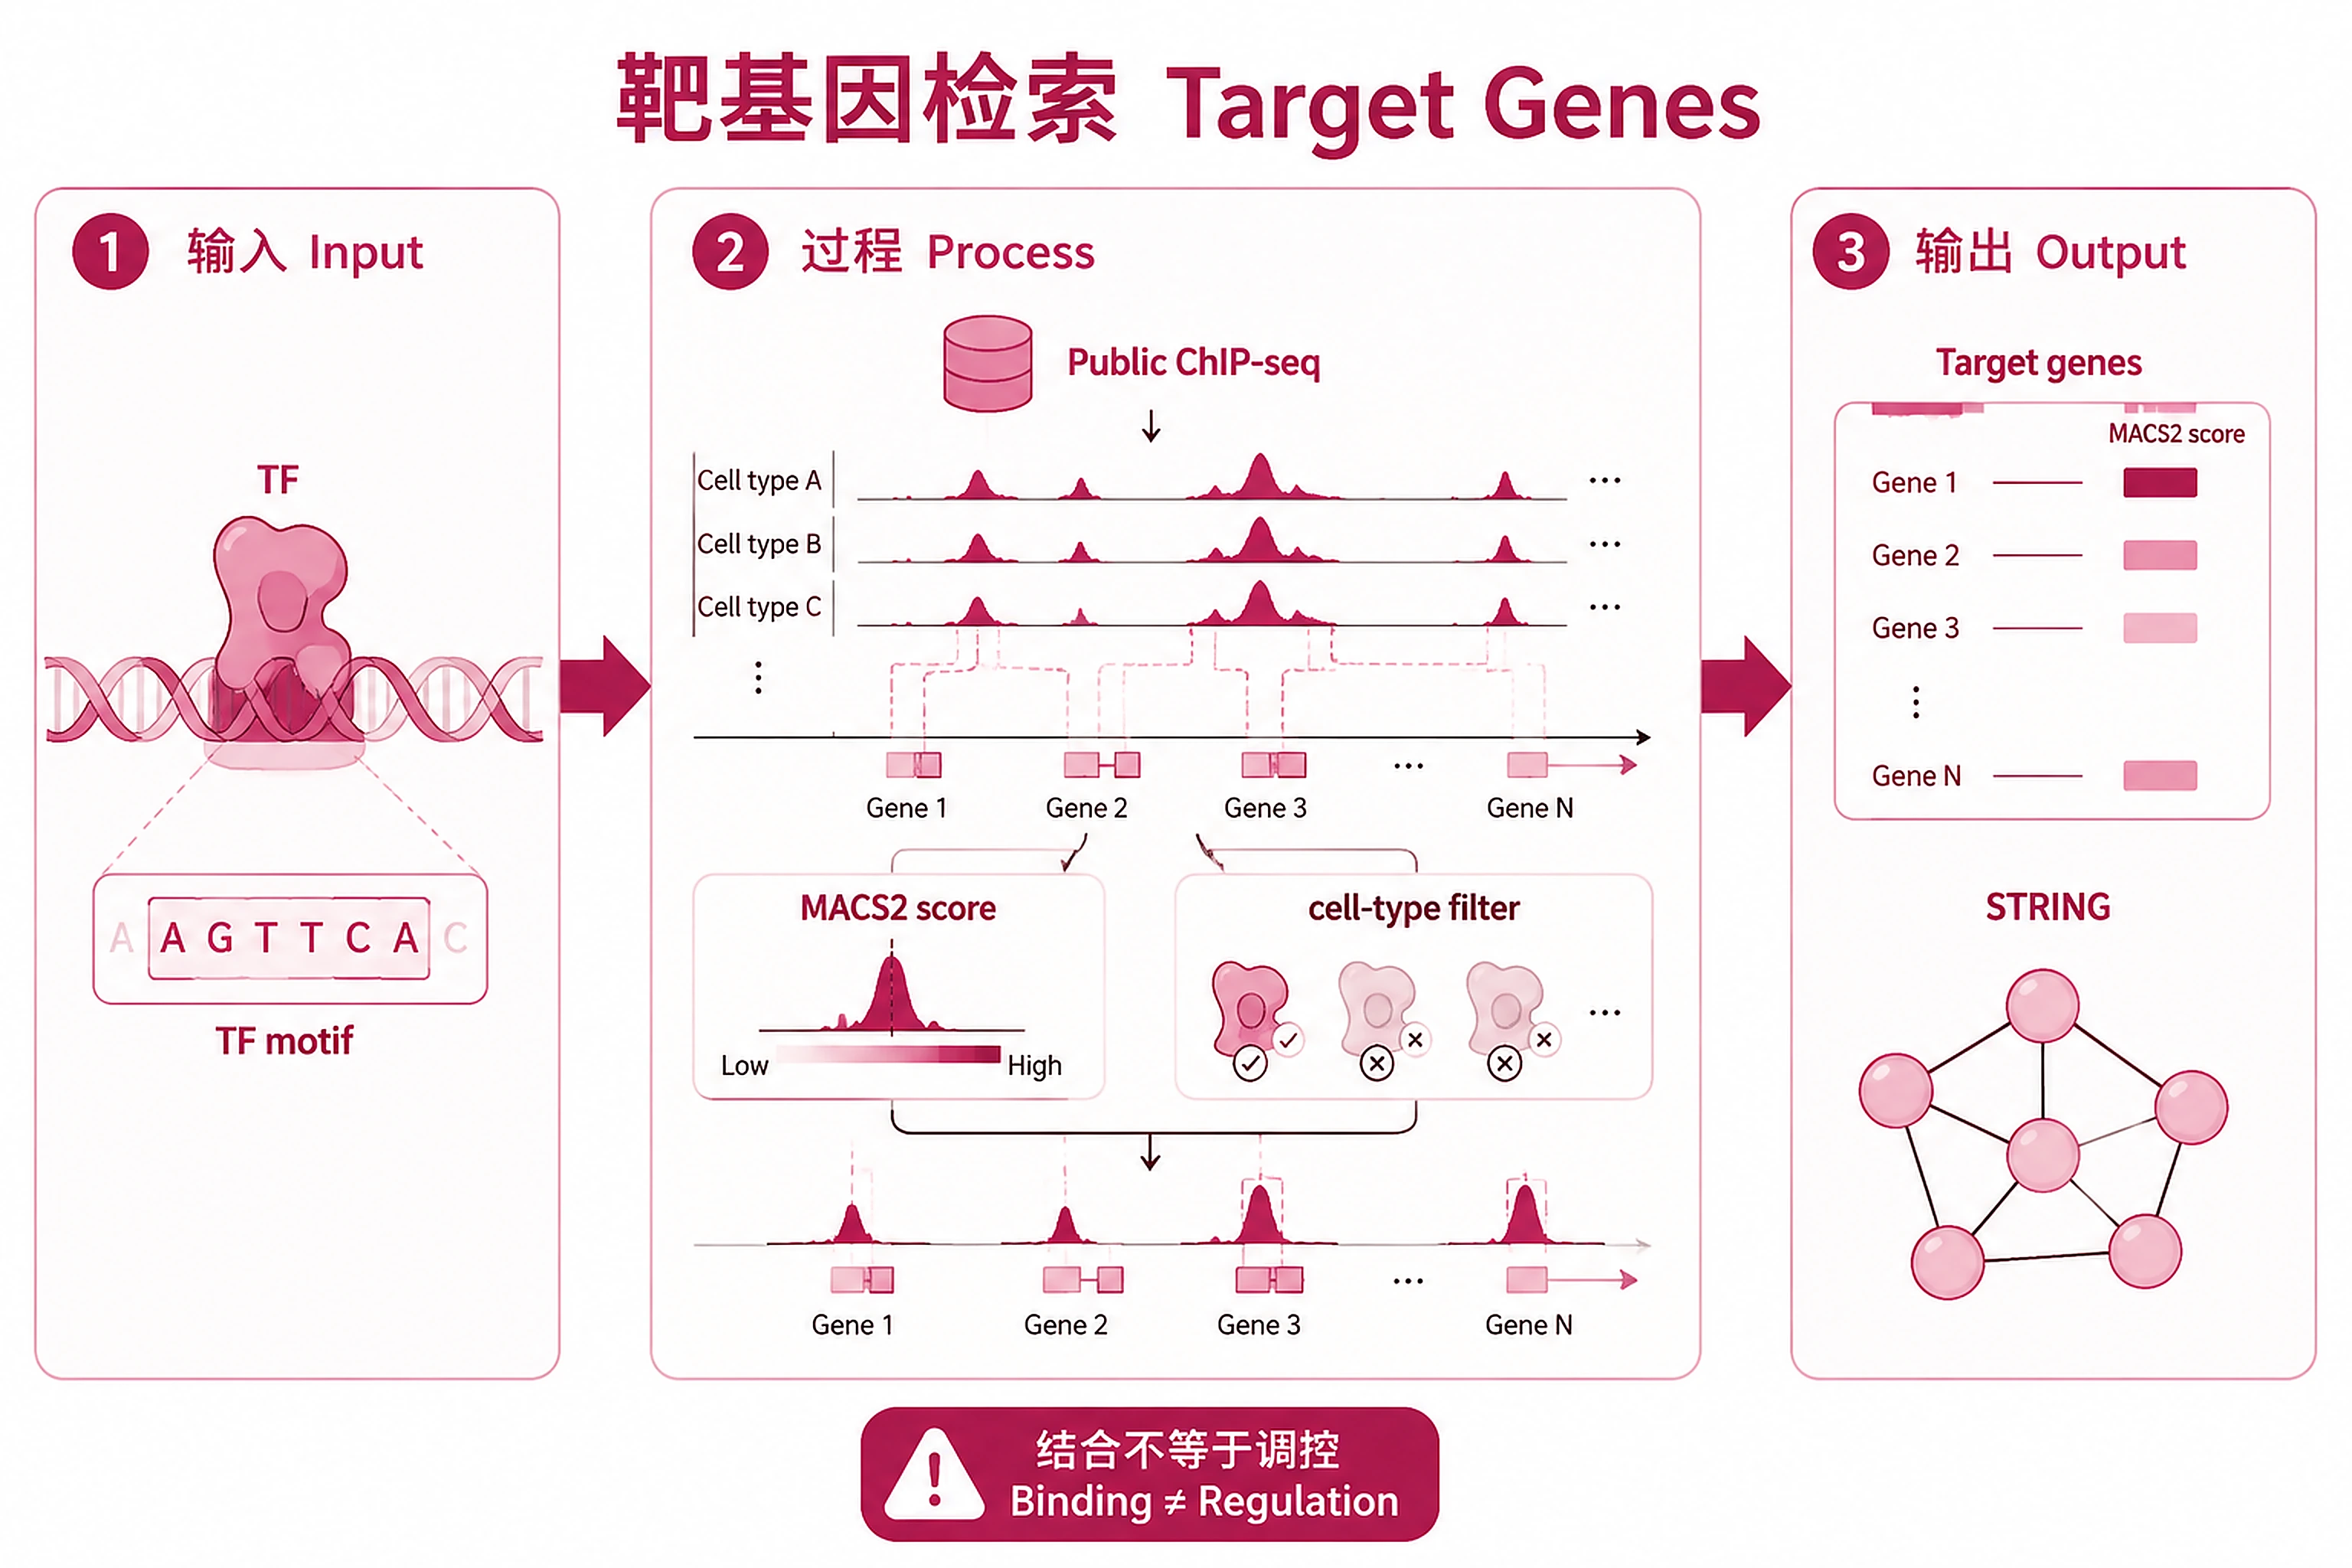
Target Genes (TF → genes)
Pre-computed target genes for any transcription factor.
Overview
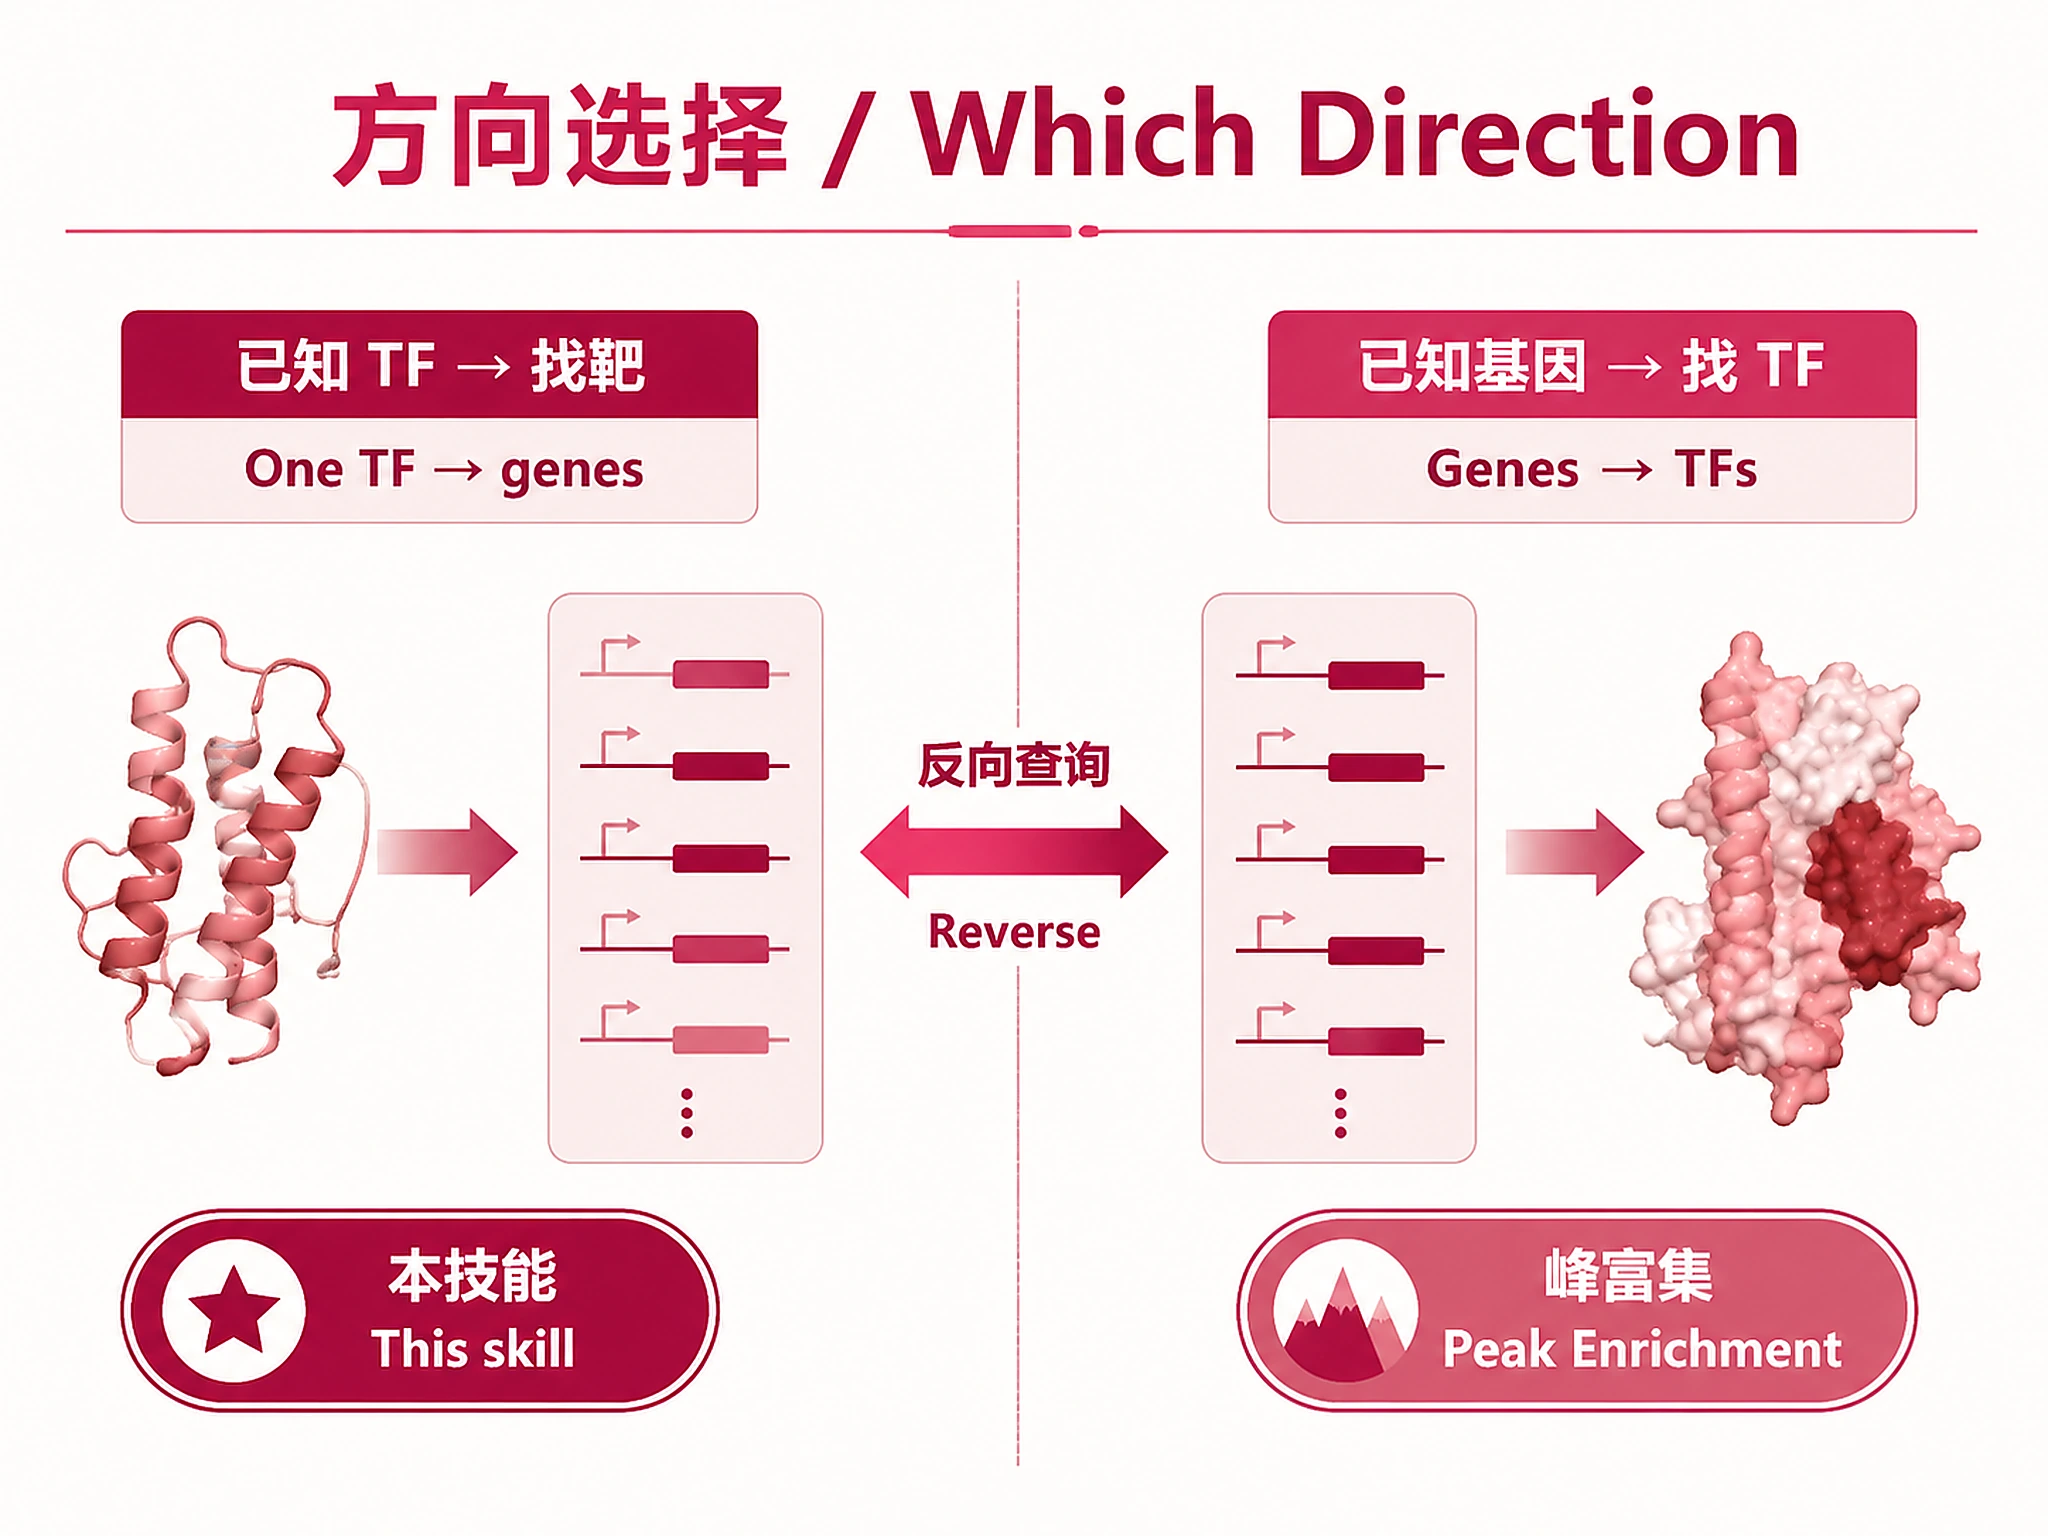
Problem. Which genes does this TF bind and possibly regulate?
Learning goals
- Opposite direction: TF → genes
- Binding ≠ regulation; needs expression evidence
Figures
Tutorial
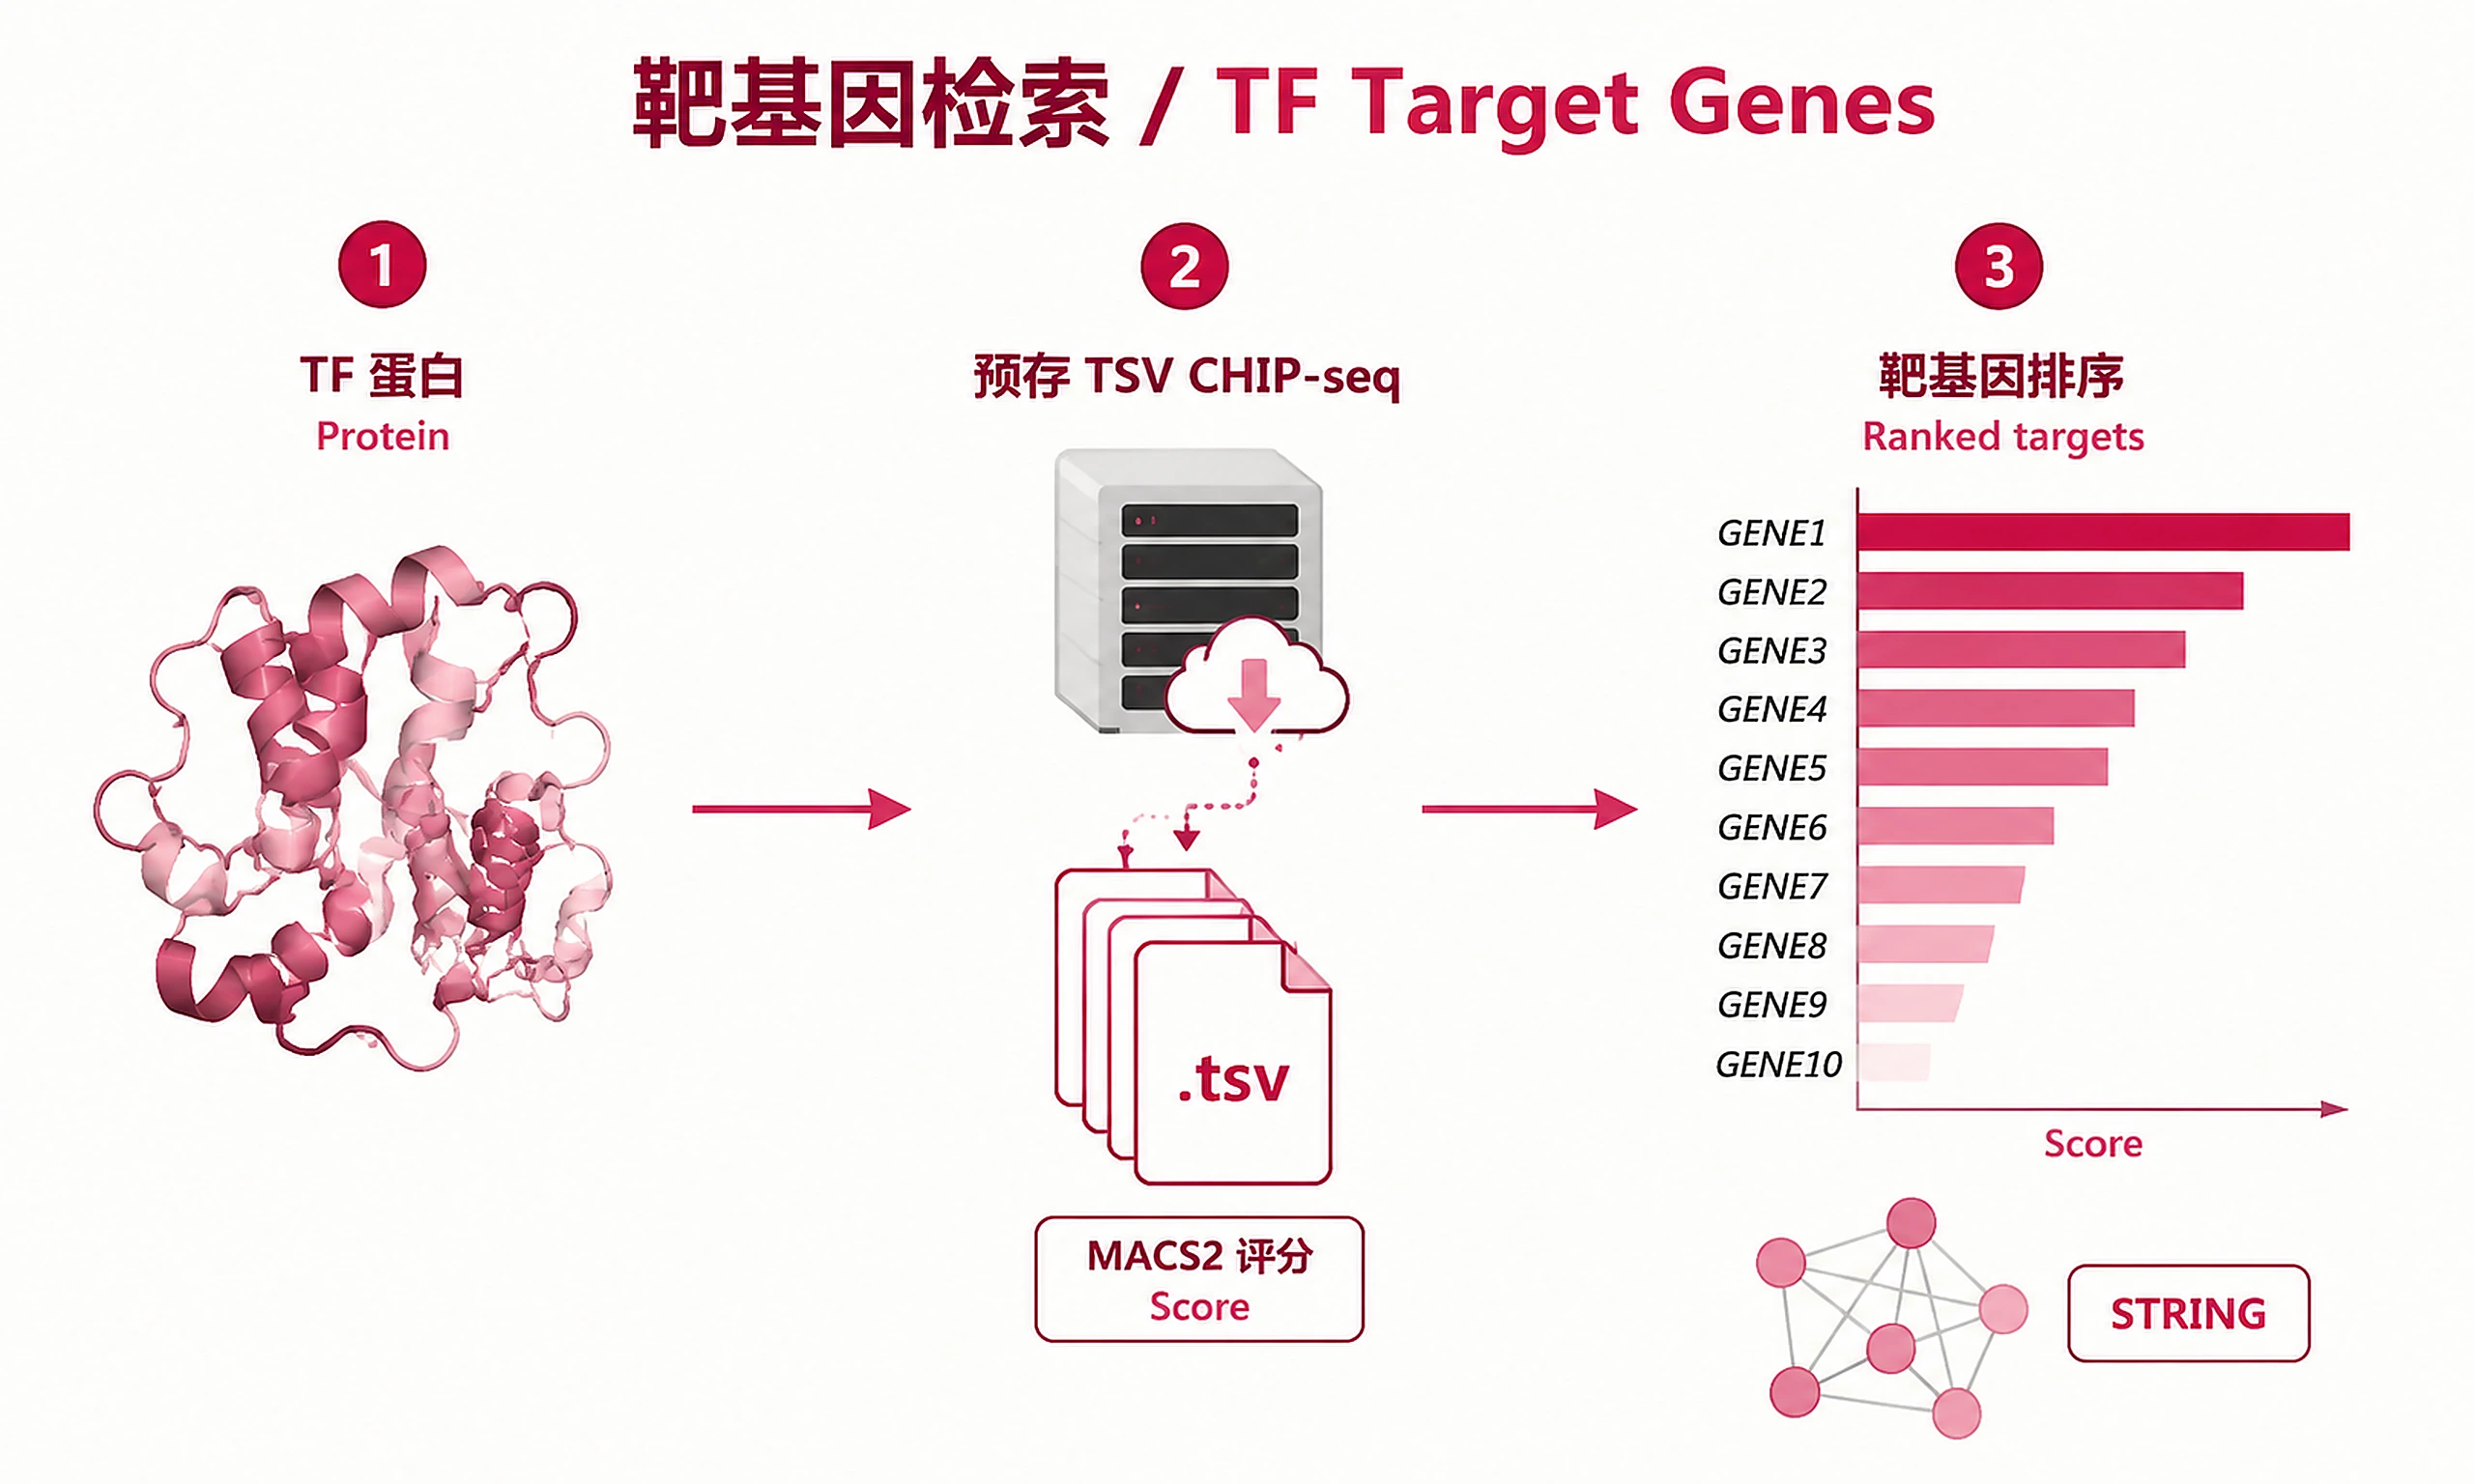
Find target genes for any transcription factor using pre-computed ChIP-Atlas public ChIP-seq data.
When to Use This Skill
Use ChIP-Atlas target genes when you need to:
- Identify target genes of a specific TF from all public ChIP-seq experiments
- Rank potential targets by MACS2 binding score across hundreds of experiments
- Compare TF binding across cell types using per-experiment binding scores
- Validate known TF-target relationships with independent ChIP-seq evidence
- Cross-reference with STRING protein interaction data for high-confidence targets
Don't use for:
- Finding which TFs bind near your genes (use chip-atlas-peak-enrichment instead)
- Histone mark targets (only non-histone antigens/TFs available)
- Offline analysis (requires internet for data download)
- Raw ChIP-seq analysis from FASTQ/BAM files
Key Concept: Downloads pre-computed TSV files containing MACS2 binding scores for every gene, across all public ChIP-seq experiments for the specified protein. Genes are ranked by average binding score. No API job submission needed — data is served as static files. STRING protein interaction scores are pre-embedded columns in the ChIP-Atlas TSV — no separate STRING API query is performed.
Installation
| Software | Version | License | Commercial Use | Installation |
|---|---|---|---|---|
| pandas | >=1.3 | BSD-3-Clause | Permitted | pip install pandas |
| requests | >=2.25 | Apache-2.0 | Permitted | pip install requests |
| numpy | >=1.20 | BSD-3-Clause | Permitted | pip install numpy |
| plotnine | >=0.12 | MIT | Permitted | pip install plotnine |
| plotnine_prism | >=0.1 | MIT | Permitted | pip install plotnine_prism |
| matplotlib | >=3.4 | PSF-based | Permitted | pip install matplotlib |
| seaborn | >=0.12 | BSD-3-Clause | Permitted | pip install seaborn |
pip install pandas requests numpy plotnine plotnine_prism matplotlib seaborn
System requirements: Internet connection (downloads from ChIP-Atlas data server)
Inputs
Query parameters:
- Protein/TF name: Case-sensitive gene symbol (e.g., "TP53", "CTCF", "MYC")
- Genome: hg38 (default), hg19, mm10, mm9, rn6, dm6, dm3, ce11, ce10, sacCer3
- Distance from TSS: 1kb, 5kb (default), or 10kb
Optional filters:
- min_score: Minimum average MACS2 binding score (default: 0)
- top_n: Keep top N genes (default: 500)
- cell_types: List of cell types to subset (recalculates averages)
- min_string_score: Minimum STRING interaction score
- min_binding_rate: Minimum fraction of experiments with binding
Outputs
Analysis objects (Pickle):
analysis_object.pkl- Complete results for downstream use- Load with:
import pickle; obj = pickle.load(open('analysis_object.pkl', 'rb')) - Contains: target_genes, experiment_data, cell_types, protein, parameters, metadata
Results (CSV):
target_genes_all.csv- All target genes (gene, avg_score, string_score, binding_rate, num_bound, max_score, colocated_group)target_genes_top50.csv- Top 50 by average binding scoretarget_genes_with_string.csv- Genes with STRING interaction evidenceexperiment_scores_top50.csv- Wide-format per-experiment scores for top 50
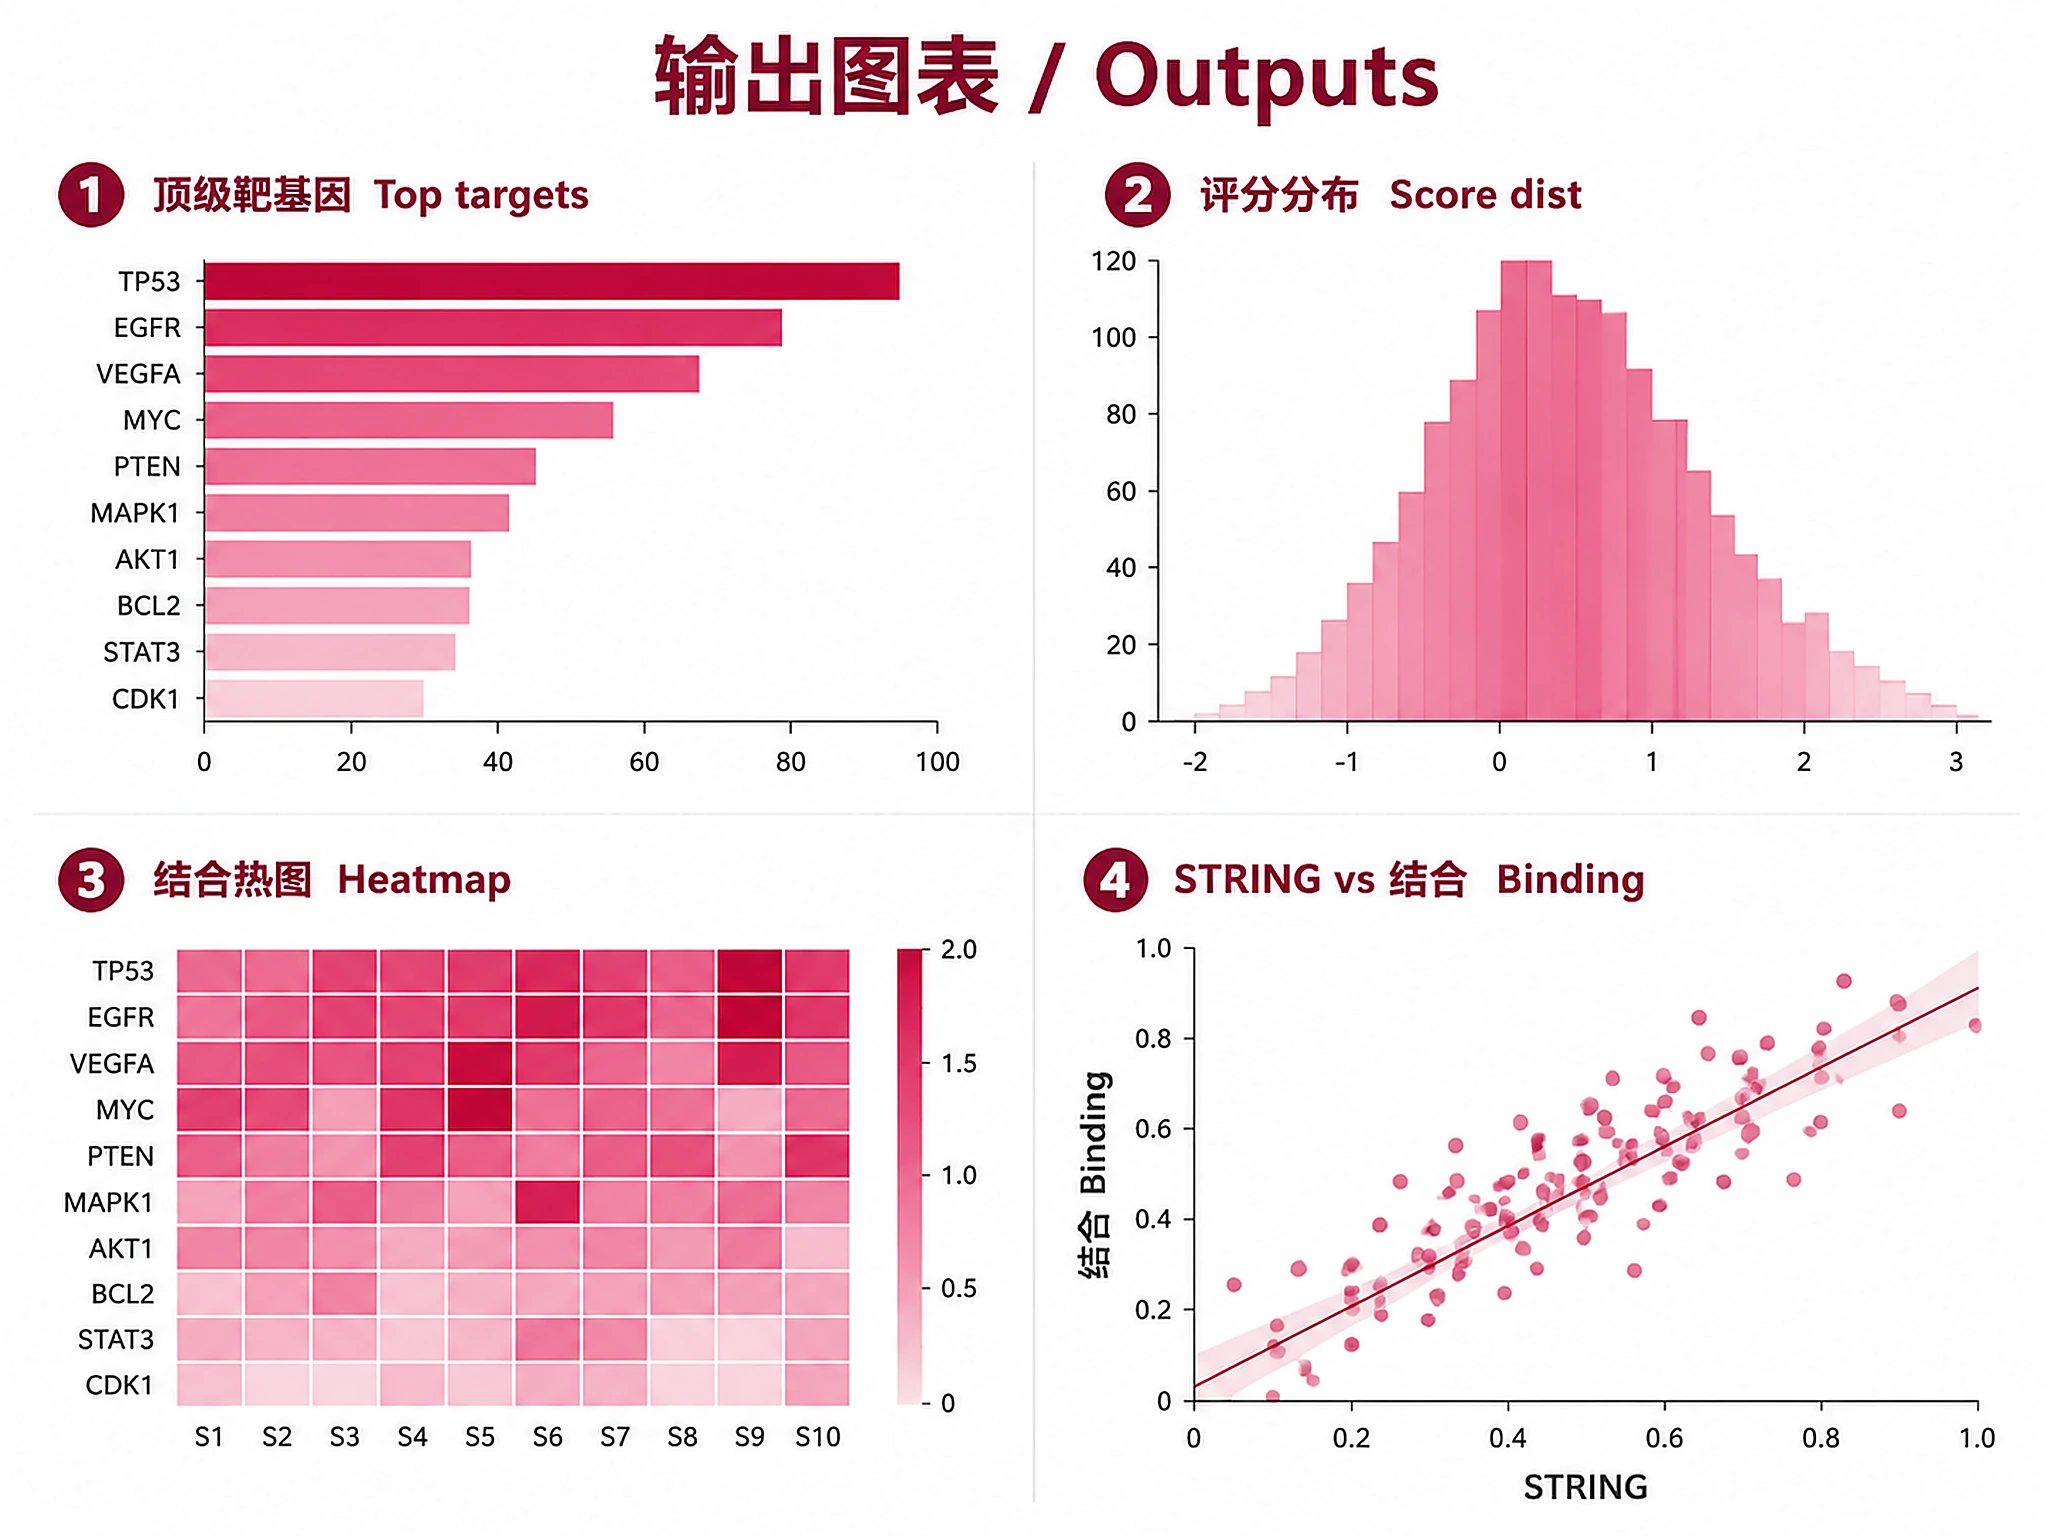
Visualizations (PNG + SVG, plotnine with Prism theme):
target_genes_top_targets.png/.svg- Top target genes barplottarget_genes_score_distribution.png/.svg- Binding score distribution histogramtarget_genes_heatmap.png/.svg- Binding heatmap (top genes × experiments)target_genes_string_vs_binding.png/.svg- STRING vs binding scatter
Reports:
summary_report.md- Human-readable analysis summary
Clarification Questions
🚨 ALWAYS ask Question 1 FIRST. Do not ask about species, genome, or analysis parameters before the user has answered Question 1.
1. Query (ASK THIS FIRST):
- Which transcription factor / protein do you want to find target genes for?
- Protein name is case-sensitive (e.g., "TP53" not "tp53")
- Or use example data?
tp53(large, ~16K genes),e2f1(cell cycle),myc(moderate)
🚨 IF EXAMPLE DATA SELECTED: All parameters are pre-defined (human hg38, ±5kb TSS, all cell types, no score threshold). DO NOT ask question 2. Proceed directly to Step 1.
Question 2 is ONLY for users providing their own query:
2. Analysis parameters:
- Species/genome? Human hg38 (default), hg19, mouse mm10/mm9, rat rn6, fly, worm, yeast
- Distance from TSS? ±5kb (default), ±1kb (proximal only), ±10kb (distal included)
- Cell type filter? All cell types (default), or specific types to get cell-type-specific rankings
- Score threshold? No minimum (default), or set min_score to focus on strong targets
Standard Workflow
🚨 MANDATORY: USE SCRIPTS EXACTLY AS SHOWN - DO NOT WRITE INLINE CODE 🚨
Step 1 - Load query:
# Option 1: Example query
from scripts.load_example_query import load_example_query
query = load_example_query("tp53")

# Option 2: Your own protein
# from scripts.load_user_query import load_user_query
# query = load_user_query("TP53", genome="hg38", distance=5)
✅ VERIFICATION: "✓ Query loaded: TP53 target genes (hg38, ±5kb)"
Step 2 - Run target genes analysis:
from scripts.run_target_genes_workflow import run_target_genes_workflow

results = run_target_genes_workflow(
    protein=query['protein'],
    genome=query['genome'],
    distance=query['distance'],
    top_n=500,
    output_dir="target_genes_results"
)
DO NOT write inline download/parsing code. Just use the script.
✅ VERIFICATION: "✓ Target genes analysis completed successfully!"
Step 3 - Generate visualizations:
from scripts.generate_all_plots import generate_all_plots
generate_all_plots(results, output_dir="target_genes_results", top_n=25)
DO NOT write inline plotting code. The script handles PNG + SVG with graceful fallback.
✅ VERIFICATION: "✓ All visualizations generated successfully!"
Step 4 - Export results:
from scripts.export_all import export_all
export_all(results, output_dir="target_genes_results")
DO NOT write custom export code. Use export_all().
✅ VERIFICATION: "=== Export Complete ==="
⚠️ CRITICAL - DO NOT:
- ❌ Write inline download/parsing code → STOP: Use
run_target_genes_workflow() - ❌ Write inline plotting code → STOP: Use
generate_all_plots() - ❌ Write custom export code → STOP: Use
export_all()
⚠️ IF SCRIPTS FAIL - Script Failure Hierarchy:
- Fix and Retry (90%) - Install missing package, check internet, re-run
- Modify Script (5%) - Edit the script file itself, document changes
- Use as Reference (4%) - Read script, adapt approach, cite source
- Write from Scratch (1%) - Only if genuinely impossible, explain why
NEVER skip directly to writing inline code without trying the script first.
Common Issues
| Error | Cause | Solution |
|---|---|---|
| HTTP 404 for protein | Invalid or unavailable antigen | Check case sensitivity ("TP53" not "tp53"). Histone marks not available. See references/target_genes_data_format.md. |
| Download timeout | Large file or slow connection | TP53 is ~13MB; allow up to 2 minutes. Try smaller TF first (e.g., MYC). |
| Memory error on large file | Very wide TSV (100s of columns) | Use top_n parameter to limit genes. Cell-type filter reduces columns. |
| No STRING data (all zeros) | Protein not in STRING database | Normal for less-studied TFs. Binding scores still valid without STRING. |
| Empty results after filtering | Filters too strict | Lower min_score, remove cell_type filter, increase top_n. |
| SVG export error | Missing optional dependency | Normal - generate_all_plots() handles fallback. PNG always created. |
Interpretation Guidelines
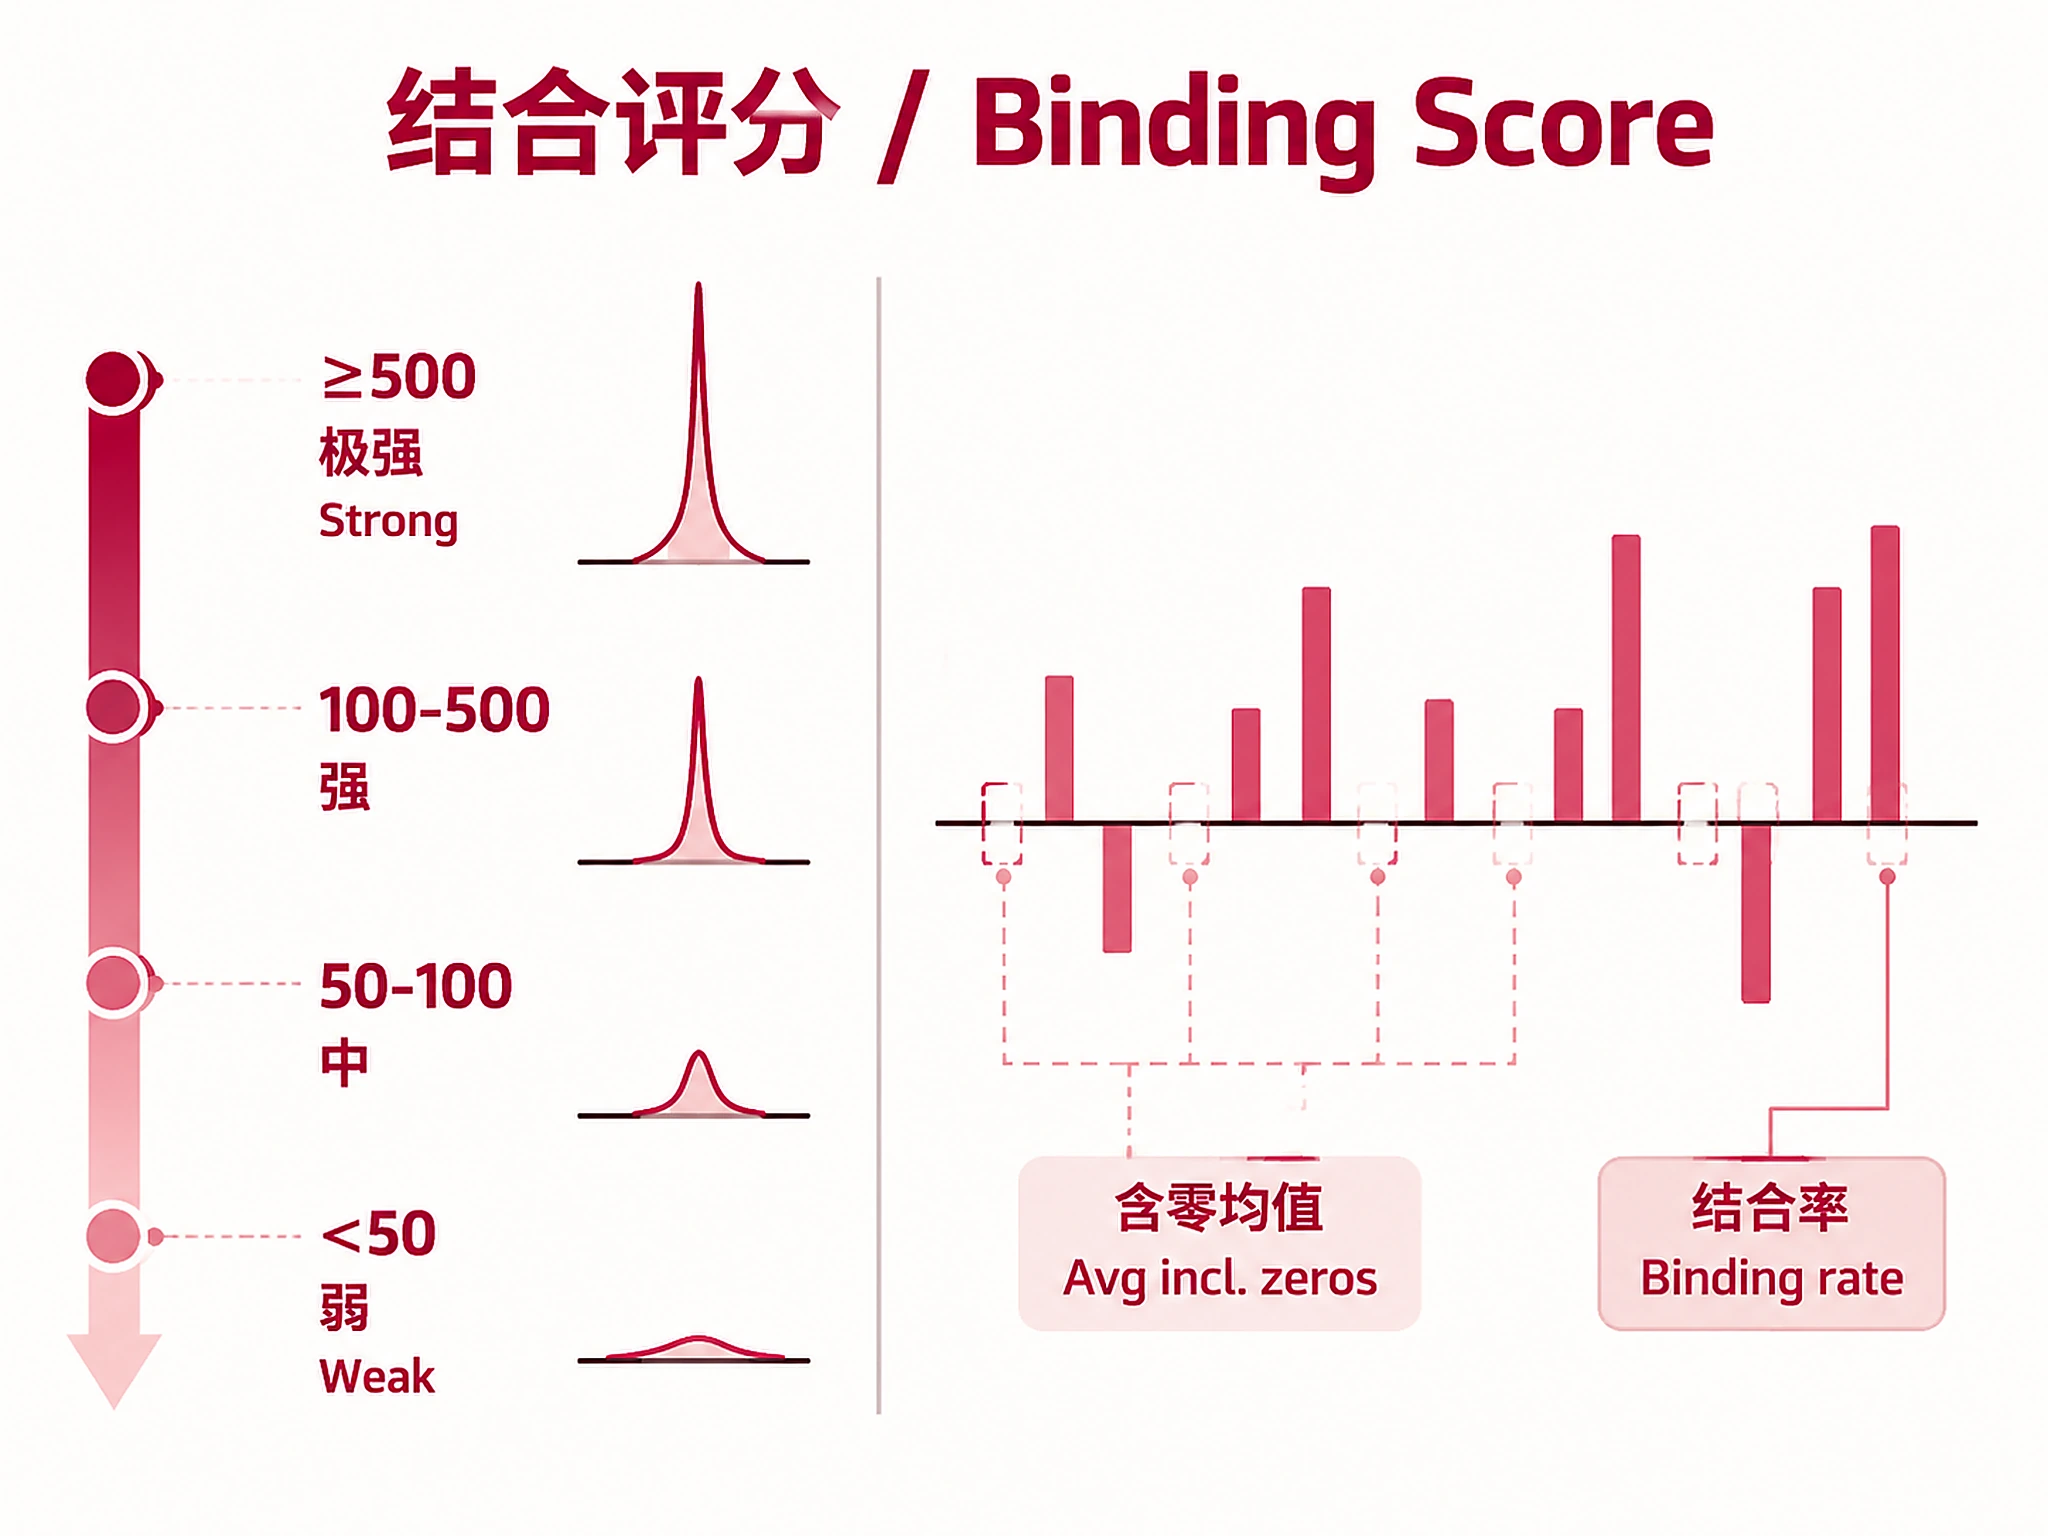
Average Binding Score (MACS2): −10 × log10(Q-value). Higher = stronger binding evidence.
- ≥500: Very strong binding (Q ≤ 1e-50) — high-confidence direct target
- 100-500: Strong binding — likely direct target
- 50-100: Moderate binding — possible target, may be cell-type-specific
- <50: Weak binding — marginal evidence
Note: The Q-value thresholds above apply to individual experiment scores. Average scores include zeros from non-binding experiments, so an average of 500 reflects a consensus level — not that every experiment shows Q ≤ 1e-50.
Binding Rate: Fraction of experiments with any binding, shown as % with n/N count (e.g., "66.3% (260/392)"). >50% = consistent across cell types; <10% = cell-type-specific.
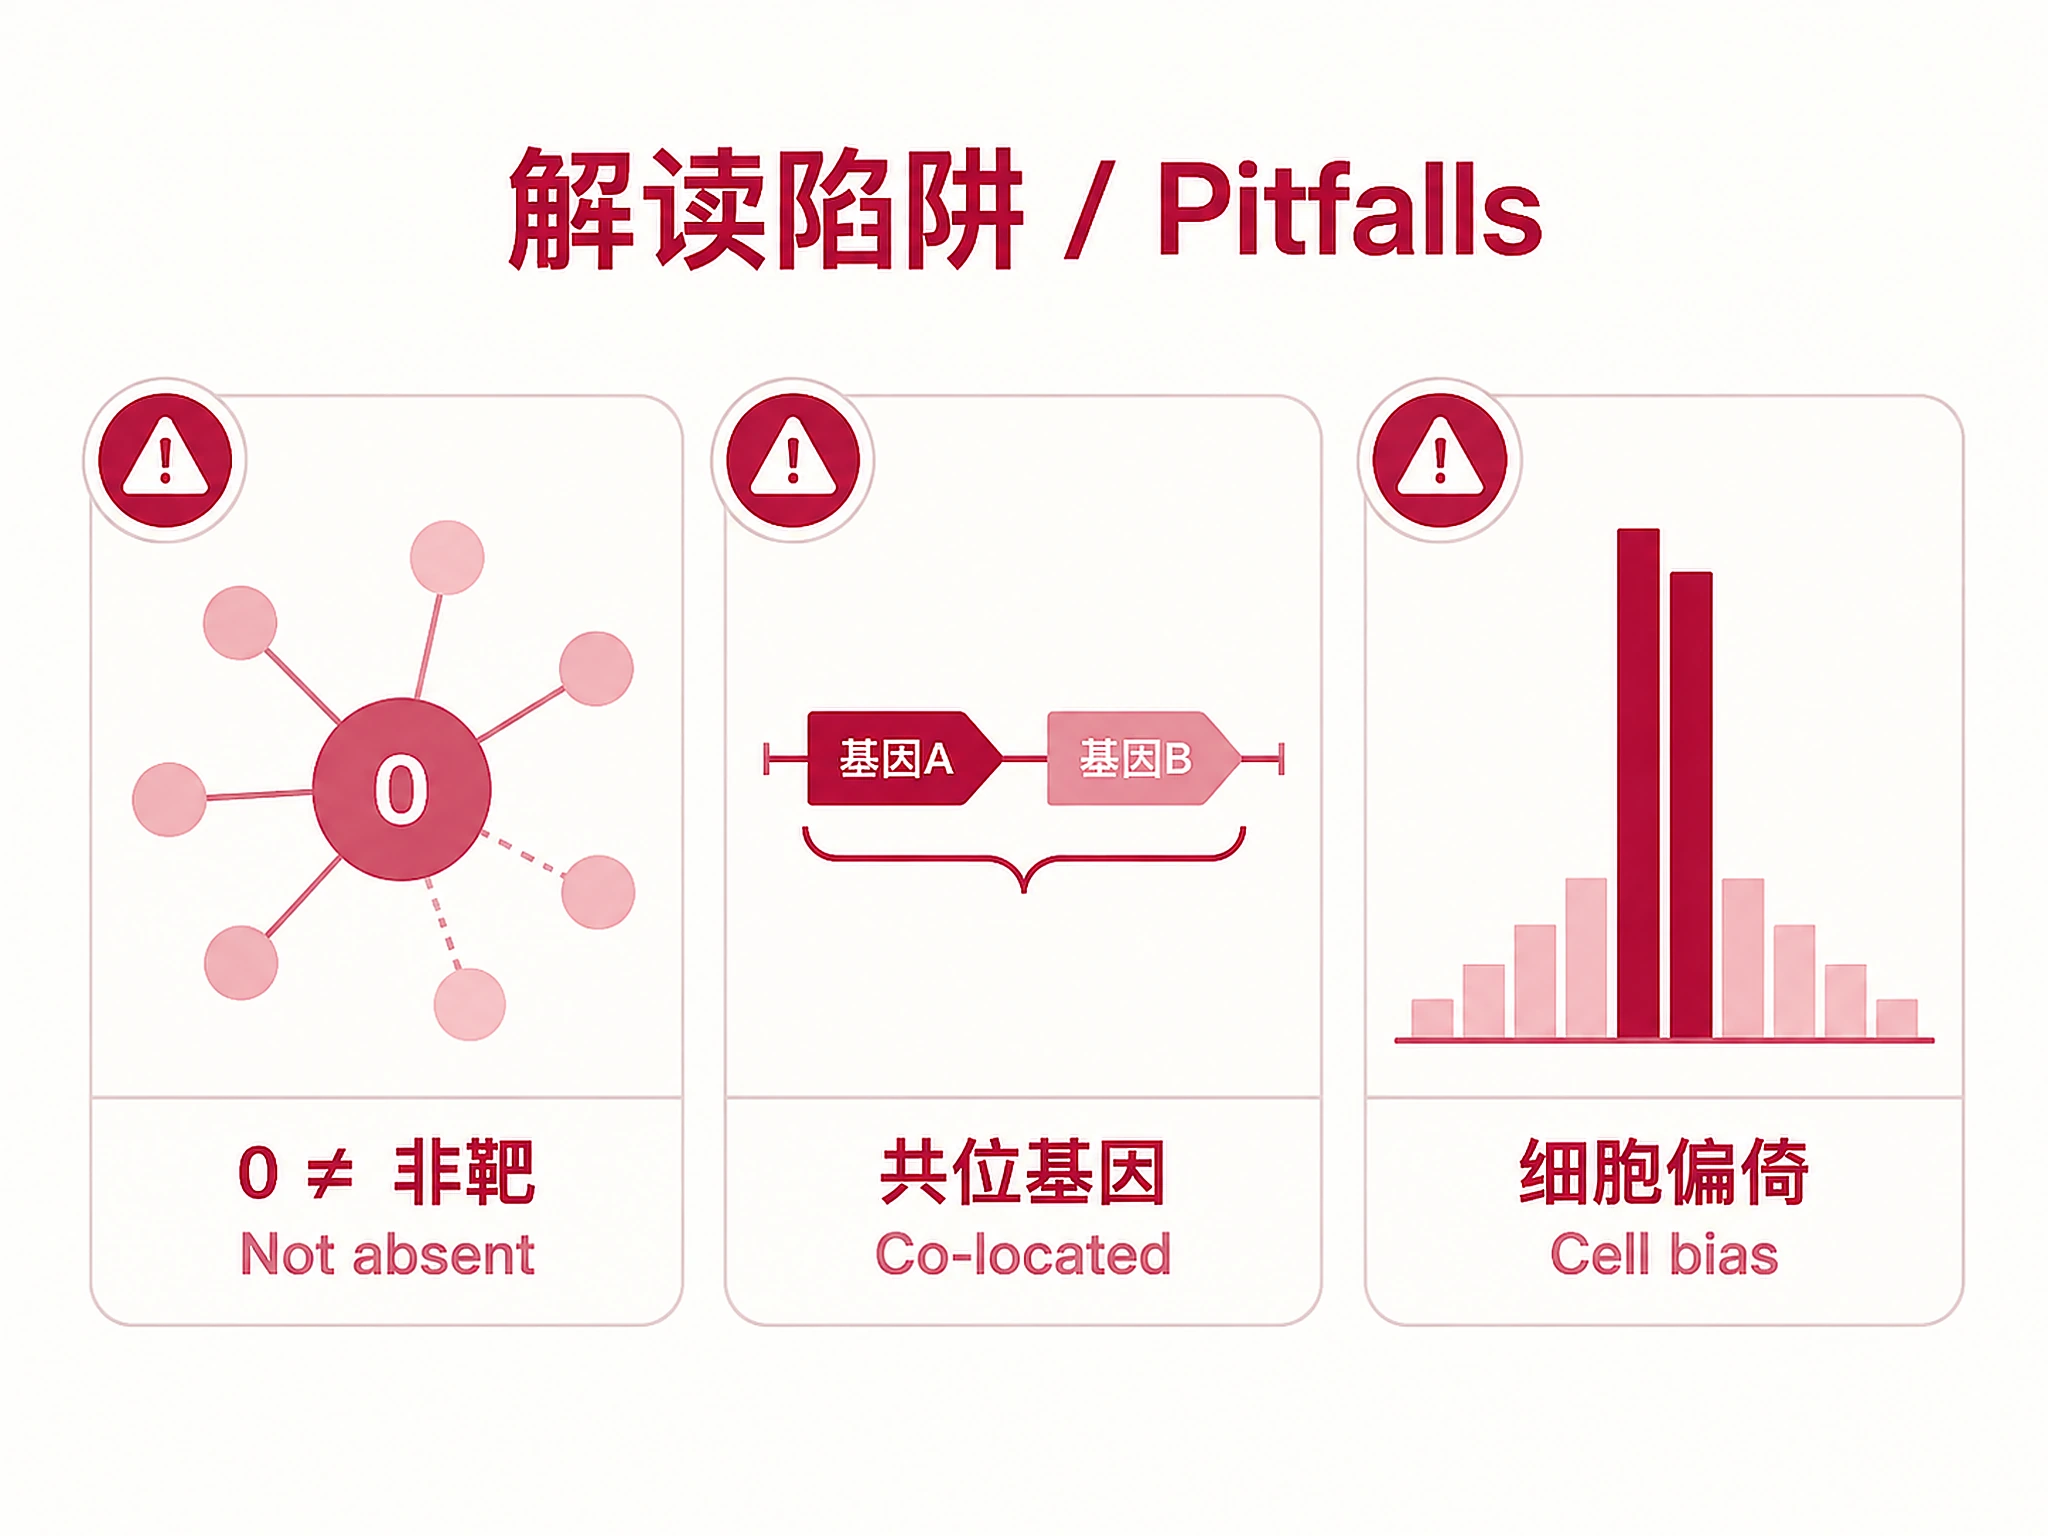
STRING Score: Independent evidence of regulatory interaction. >400 = medium confidence; >700 = high confidence. Genes with BOTH high binding + high STRING = highest-confidence targets. STRING score of 0 does NOT mean "not a target" — even well-characterized targets (e.g., BBC3/PUMA for TP53) can have STRING score 0 due to gaps in STRING coverage.
Caveats:
- Averaging includes zeros: Average scores are computed across ALL experiments (including those with score 0). Use
max_scoreandbinding_ratefor complementary views. - Cell-type bias: Experiments are unevenly distributed — a few well-studied cell lines dominate. See the "Experiment Composition" section in
summary_report.mdfor exact distribution. - Co-located genes: Some genes share identical binding scores because they sit at the same genomic locus within the TSS window. The
colocated_groupcolumn in the CSV flags these genes. For pathway enrichment, consider collapsing co-located groups to avoid double-counting loci. Seesummary_report.mdCaveats for exact counts. - External annotations: ChIP-Atlas provides binding data only. Any biological role descriptions in the agent's summary are from general knowledge, not from this analysis output. Always cite the actual data columns (avg_score, binding_rate, string_score) when reporting results.
Reporting Results
🚨 CRITICAL: Follow these rules when presenting results to the user.
- Rankings MUST come from the data files. Read
summary_report.mdortarget_genes_all.csvfor exact gene names, ranks, and scores. NEVER construct ranking tables from general biological knowledge — even if a gene is a well-known target, its rank must match the data. - Do NOT substitute biologically famous genes into top-N lists where the data ranks them lower. If a well-known target is not in the top 10, say so explicitly (e.g., "BAX, a well-characterized target, ranks #17 with avg_score 368.8").
- Use exact values from the CSV/report (1 decimal place for scores, 1 decimal for percentages). Do not round to integers.
- Cite the data source as: ChIP-Atlas (Zou et al., 2024) with the DOI from the References section.
- Mention co-located gene groups if the summary report flags them — they affect the effective number of independent targets.
- Label biological annotations: When describing gene functions or pathway roles, explicitly note these come from general knowledge (e.g., "CDKN1A — known cell cycle arrest effector — ranks #1"), not from ChIP-Atlas output.
Suggested Next Steps
- Run peak enrichment with top target genes to find co-regulatory factors (chip-atlas-peak-enrichment)
- Cell-type-specific analysis — re-run with
cell_typesfilter matching your experimental system - Gene regulatory network construction using top targets as nodes
- Functional enrichment of top target genes (GO, pathway analysis)
Related Skills
- chip-atlas-peak-enrichment - Find enriched TFs near YOUR gene list (reverse query)
- gene-correlation-archs4 - Co-expression across 600K RNA-seq samples
- grn-pyscenic - Gene regulatory networks from single-cell data
References
- Zou et al. (2024). ChIP-Atlas 3.0: a data-mining suite to explore chromosome architecture. Nucleic Acids Research. doi:10.1093/nar/gkad884
- Zou et al. (2022). ChIP-Atlas 2021 update. Nucleic Acids Research. doi:10.1093/nar/gkab933
- Oki et al. (2018). ChIP-Atlas: a data-mining suite. EMBO Reports 19(12):e46255. doi:10.15252/embr.201846255
- ChIP-Atlas: https://chip-atlas.org
- Target Genes documentation: See references/target_genes_data_format.md
- MACS2 binding scores: See references/macs2_binding_scores.md
- STRING integration: See references/string_scores.md
Code preview
scripts/download_target_genes.py
"""
Download and parse ChIP-Atlas Target Genes pre-computed TSV data.

Core script for the chip-atlas-target-genes skill.
Downloads wide-format TSV from ChIP-Atlas and parses into summary + experiment DataFrames.
"""

import io
import re

import pandas as pd
import requests

# ChIP-Atlas data server base URL
BASE_URL = "https://chip-atlas.dbcls.jp/data"

# Valid genomes
VALID_GENOMES = ["hg38", "hg19", "mm10", "mm9", "rn6", "dm6", "dm3", "ce11", "ce10", "sacCer3"]

# Valid distance values (kb from TSS)
VALID_DISTANCES = [1, 5, 10]


def _build_url(protein, genome, distance):
    """Build the download URL for target genes TSV."""
    return f"{BASE_URL}/{genome}/target/{protein}.{distance}.tsv"


def check_antigen_available(protein, genome="hg38", distance=5):
    """
    Check if target gene data exists for a given protein/antigen.

    Args:
        protein: Protein/TF name (case-sensitive, e.g., "TP53")
        genome: Genome assembly (default: "hg38")
        distance: Distance from TSS in kb (1, 5, or 10)

    Returns:
        bool: True if data is available, False otherwise
    """
    if genome not in VALID_GENOMES:
        print(f"  ERROR: Invalid genome '{genome}'. Valid: {', '.join(VALID_GENOMES)}")
        return False

    if distance not in VALID_DISTANCES:
        print(f"  ERROR: Invalid distance {distance}. Valid: {VALID_DISTANCES}")
        return False

    url = _build_url(protein, genome, distance)

    try:
        resp = requests.head(url, timeout=15, allow_redirects=True)
        if resp.status_code == 200:
            return True
        elif resp.status_code == 404:
            # Provide helpful suggestions
            print(f"  WARNING: No target gene data for '{protein}' ({genome}, ±{distance}kb)")
            print(f"  - Protein names are case-sensitive (e.g., 'TP53' not 'tp53')")
            print(f"  - Histone marks (H3K4me3, etc.) are NOT available in Target Genes")
            print(f"  - Check https://chip-atlas.org/target_genes for available antigens")
            return False
        else:
            print(f"  WARNING: Unexpected HTTP {resp.status_code} for {url}")
            return False
    except requests.RequestException as e:
        print(f"  ERROR: Network error checking antigen availability: {e}")
        return False


def download_target_genes(protein, genome="hg38", distance=5):
    """
    Download and parse ChIP-Atlas target genes TSV data.

    Args:
        protein: Protein/TF name (case-sensitive, e.g., "TP53")
        genome: Genome assembly (default: "hg38")
        distance: Distance from TSS in kb (1, 5, or 10)

    Returns:
        tuple: (summary_df, experiment_df)
scripts/export_all.py
"""
Export results for ChIP-Atlas Target Genes analysis.

Saves analysis object (pickle), CSV files, and markdown summary report.
"""

import os
import pickle
from datetime import datetime


def export_all(results, output_dir="target_genes_results"):
    """
    Export all target genes results to files.

    Args:
        results: Results dict from run_target_genes_workflow()
        output_dir: Output directory (default: "target_genes_results")

    Exports:
        - analysis_object.pkl (complete results for downstream skills)
        - target_genes_all.csv (all target genes with summary scores)
        - target_genes_top50.csv (top 50 by average score)
        - target_genes_with_string.csv (genes with STRING score > 0, conditional)
        - experiment_scores_top50.csv (wide-format per-experiment for top 50)
        - summary_report.md (human-readable report)
    """
    os.makedirs(output_dir, exist_ok=True)

    target_genes = results["target_genes"]
    experiment_data = results["experiment_data"]
    protein = results["protein"]
    metadata = results["metadata"]
    parameters = results["parameters"]

    print(f"\n  Exporting results to: {output_dir}/")

    # 1. Analysis object (pickle)
    pkl_path = os.path.join(output_dir, "analysis_object.pkl")
    export_data = {
        "target_genes": target_genes,
        "experiment_data": experiment_data,
        "cell_types": results["cell_types"],
        "protein": protein,
        "parameters": parameters,
        "metadata": metadata,
        "exported_at": datetime.now().isoformat(),
    }
    with open(pkl_path, "wb") as f:
        pickle.dump(export_data, f)
    print(f"    Saved: analysis_object.pkl")
    print(f"    (Load with: import pickle; obj = pickle.load(open('{pkl_path}', 'rb')))")

    # 2. All target genes CSV
    all_csv_path = os.path.join(output_dir, "target_genes_all.csv")
    target_genes.to_csv(all_csv_path, index=False)
    print(f"    Saved: target_genes_all.csv ({len(target_genes)} genes)")

    # 3. Top 50 target genes CSV
    top50 = target_genes.head(50)
    top50_path = os.path.join(output_dir, "target_genes_top50.csv")
    top50.to_csv(top50_path, index=False)
    print(f"    Saved: target_genes_top50.csv ({len(top50)} genes)")

    # 4. Genes with STRING interactions (conditional)
    with_string = target_genes[target_genes["string_score"] > 0]
    if len(with_string) > 0:
        string_path = os.path.join(output_dir, "target_genes_with_string.csv")
        with_string.to_csv(string_path, index=False)
        print(f"    Saved: target_genes_with_string.csv ({len(with_string)} genes)")

    # 5. Wide-format experiment scores for top 50 genes
    if experiment_data is not None:
        top50_genes = top50["gene"].tolist()
        exp_top50 = experiment_data[experiment_data["gene"].isin(top50_genes)]
        exp_path = os.path.join(output_dir, "experiment_scores_top50.csv")
        exp_top50.to_csv(exp_path, index=False)
        print(f"    Saved: experiment_scores_top50.csv ({len(exp_top50)} genes)")

    # 6. Summary report
scripts/filter_targets.py
"""
Post-download filtering for ChIP-Atlas Target Genes results.

Filters target genes by binding score, cell type, STRING score, and more.
"""

import numpy as np
import pandas as pd


def filter_targets(
    target_genes_df,
    experiment_df=None,
    min_avg_score=0,
    cell_types=None,
    min_string_score=0,
    top_n=None,
    min_binding_rate=0,
):
    """
    Filter target genes by various criteria.

    Args:
        target_genes_df: Summary DataFrame (gene, avg_score, string_score, etc.)
        experiment_df: Wide-format per-experiment DataFrame (optional, needed for cell_type filter)
        min_avg_score: Minimum average MACS2 binding score (default: 0)
        cell_types: List of cell types to subset (recalculates average from those experiments only)
        min_string_score: Minimum STRING interaction score (default: 0)
        top_n: Keep only top N genes by average score (default: None = all)
        min_binding_rate: Minimum fraction of experiments with binding (0-1, default: 0)

    Returns:
        tuple: (filtered_target_genes_df, filtered_experiment_df or None)
    """
    initial_count = len(target_genes_df)
    df = target_genes_df.copy()
    exp_df = experiment_df.copy() if experiment_df is not None else None

    # Cell-type filtering (must come first — recalculates avg_score)
    if cell_types and exp_df is not None:
        df, exp_df = _filter_by_cell_type(df, exp_df, cell_types)

    # Score filters
    if min_avg_score > 0:
        df = df[df["avg_score"] >= min_avg_score]

    if min_string_score > 0:
        df = df[df["string_score"] >= min_string_score]

    if min_binding_rate > 0:
        df = df[df["binding_rate"] >= min_binding_rate]

    # Top N (applied last, after other filters)
    if top_n is not None and top_n > 0:
        df = df.head(top_n)

    # Sync experiment_df to match filtered genes
    if exp_df is not None:
        exp_df = exp_df[exp_df["gene"].isin(df["gene"])]

    df = df.reset_index(drop=True)
    if exp_df is not None:
        exp_df = exp_df.reset_index(drop=True)

    print(f"  ✓ Filtered: {initial_count} → {len(df)} target genes")
    return df, exp_df


def _filter_by_cell_type(target_genes_df, experiment_df, cell_types):
    """
    Filter to specific cell types and recalculate average scores.

    Args:
        target_genes_df: Summary DataFrame
        experiment_df: Wide-format experiment DataFrame
        cell_types: List of cell type names to keep (case-insensitive)

    Returns:
        tuple: (updated_target_genes_df, filtered_experiment_df)
    """
Companion files
| Type | Path | Bytes |
|---|---|---|
| JSON | _unavailable_files.json | 269 |
| Markdown | references/macs2_binding_scores.md | 3,417 |
| Markdown | references/string_scores.md | 2,307 |
| Markdown | references/target_genes_data_format.md | 2,486 |
| Python | scripts/download_target_genes.py | 7,007 |
| Python | scripts/export_all.py | 19,053 |
| Python | scripts/filter_targets.py | 7,506 |
| Python | scripts/generate_all_plots.py | 11,853 |
| Python | scripts/load_example_query.py | 2,102 |
| Python | scripts/load_user_query.py | 1,628 |
| Python | scripts/run_target_genes_workflow.py | 4,716 |
| Markdown | SKILL.md | 12,755 |
| JSON | skill.meta.json | 2,477 |