MS Differential Proteins
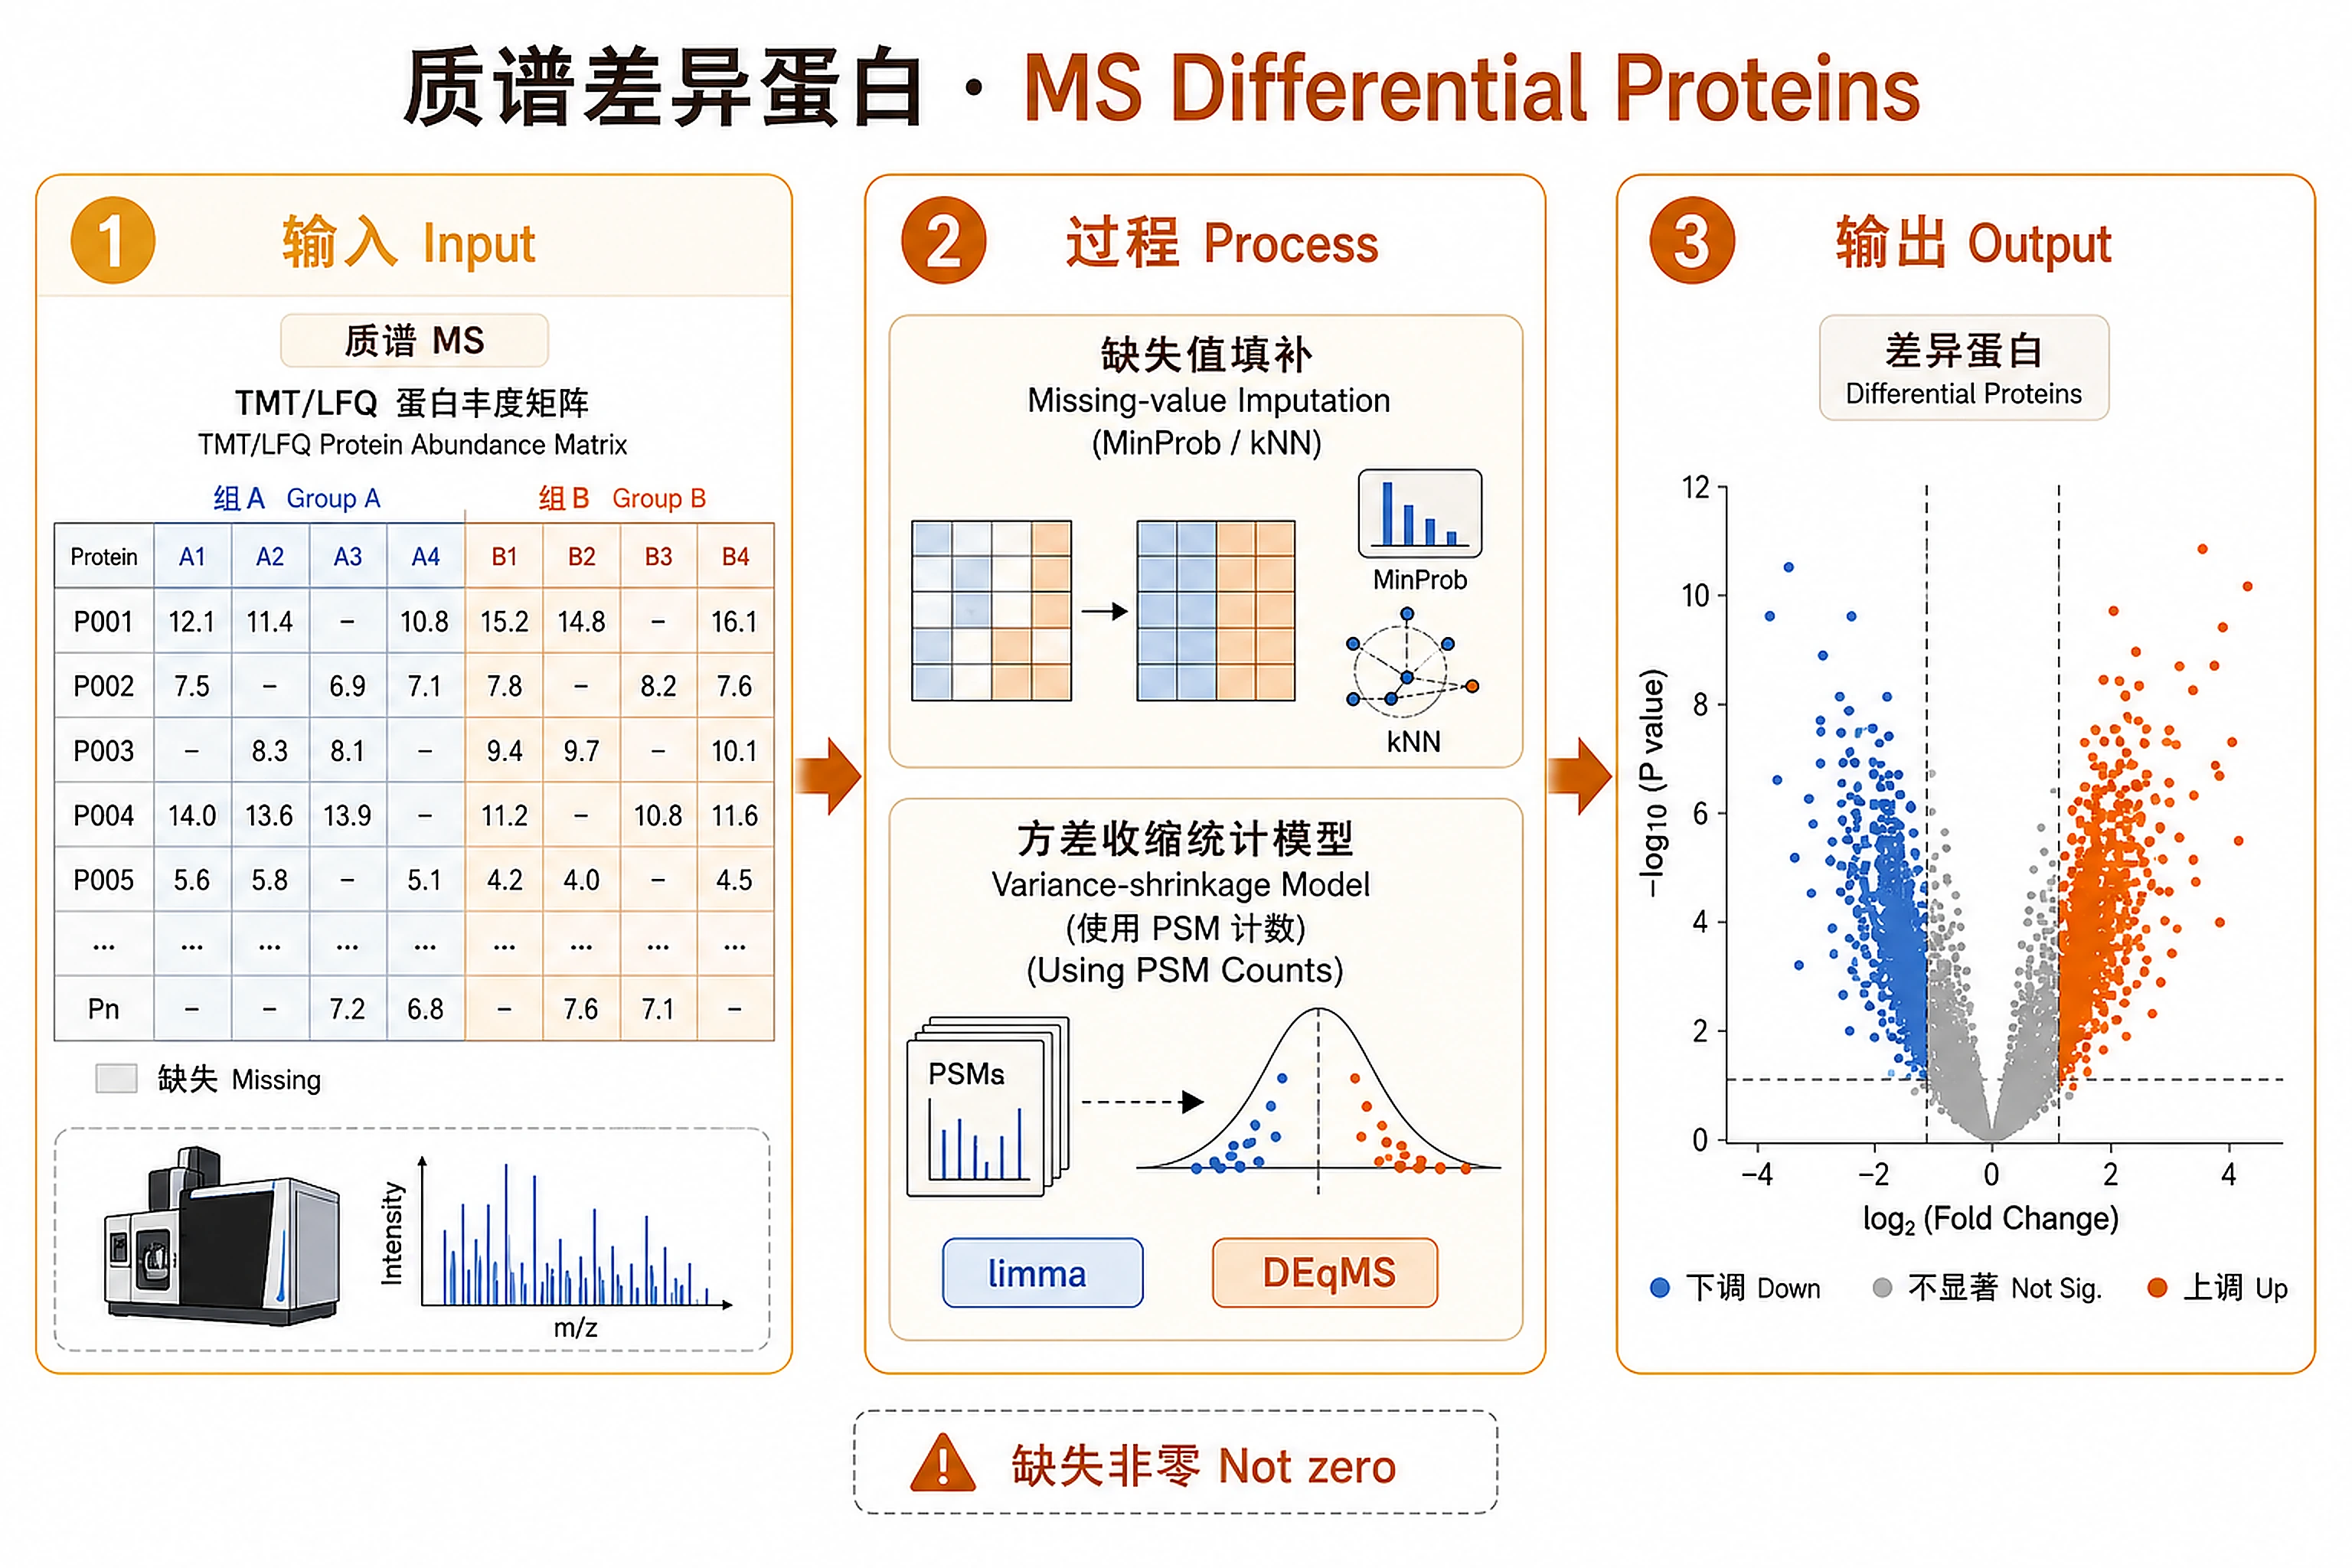
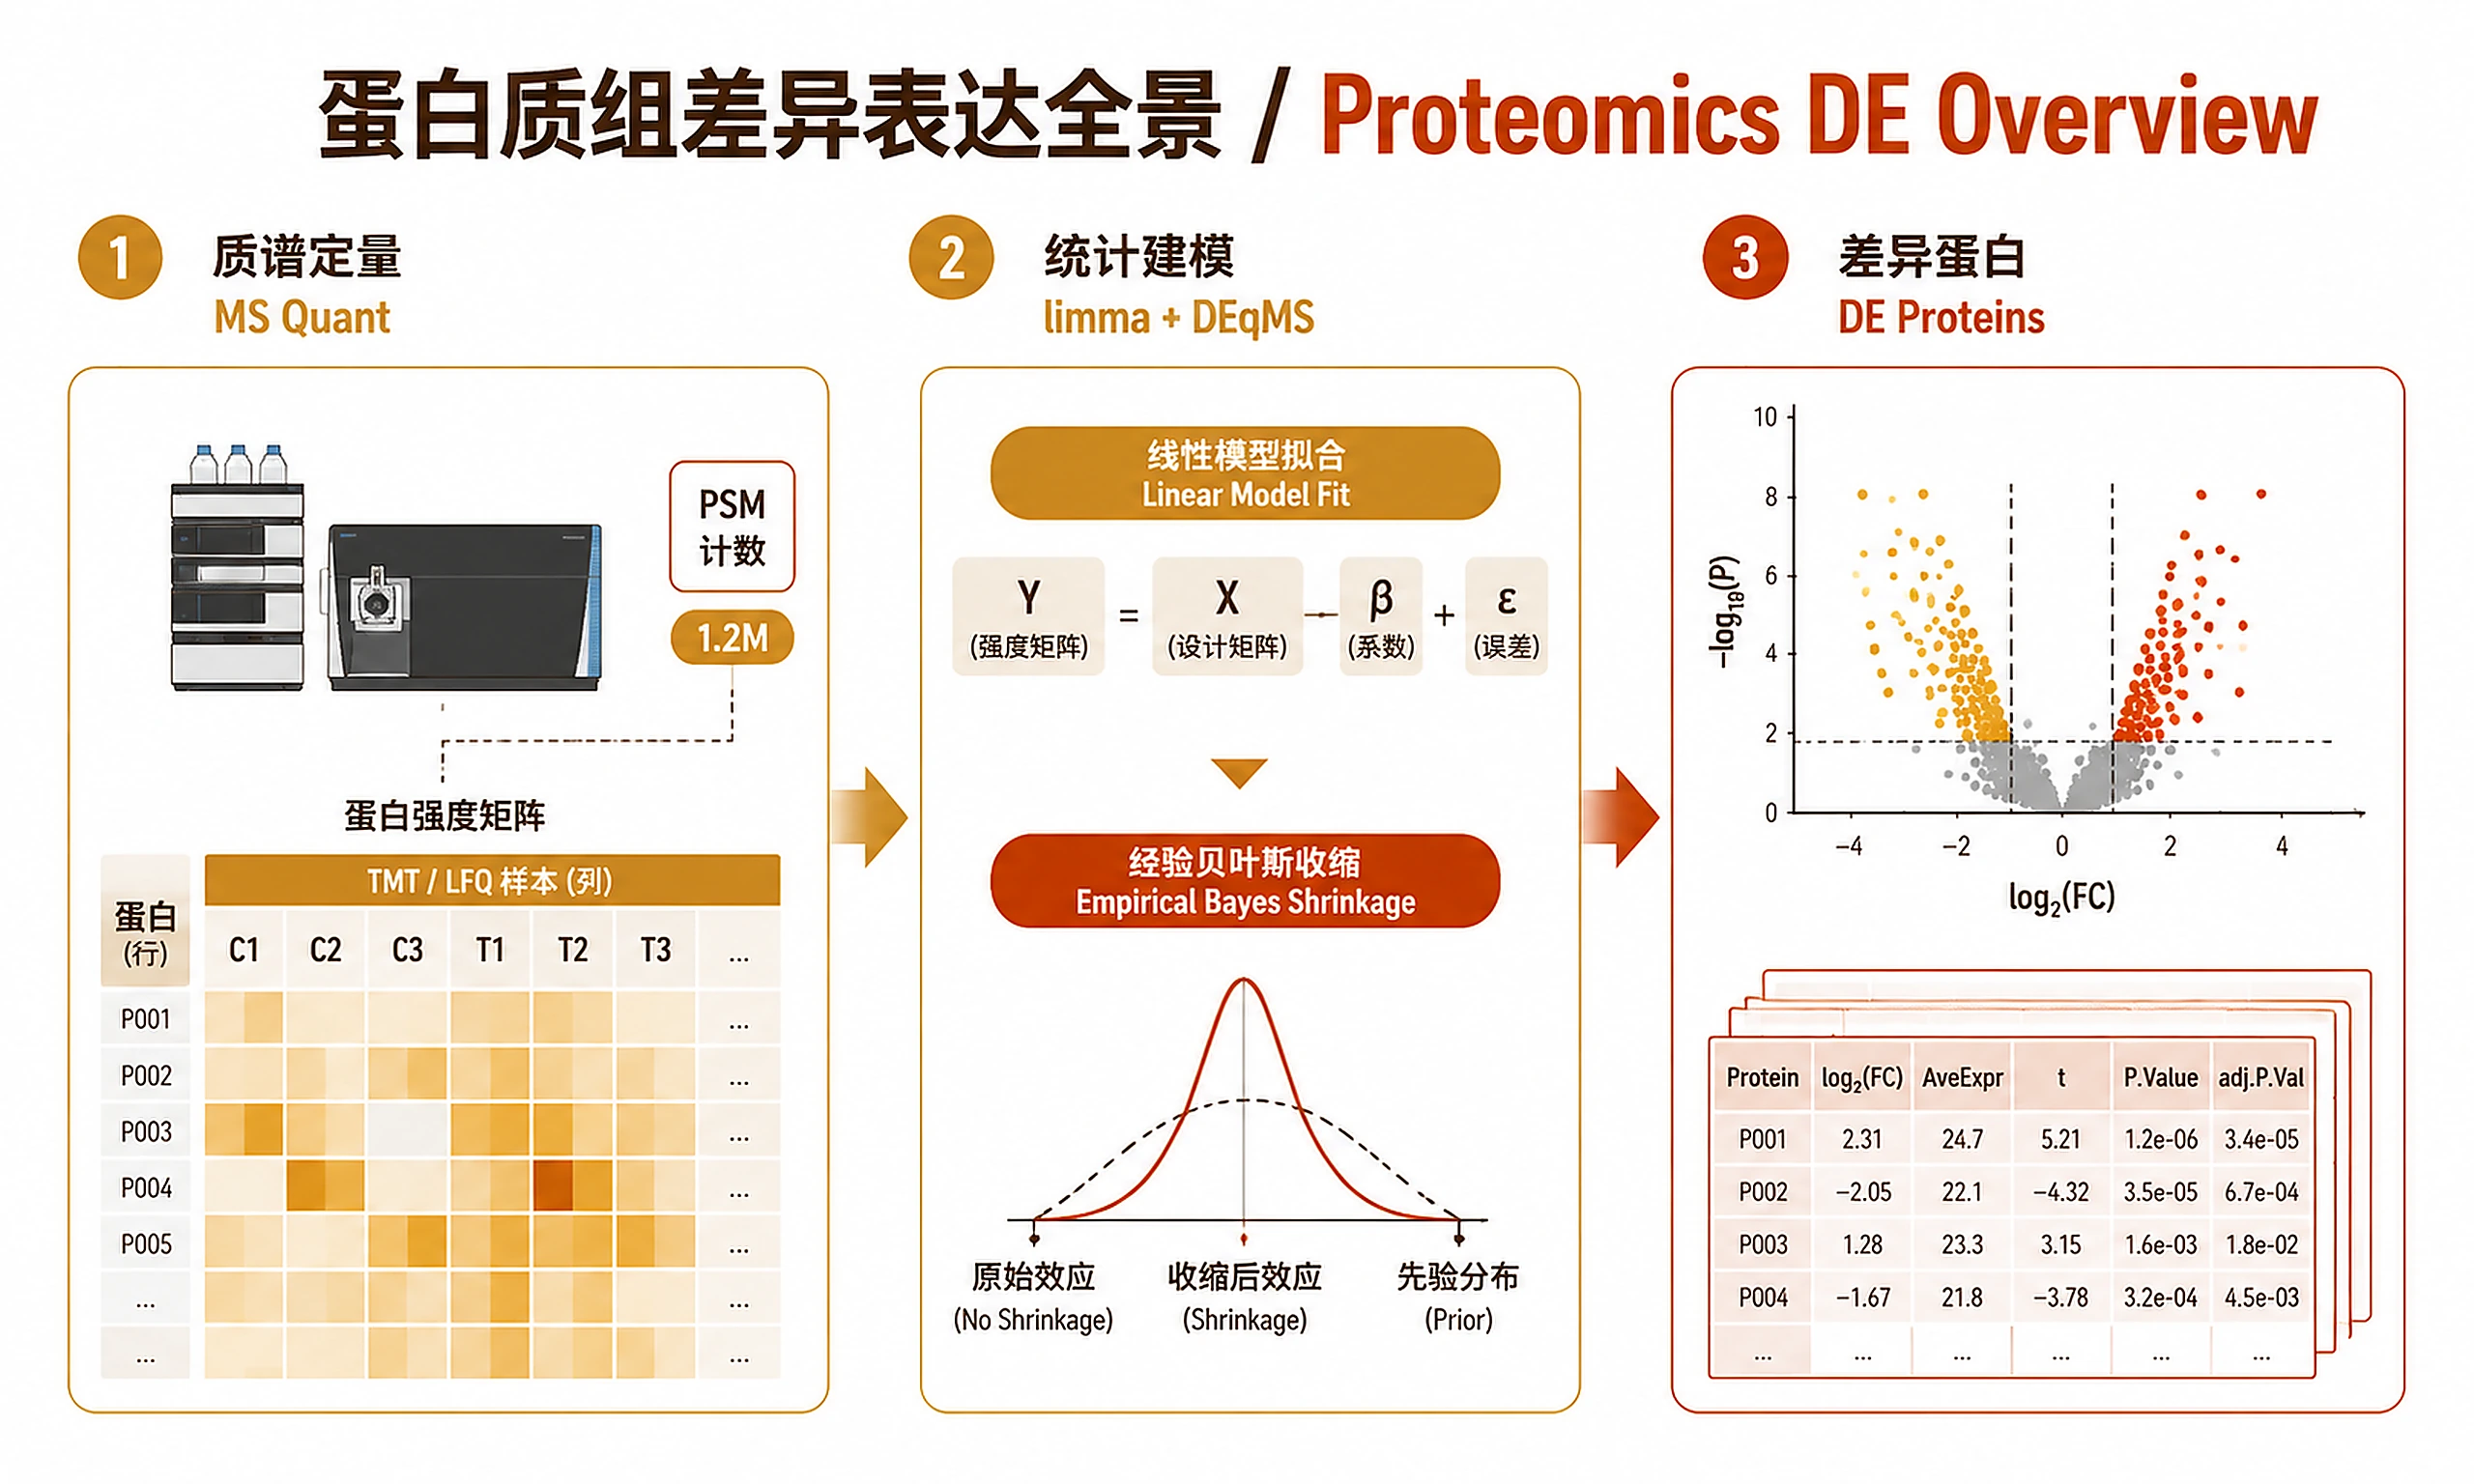
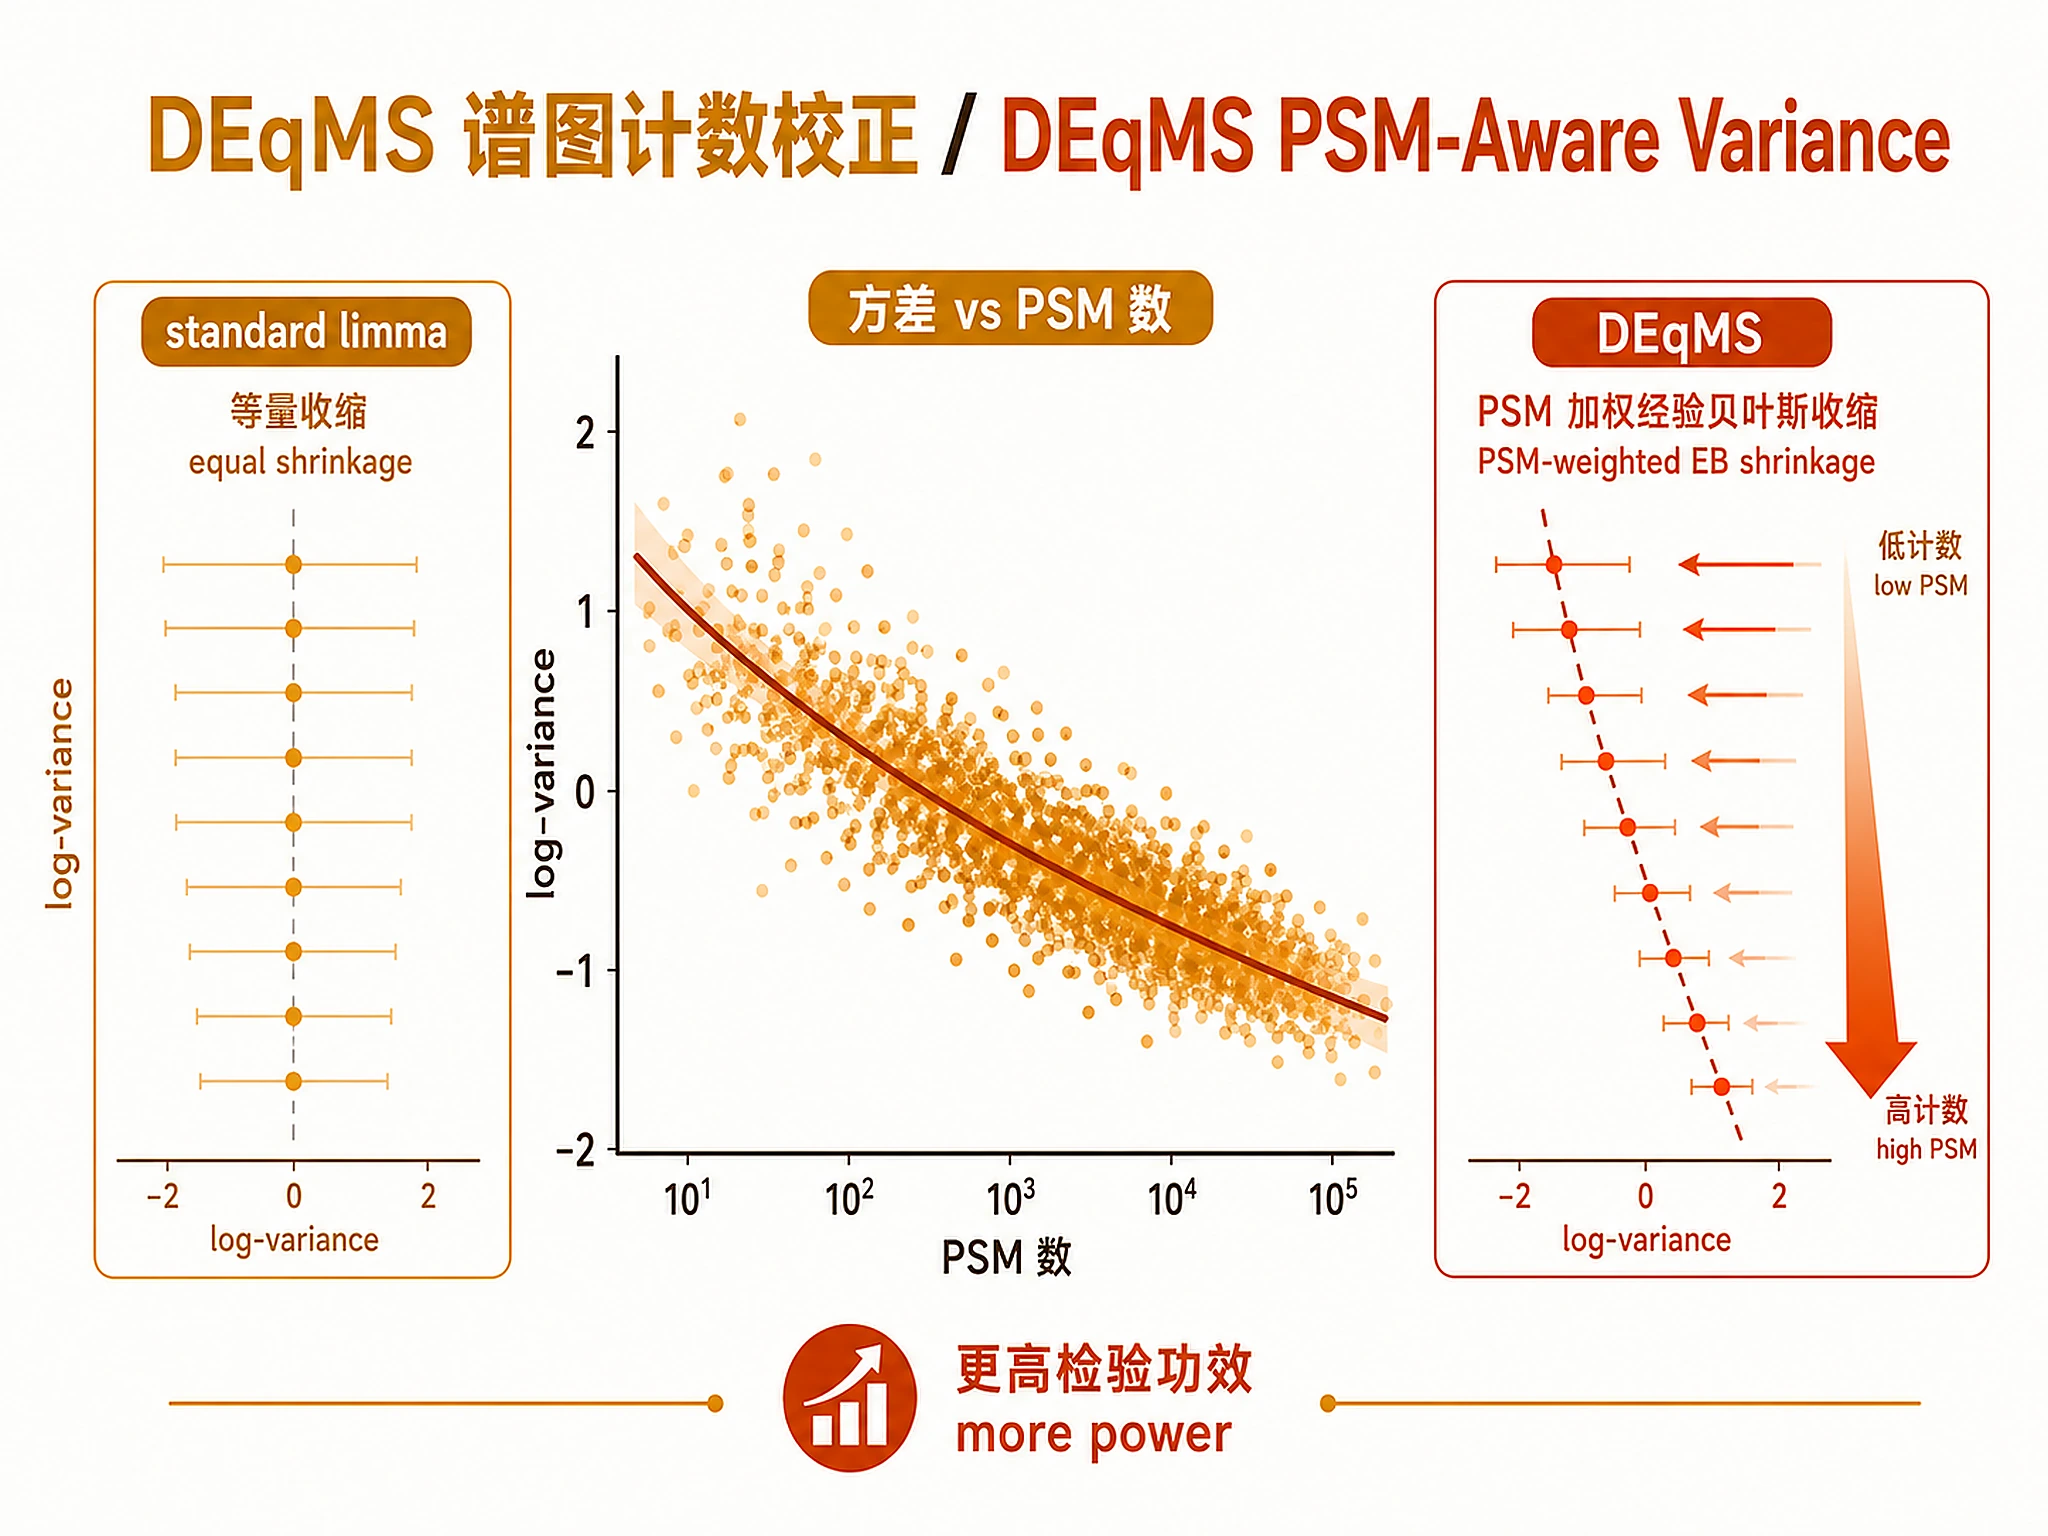
MS differential expression with PSM-aware variance (limma + DEqMS).
Overview
Problem. Find differential proteins between groups — proteomics' DESeq2.
Learning goals
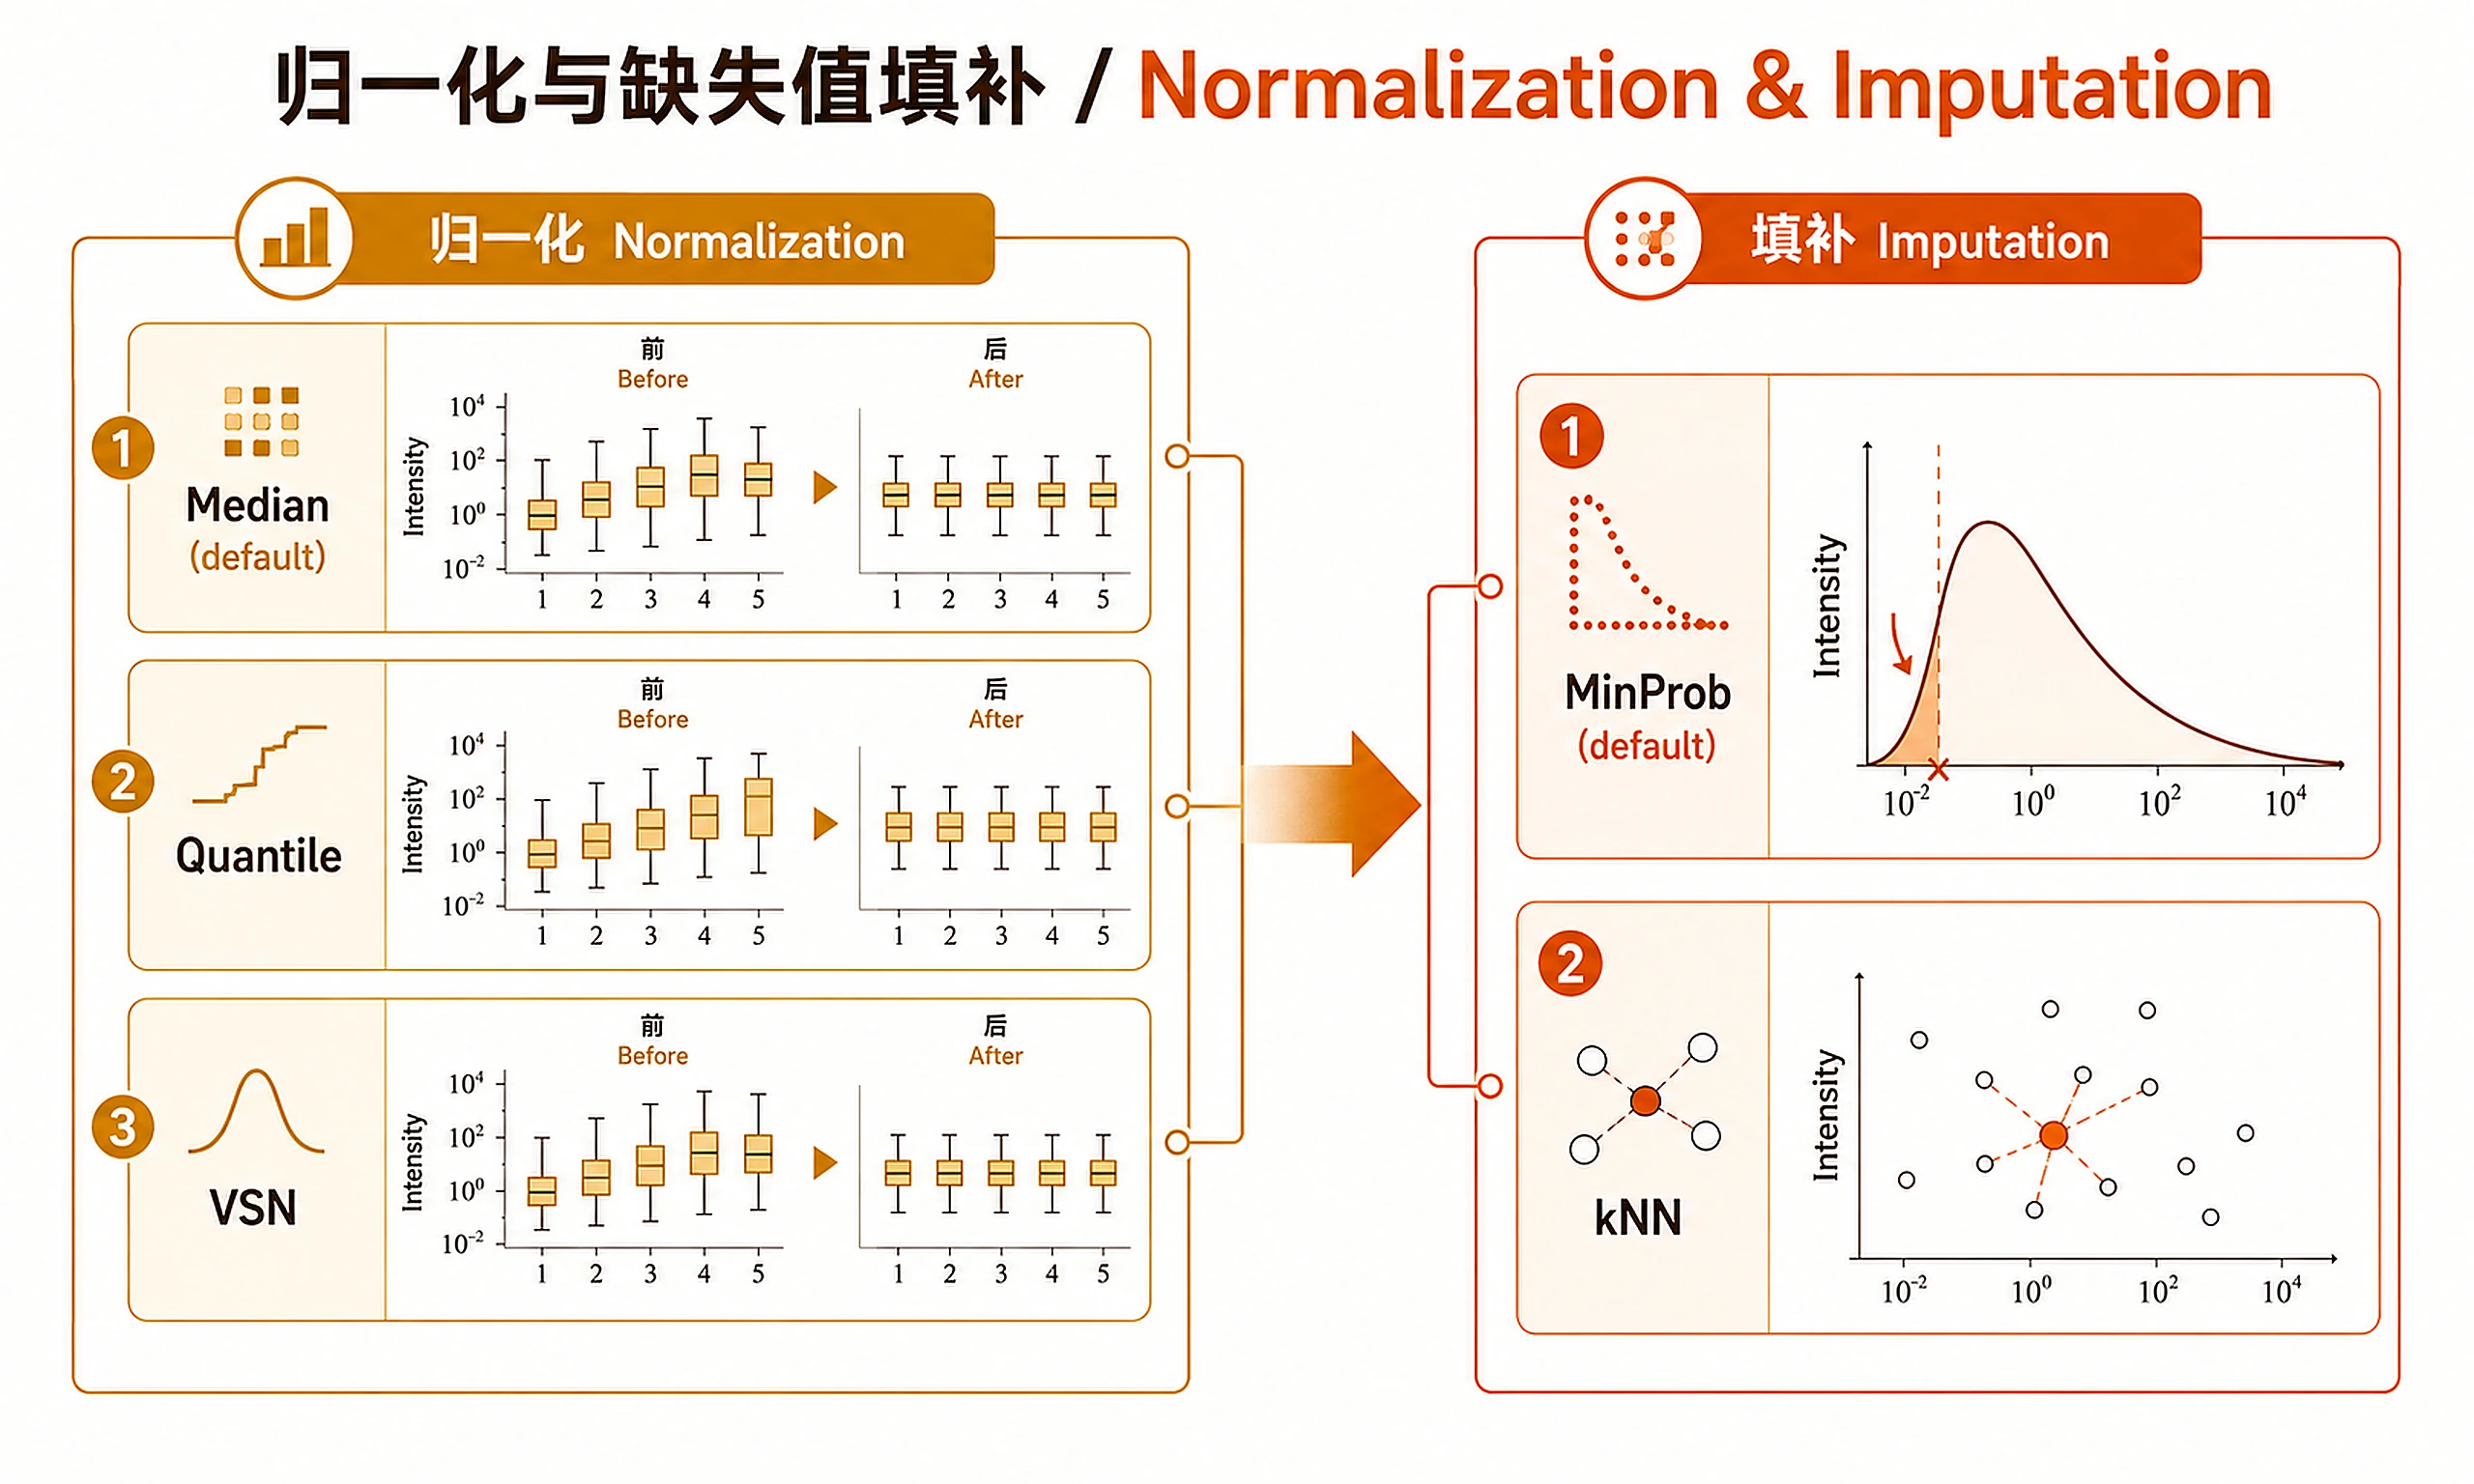
- MS missingness is structural, not zero
- The DE framework transfers across omics
Figures
Tutorial
Differential protein expression analysis for TMT/LFQ mass spectrometry proteomics data using limma linear models with DEqMS PSM-count-aware variance correction.
When to Use This Skill
Use this skill when you have:
- ✅ Protein quantification data from TMT or LFQ mass spectrometry
- ✅ PSM/peptide counts per protein (for DEqMS variance correction)
- ✅ Biological replicates (≥2 per condition, ≥3 recommended)
- ✅ Need for PSM-aware statistical testing (improved power over standard limma)
Don't use this skill for:
- ❌ RNA-seq data → use bulk-rnaseq-counts-to-de-deseq2
- ❌ Metabolomics data → different normalization/statistics needed
- ❌ Pre-computed fold changes without raw intensities
Quick Start (Example Data)
Test this skill with real TMT proteomics data in ~2 minutes:
source("scripts/load_example_data.R")
data <- load_example_data()    # Auto-downloads A431 TMT 10-plex data (~30s)
psm_data <- data$psm_data      # 316,726 PSMs × 10 TMT channels
metadata <- data$metadata       # 4 conditions: ctrl, miR191, miR372, miR519

# Run complete workflow
source("scripts/basic_workflow.R")  # Creates fit_deqms, deqms_results + prints summary
What you get:
- Dataset: A431 human epidermoid carcinoma cells treated with miRNAs (TMT 10-plex)
- Comparison: miR372 vs ctrl (3 vs 3 replicates)
- Expected results: ~9,000 proteins quantified, significant DE proteins at adj.p < 0.05
For your own data: Replace data loading with your protein intensity matrix and metadata (see Inputs section).
Installation
Core packages (required):
options(repos = c(CRAN = "https://cloud.r-project.org"))
if (!require('BiocManager', quietly = TRUE)) install.packages('BiocManager')
BiocManager::install(c('limma', 'DEqMS', 'ExperimentHub'))
Visualization packages (required):
install.packages(c('ggplot2', 'ggprism', 'ggrepel', 'circlize', 'matrixStats'))
BiocManager::install('ComplexHeatmap')
Optional packages:
install.packages(c('rmarkdown', 'knitr'))        # PDF report
BiocManager::install(c('impute', 'vsn'))          # kNN imputation, VSN normalization
| Software | Version | License | Commercial Use | Installation |
|---|---|---|---|---|
| limma | ≥3.50.0 | GPL (≥2) | ✅ Permitted | BiocManager::install('limma') |
| DEqMS | ≥1.12.0 | LGPL | ✅ Permitted | BiocManager::install('DEqMS') |
| ExperimentHub | ≥2.0.0 | Artistic-2.0 | ✅ Permitted | BiocManager::install('ExperimentHub') |
| ggplot2 | ≥3.4.0 | MIT | ✅ Permitted | install.packages('ggplot2') |
| ggprism | ≥1.0.3 | GPL (≥3) | ✅ Permitted | install.packages('ggprism') |
| ggrepel | ≥0.9.0 | GPL-3 | ✅ Permitted | install.packages('ggrepel') |
| ComplexHeatmap | ≥2.10.0 | MIT | ✅ Permitted | BiocManager::install('ComplexHeatmap') |
| circlize | ≥0.4.15 | MIT | ✅ Permitted | install.packages('circlize') |
| matrixStats | ≥0.60.0 | Artistic-2.0 | ✅ Permitted | install.packages('matrixStats') |
| rmarkdown | ≥2.20 | GPL-3 | ✅ Permitted | Optional |
Note: Scripts automatically generate both PNG and SVG formats. SVG export uses base R svg() device (always available) or svglite if installed. No additional setup needed.
Inputs
Required:
- Protein intensity matrix: Rows = proteins, Columns = samples
- PSM-level table with gene/protein column (recommended — enables medianSweeping aggregation)
- OR protein-level intensities (log2 or raw)
- Sample metadata: data.frame with
conditioncolumn
Optional but recommended:
- PSM/peptide counts per protein (critical for DEqMS variance correction)
Supported formats: MaxQuant proteinGroups.txt, Proteome Discoverer export, generic CSV/TSV
Outputs
Result tables (CSV):
all_results.csv— Full DEqMS results (logFC, sca.P.Value, sca.adj.pval, count)significant_results.csv— Filtered by adjusted p-value and fold changenormalized_protein_matrix.csv— Log2 normalized protein intensitiespsm_counts.csv— PSM counts per proteintop100_proteins.csv— Top 100 by DEqMS adjusted p-value
Analysis objects (RDS):
analysis_object.rds— Complete analysis object for downstream skills- Load with:
obj <- readRDS('results/analysis_object.rds') - Contains: fit_deqms, deqms_results, protein_matrix, metadata, psm_counts
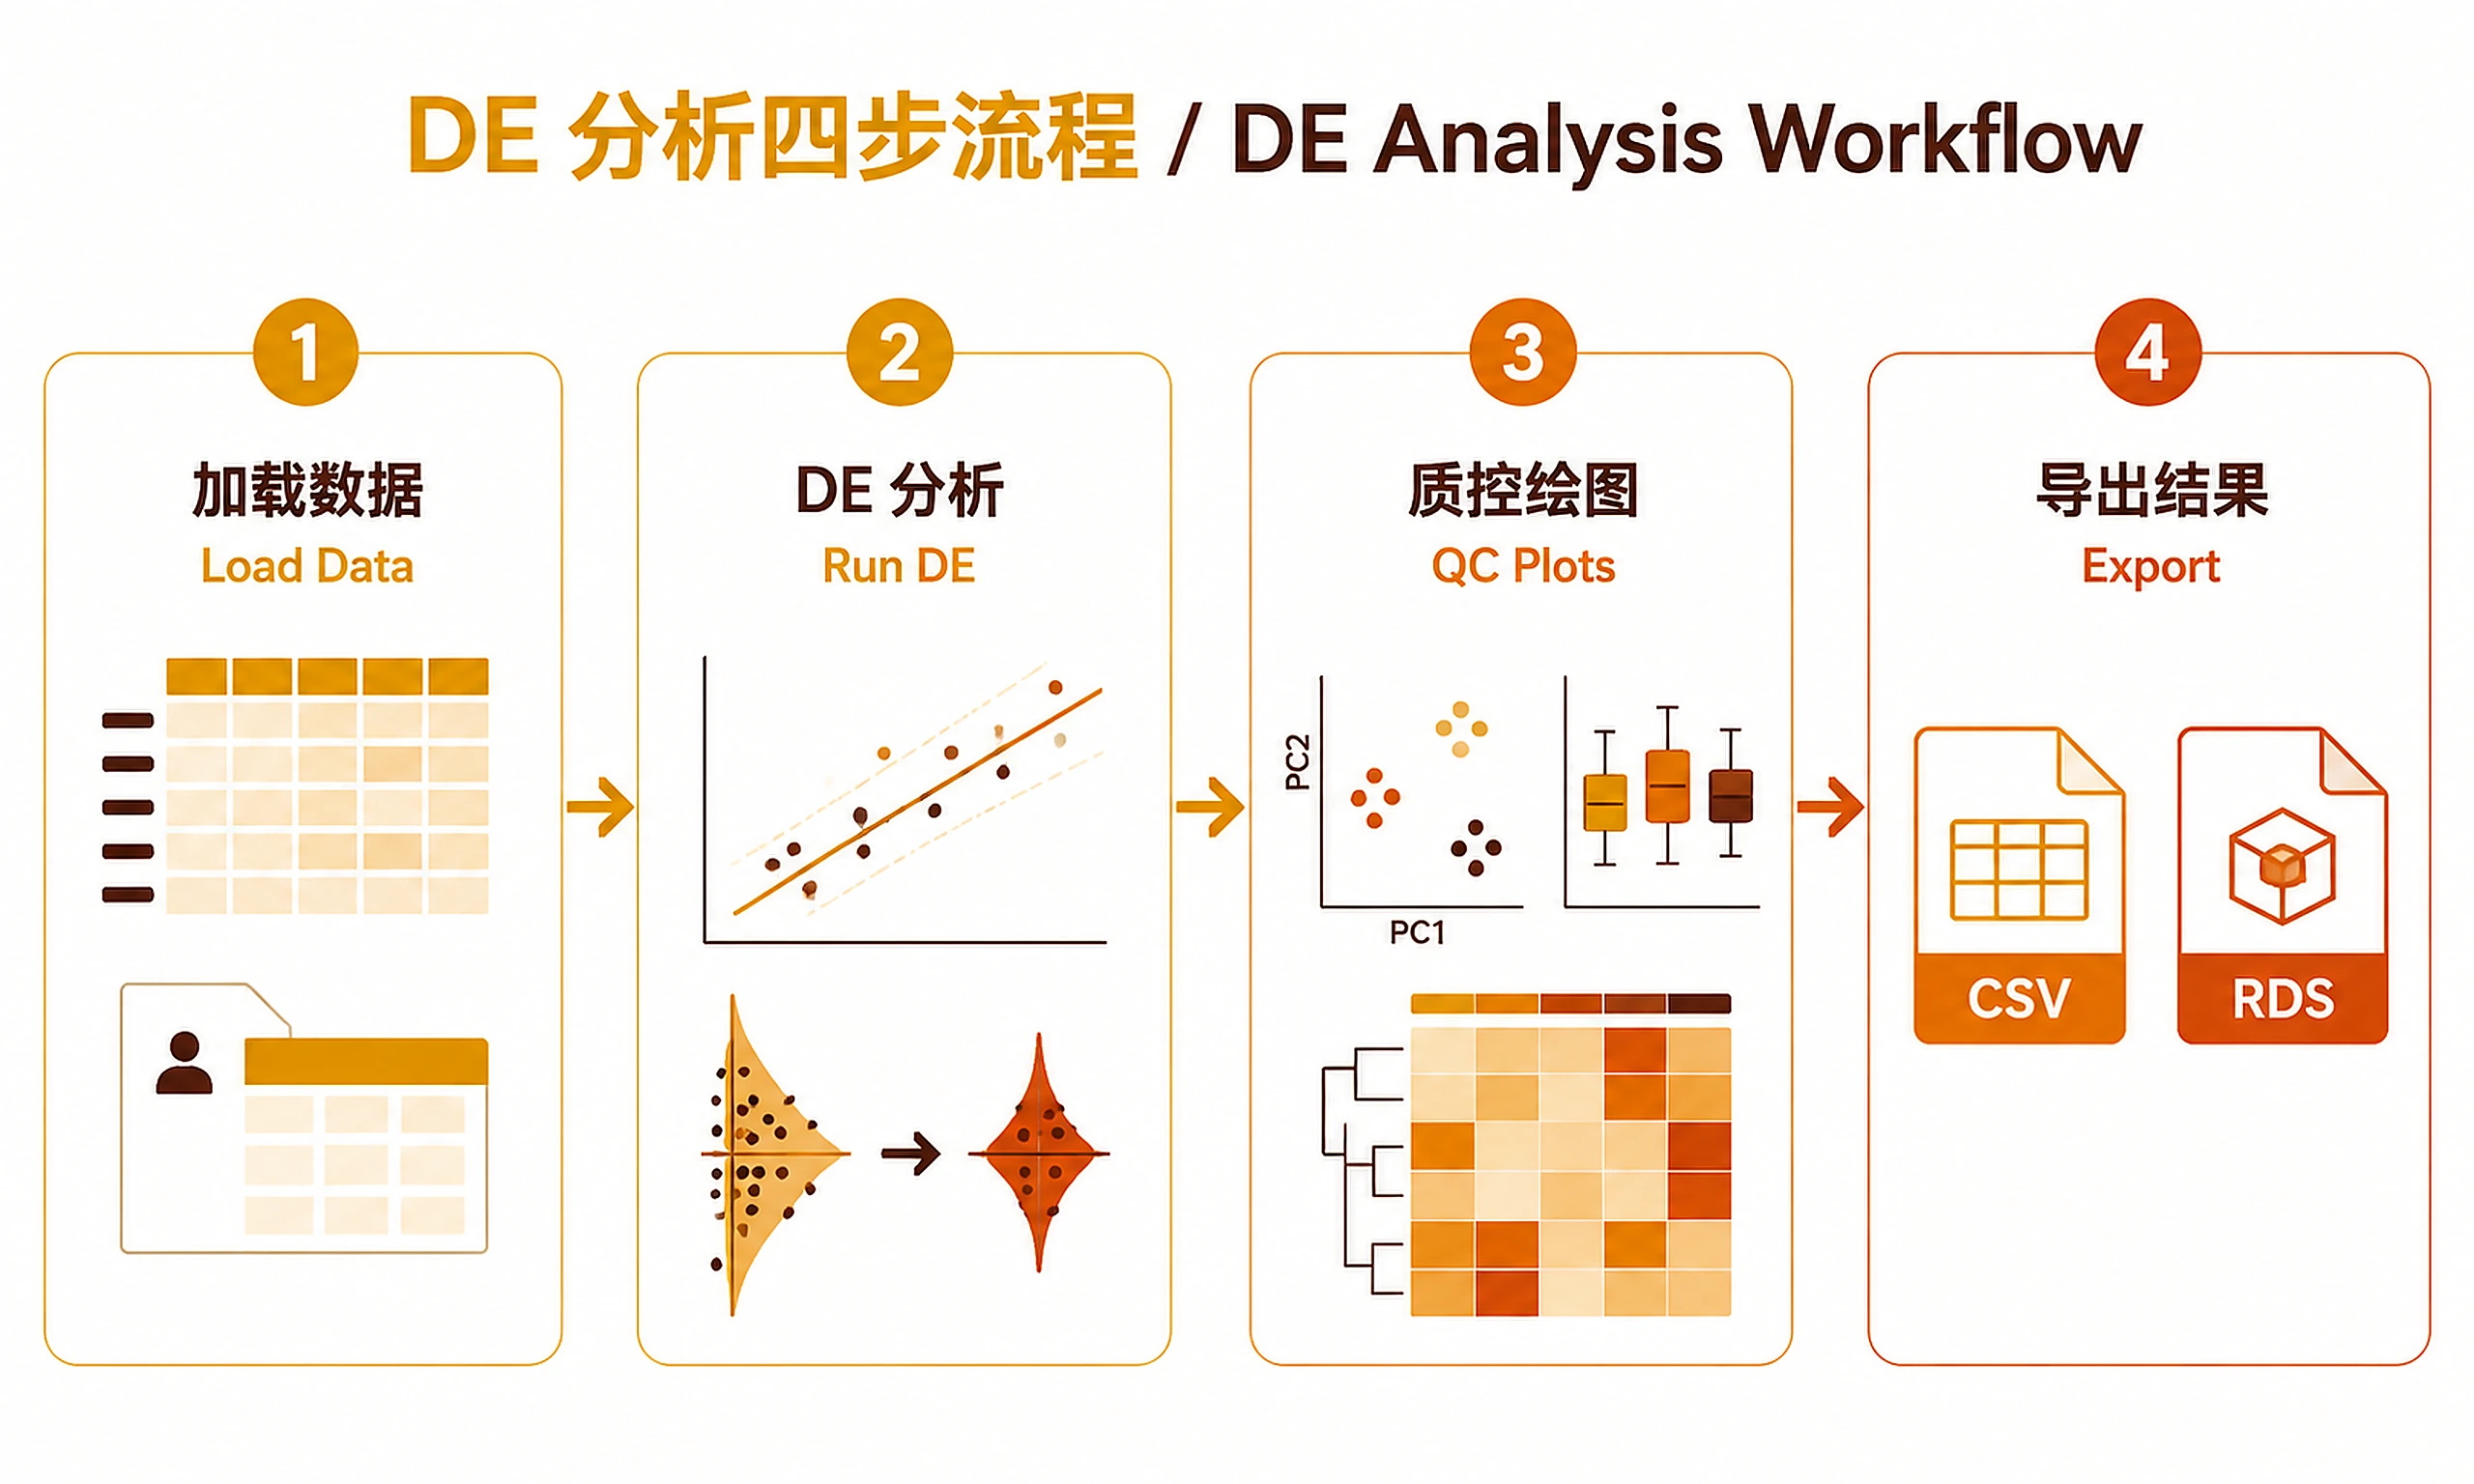
Plots (PNG + SVG):
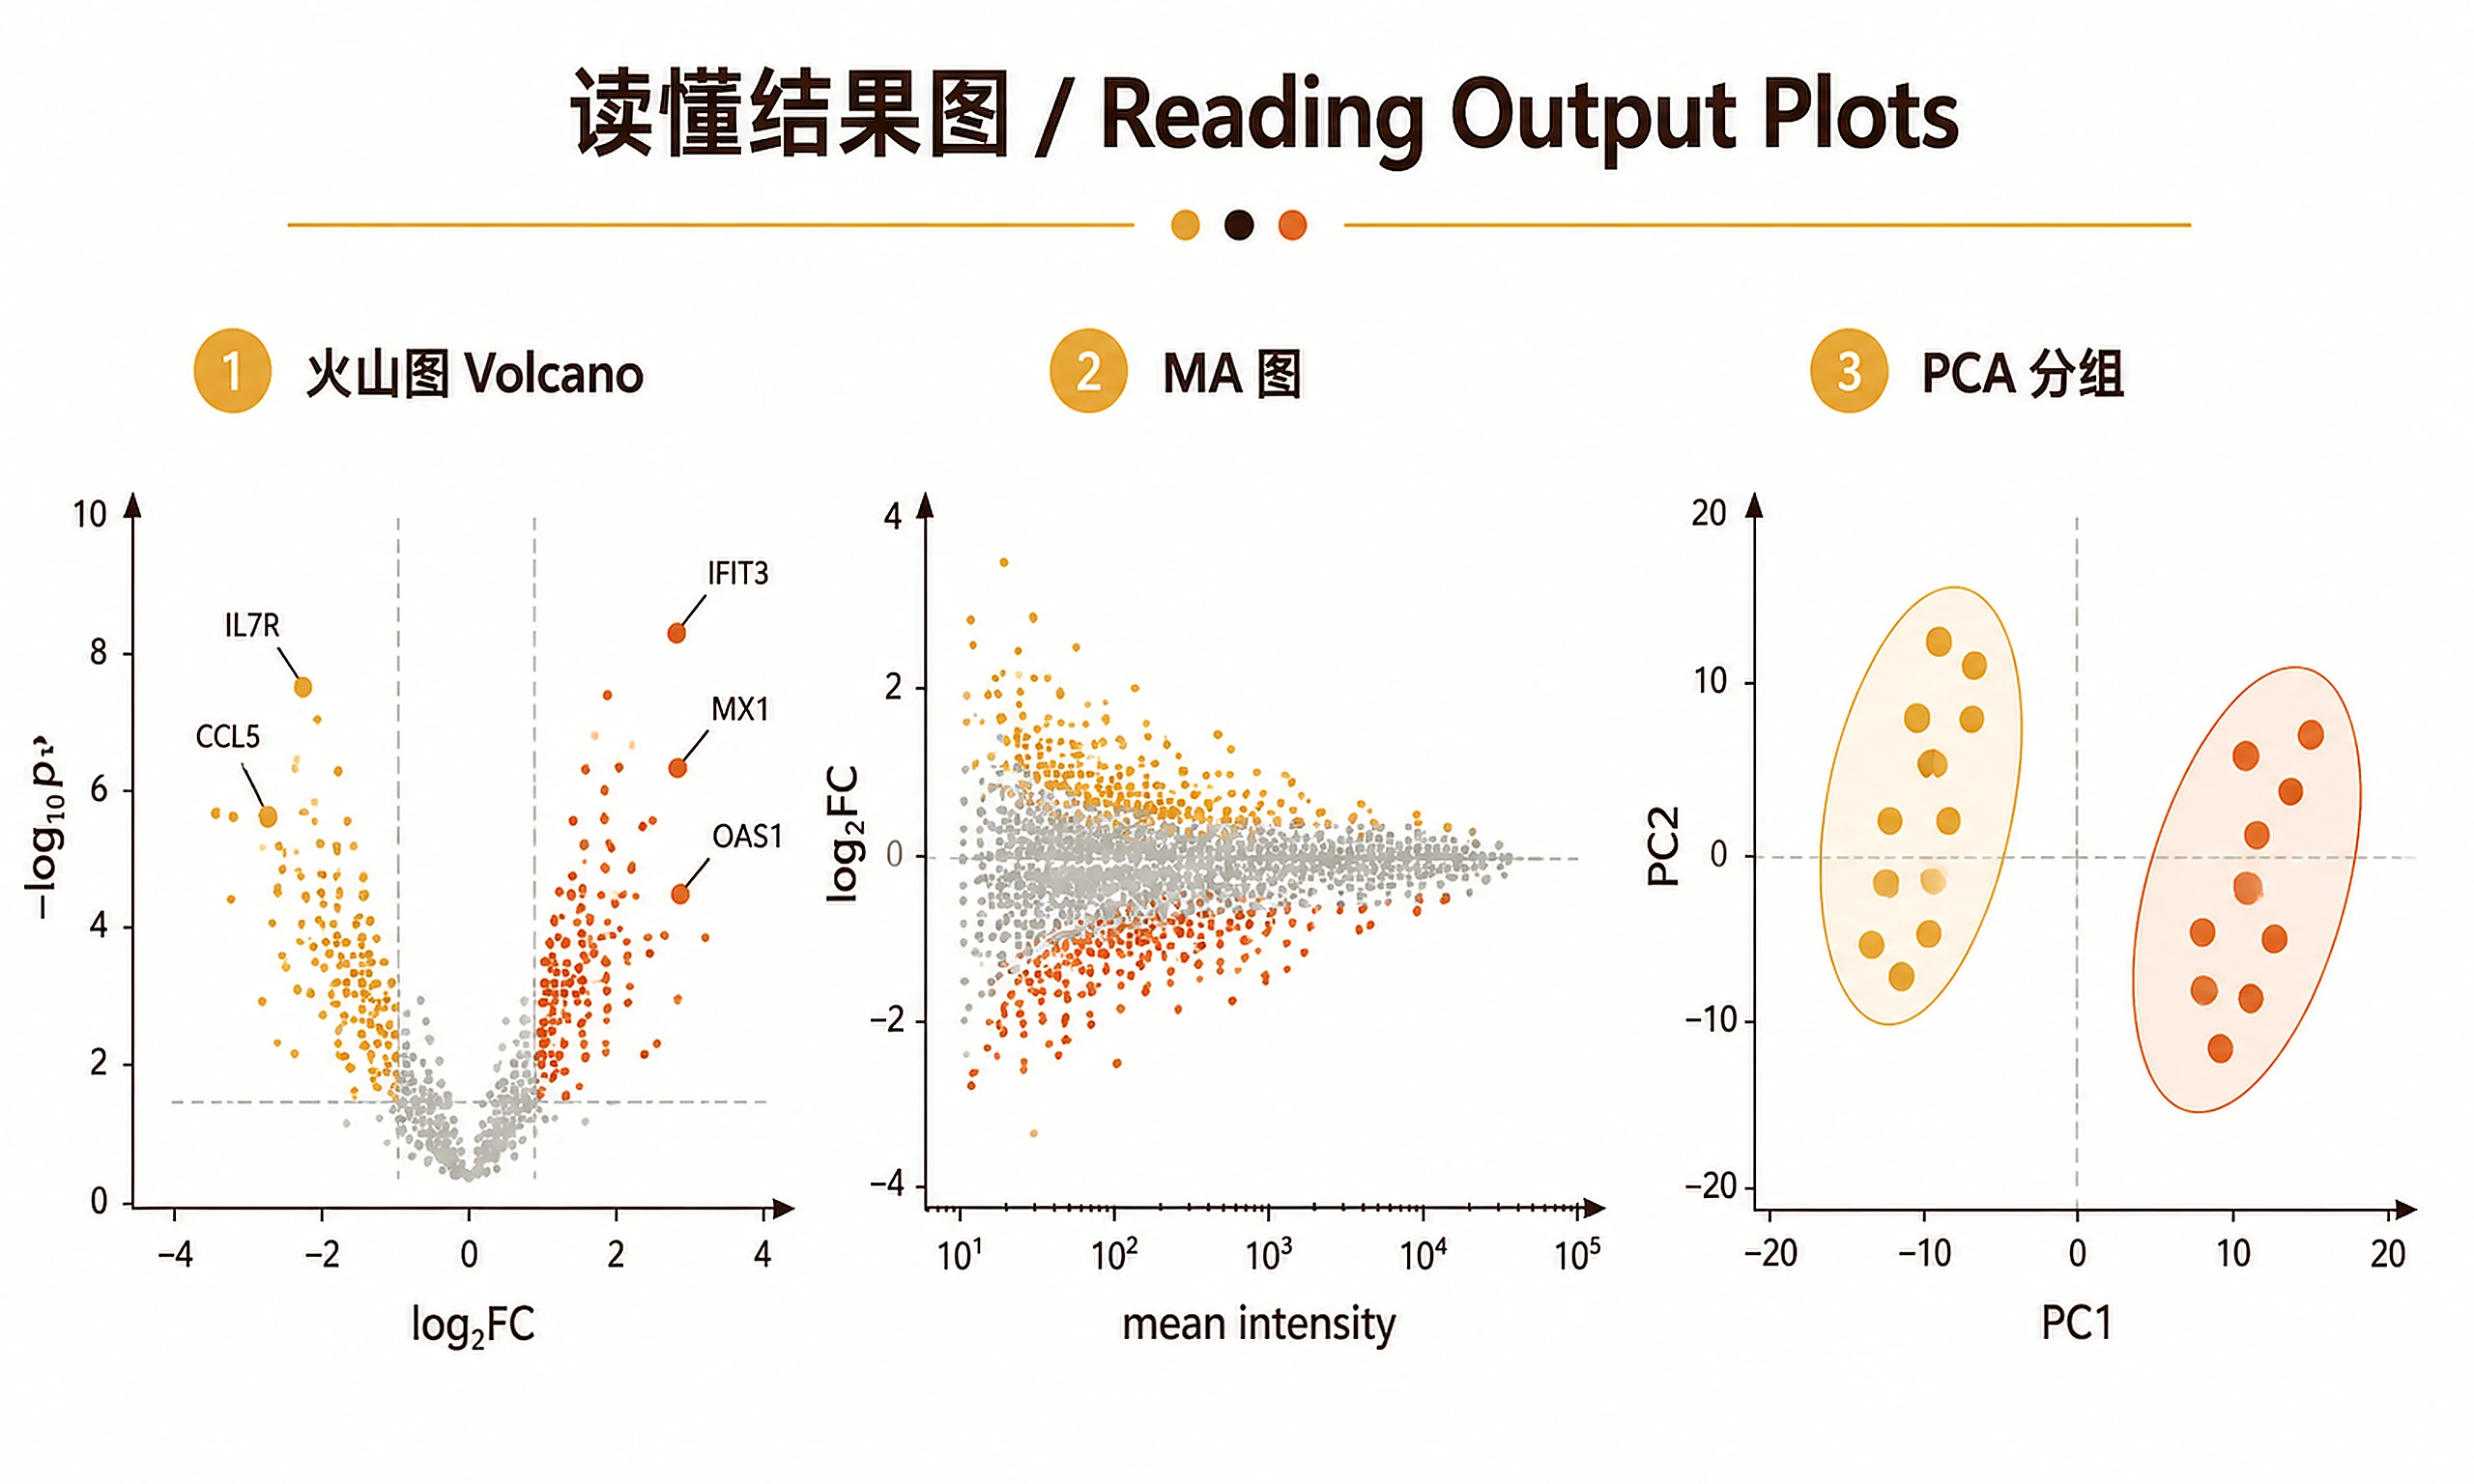
intensity_distribution— Before/after normalization boxplotsmissing_values_heatmap— Missing value pattern across samplespca_plot— PCA colored by conditionsample_correlation_heatmap— Pearson correlation between samplesvolcano_plot— Differential expression with labeled top hitsma_plot— Log2 fold change vs average expressionvariance_psm_plot— DEqMS variance vs PSM count relationship
Reports:
analysis_report.pdf— PDF report (requires rmarkdown + LaTeX)analysis_report.md— Markdown report (always generated)
Clarification Questions
1. Input Files (ASK THIS FIRST):
- Do you have proteomics data files to analyze?
- If uploaded: What format? (MaxQuant proteinGroups.txt / Proteome Discoverer / CSV)
- Expected: protein intensity matrix + sample metadata
- Or use example data? TMT 10-plex A431 cancer cell line dataset (auto-downloads ~30s)
2. Analysis Options (structured):
- (If using example data) The demo dataset contains A431 human cancer cells treated with miRNAs (3 ctrl + 3 miR372 replicates). Choose analysis mode:
- a) Standard analysis with default comparison miR372 vs ctrl (recommended)
- b) Custom comparison (miR191 vs ctrl or miR519 vs ctrl)
- (If using your own data) Which conditions to compare? (e.g., Treatment-Control)
3. Thresholds:
- a) Standard: adjusted p-value < 0.05, |log2FC| > 0.58 / 1.5-fold change (recommended)
- b) Relaxed: adjusted p-value < 0.1, |log2FC| > 0 (any fold change)
- c) Stringent: adjusted p-value < 0.01, |log2FC| > 1 (2-fold change)
Standard Workflow
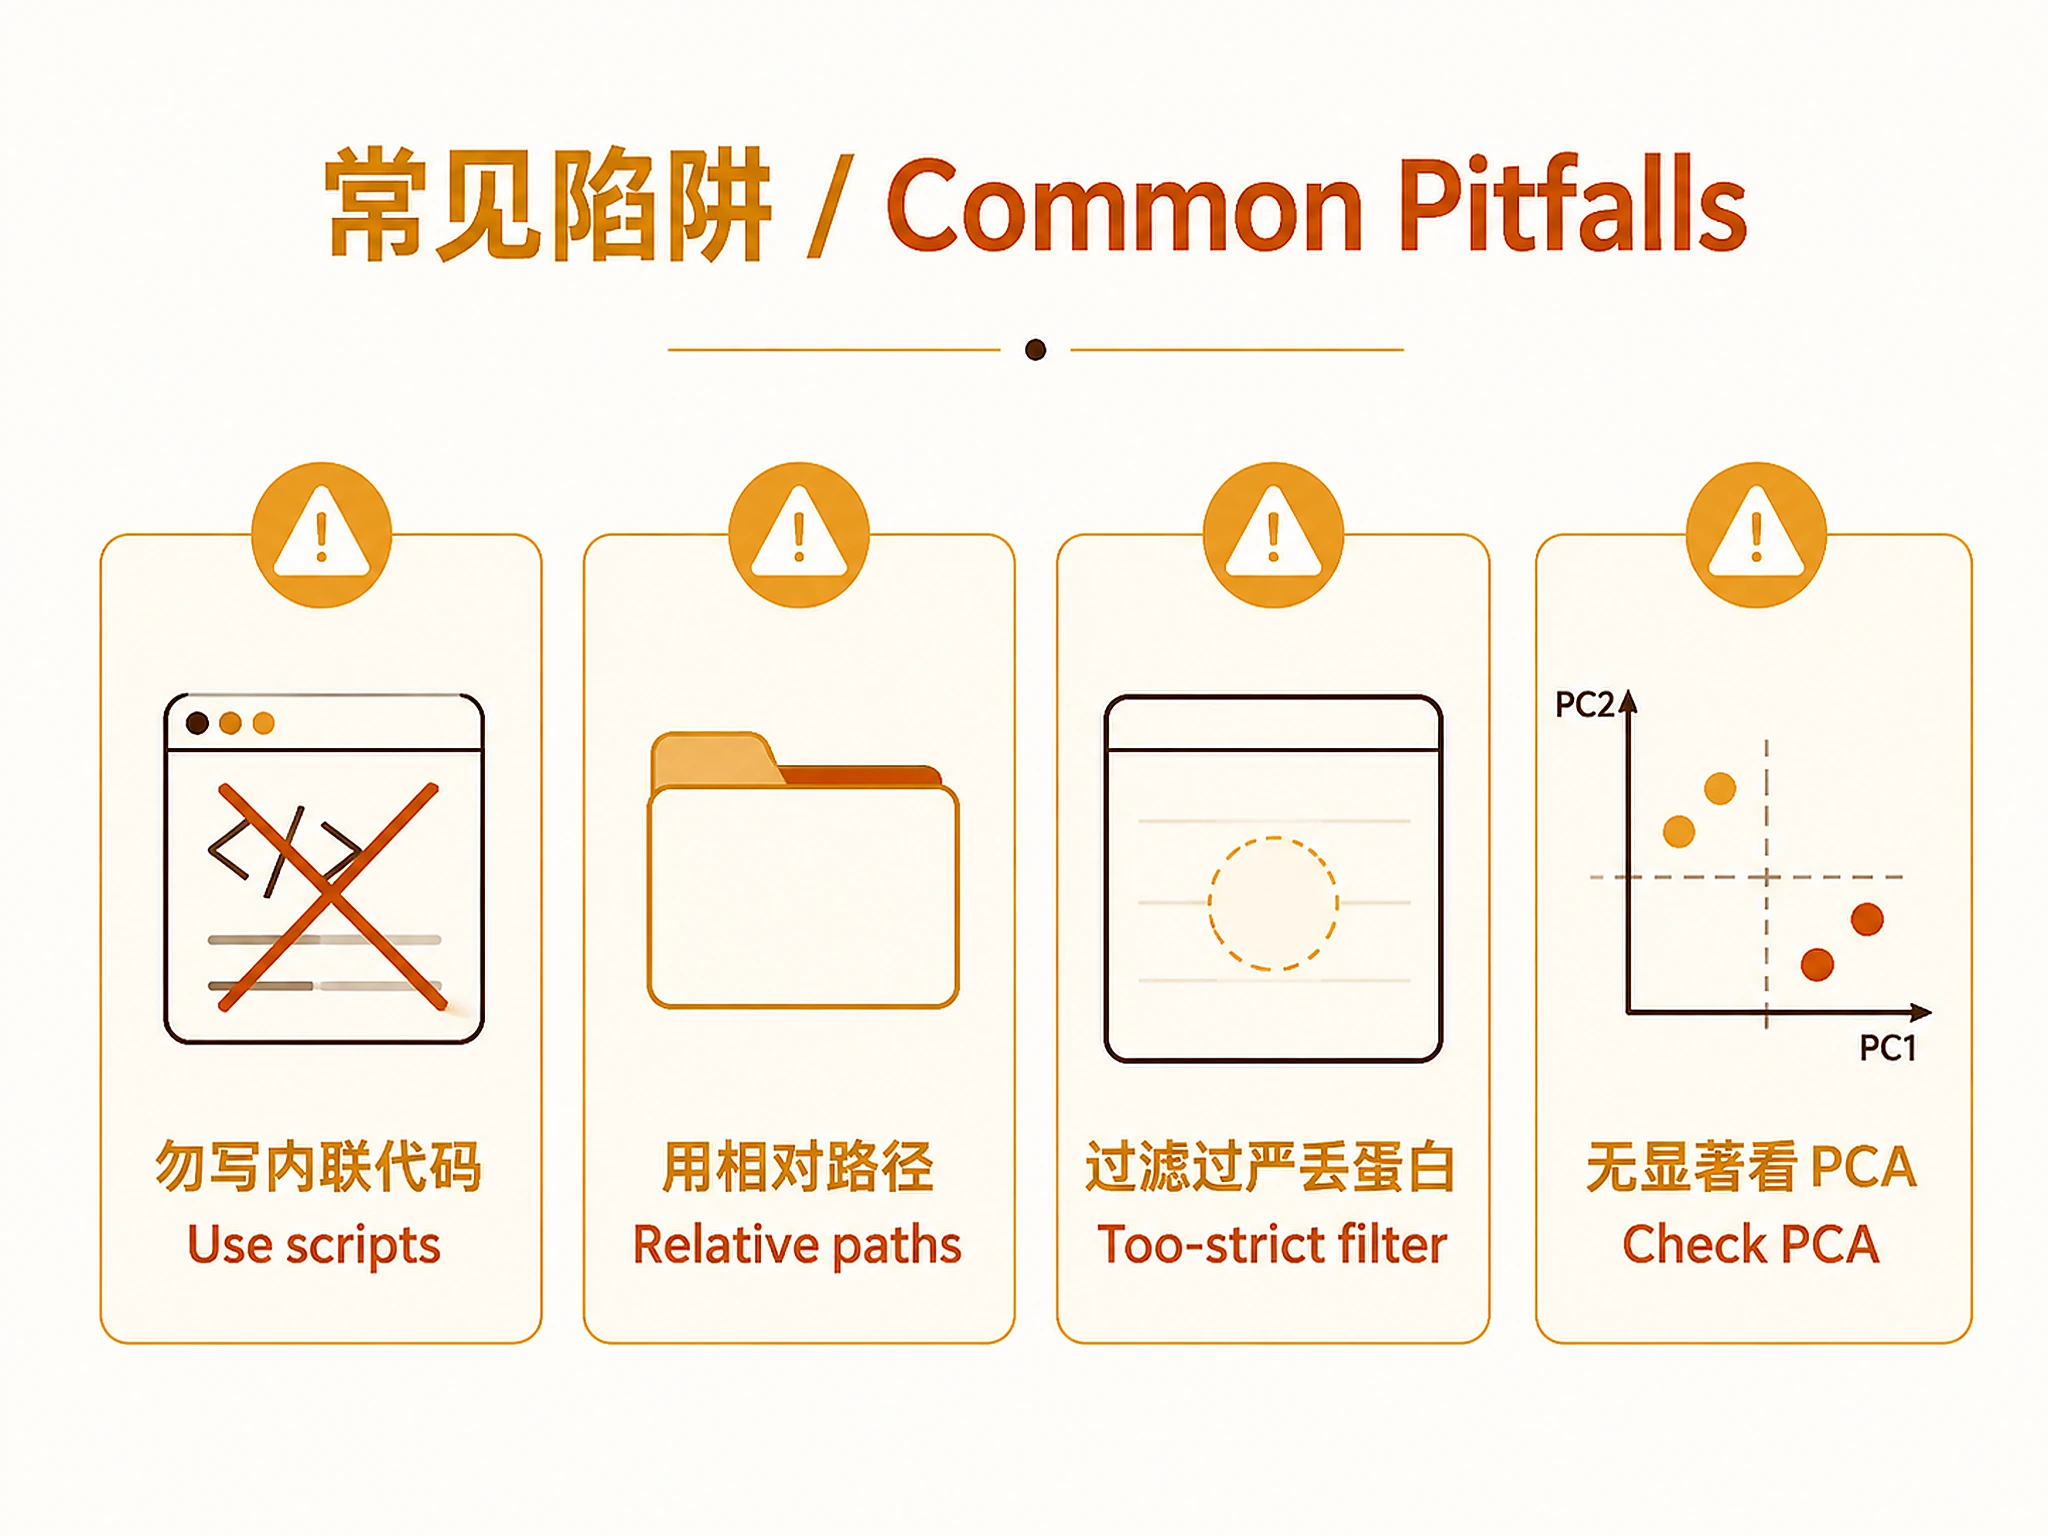
🚨 MANDATORY: USE SCRIPTS EXACTLY AS SHOWN - DO NOT WRITE INLINE CODE 🚨
Step 1 - Load data:
source("scripts/load_example_data.R")
data <- load_example_data()
psm_data <- data$psm_data
metadata <- data$metadata
For your own data: Replace with your loading code, then call validate_input_data().
Step 2 - Run DE analysis:
source("scripts/basic_workflow.R")
DO NOT expand this into inline code. DO NOT write limma/DEqMS steps manually. Just source the script.
Step 3 - Generate plots:
source("scripts/qc_plots.R")
generate_all_plots(fit_deqms, deqms_results, protein_matrix,
                    metadata, output_dir = "results", raw_matrix = raw_matrix)
DO NOT write inline plotting code (ggsave, ggplot, Heatmap, etc.). Just use the script.
Step 4 - Export results:
source("scripts/export_results.R")
export_all(fit_deqms, deqms_results, protein_matrix, metadata,
            output_dir = "results")
DO NOT write custom export code. Use export_all() to save all outputs including RDS.
✅ VERIFICATION - You should see:
- After Step 1:
"✓ Example data loaded successfully"with PSM/protein counts - After Step 2:
"✓ Proteomics DE analysis completed successfully!"with summary - After Step 3:
"✓ All plots generated successfully!" - After Step 4:
"=== Export Complete ==="with file list
❌ IF YOU DON'T SEE THESE MESSAGES: You wrote inline code. Stop and use source().
⚠️ CRITICAL - DO NOT:
- ❌ Write inline limma/DEqMS code → STOP: Use
source("scripts/basic_workflow.R") - ❌ Write inline plotting code → STOP: Use
generate_all_plots() - ❌ Write custom export code → STOP: Use
export_all() - ❌ Try to install svglite → scripts handle SVG fallback automatically
- ❌ Use absolute paths → Always use
scripts/file.R
⚠️ IF SCRIPTS FAIL - Script Failure Hierarchy:
- Fix and Retry (90%) - Install missing package, re-run script
- Modify Script (5%) - Edit the script file itself, document changes
- Use as Reference (4%) - Read script, adapt approach, cite source
- Write from Scratch (1%) - Only if genuinely impossible, explain why
NEVER skip directly to writing inline code without trying the script first.
What the scripts provide:
- scripts/load_example_data.R —
load_example_data(),validate_input_data() - scripts/basic_workflow.R — Complete limma+DEqMS pipeline with PSM aggregation, imputation, normalization
- scripts/qc_plots.R — Publication-quality plots with ggprism/ComplexHeatmap (PNG + SVG with automatic fallback)
- scripts/export_results.R —
export_all()saves all outputs (CSV, RDS, PDF report)
Customizing the Analysis
To change the comparison (before sourcing basic_workflow.R):
comparison_name <- "miR519-ctrl"  # or any valid contrast
source("scripts/basic_workflow.R")
To change imputation/normalization:
imputation_method <- "kNN"         # "MinProb" (default) or "kNN"
normalization_method <- "quantile" # "median" (default), "quantile", or "none"
source("scripts/basic_workflow.R")
For detailed method documentation: See references/proteomics-reference.md For normalization guidance: See references/normalization-guide.md
Common Issues
| Issue | Cause | Fix |
|---|---|---|
| Not seeing verification messages | Wrote inline code instead of source() | Stop and use Standard Workflow commands exactly |
| "cannot open file" error | Using absolute paths | Use relative paths: source("scripts/file.R") |
| ExperimentHub download fails | Network timeout | Set options(timeout = 300) and retry |
| Missing package errors | Package not installed | BiocManager::install('package') or install.packages('package') |
| SVG export error "svglite required" | Missing optional dependency | Use generate_all_plots() — it handles fallback automatically. DO NOT try to install svglite manually |
| svglite dependency conflict | System library version mismatch | Normal — generate_all_plots() falls back to base R svg() device automatically. Both PNG and SVG will be created |
| All proteins filtered out | Too stringent missing value filter | Adjust filter threshold in basic_workflow.R |
| No significant proteins | Weak effect or wrong comparison | Check PCA for condition separation; try relaxed thresholds |
Suggested Next Steps
After running this skill:
- Pathway enrichment → functional-enrichment skill with significant proteins
- Biomarker panel → lasso-biomarker-panel with DE proteins as features
- Network analysis → coexpression-network with protein matrix
- Gene list processing → de-results-to-gene-lists for annotation
Related Skills
| Skill | Relationship | When to Use |
|---|---|---|
| bulk-rnaseq-counts-to-de-deseq2 | Alternative | RNA-seq count data (not proteomics) |
| lasso-biomarker-panel | Downstream | Build biomarker panel from DE proteins |
| coexpression-network | Downstream | Protein co-expression modules |
References
- DEqMS: Zhu Y, et al. Molecular & Cellular Proteomics. 2020;19(6):1047-1057
- limma: Ritchie ME, et al. Nucleic Acids Research. 2015;43(7):e47
- Detailed method reference
- Normalization guide
Code preview
scripts/basic_workflow.R
# Proteomics differential expression workflow using limma + DEqMS
# Source this script after loading data with load_example_data.R
#
# Expects in calling environment:
#   psm_data  - PSM-level data.frame from load_example_data() or user data
#   metadata  - Sample metadata data.frame with 'condition' column
#
# Creates in calling environment:
#   protein_matrix  - Log2 normalized protein intensities (proteins x samples)
#   raw_matrix      - Pre-normalization log2 protein intensities
#   fit_deqms       - DEqMS fit object (augmented limma fit)
#   deqms_results   - DEqMS results data.frame
#   psm_counts      - Named vector of PSM counts per protein
#   comparison_name - String describing the contrast

cat("\n=== Proteomics DE Analysis (limma + DEqMS) ===\n\n")

# ---- Load required packages ----
library(limma)
library(DEqMS)
library(matrixStats)

# ---- Configuration ----
# These can be overridden before sourcing this script
if (!exists("comparison_name")) {
    comparison_name <- "miR372-ctrl"
}
if (!exists("padj_threshold")) {
    padj_threshold <- 0.05
}
if (!exists("lfc_threshold")) {
    lfc_threshold <- 0.58  # log2(1.5) — standard proteomics threshold (1.5-fold change)
}
if (!exists("imputation_method")) {
    imputation_method <- "MinProb"  # "MinProb" or "kNN"
}
if (!exists("normalization_method")) {
    normalization_method <- "median"  # "median", "quantile", or "none"
}

# ---- Validate inputs ----
if (!exists("psm_data") && !exists("protein_matrix")) {
    stop("No input data found. Run load_example_data() first or provide psm_data/protein_matrix.")
}
if (!exists("metadata")) {
    stop("No metadata found. Run load_example_data() first or provide metadata.")
}

# ---- Step 1: PSM-to-protein aggregation ----
if (exists("psm_data") && !exists("protein_matrix")) {
    cat("1. Aggregating PSMs to protein level (medianSweeping)...\n")

    # Identify intensity columns (columns 3-12 for example data)
    # For user data, intensity columns are all numeric columns except gene/protein ID
    if ("gene" %in% colnames(psm_data)) {
        gene_col <- which(colnames(psm_data) == "gene")
        # Get sample columns from metadata
        sample_cols <- which(colnames(psm_data) %in% rownames(metadata))
        if (length(sample_cols) == 0) {
            # Fallback: assume intensity columns are numeric columns after first 2
            sample_cols <- 3:ncol(psm_data)
        }
    } else {
        stop("PSM data must have a 'gene' column for protein grouping")
    }

    # Log2 transform PSM intensities
    dat.psm.log <- psm_data
    dat.psm.log[, sample_cols] <- log2(psm_data[, sample_cols])

    # Replace -Inf (from log2(0)) with NA
    for (col in sample_cols) {
        dat.psm.log[is.infinite(dat.psm.log[, col]), col] <- NA
    }

    # Aggregate PSMs to protein level using medianSweeping
    # group_col = column index of gene/protein ID (typically column 2)
    protein_matrix <- as.matrix(medianSweeping(dat.psm.log, group_col = gene_col))

    # Count PSMs per protein
scripts/export_results.R
# Export proteomics DE results and analysis objects
# Generates all output files including RDS for downstream skills

#' Export all proteomics DE results
#'
#' @param fit_deqms DEqMS fit object from basic_workflow.R
#' @param deqms_results DEqMS results data.frame from basic_workflow.R
#' @param protein_matrix Normalized protein intensity matrix
#' @param metadata Sample metadata data.frame
#' @param psm_counts Named vector of PSM counts (optional, extracted from fit if NULL)
#' @param comparison_name Name of the comparison
#' @param output_dir Output directory (default: "results")
#' @param padj_threshold Adjusted p-value threshold (default: 0.05)
#' @param lfc_threshold Log2 fold change threshold (default: 0.58 = 1.5-fold)
#' @export
export_all <- function(fit_deqms, deqms_results, protein_matrix, metadata,
                        psm_counts = NULL, comparison_name = NULL,
                        output_dir = "results",
                        padj_threshold = 0.05, lfc_threshold = 0.58) {

    cat("\n=== Exporting Proteomics DE Results ===\n\n")

    # Create output directory
    if (!dir.exists(output_dir)) {
        dir.create(output_dir, recursive = TRUE)
        cat("Created directory:", output_dir, "\n\n")
    }

    # Infer comparison name if not provided
    if (is.null(comparison_name) && exists("comparison_name", envir = parent.frame())) {
        comparison_name <- get("comparison_name", envir = parent.frame())
    }
    if (is.null(comparison_name)) comparison_name <- "comparison"

    # Get PSM counts from fit if not provided
    if (is.null(psm_counts) && !is.null(fit_deqms$count)) {
        psm_counts <- fit_deqms$count
    }

    # 1. All DEqMS results
    cat("1. Exporting all DEqMS results...\n")
    write.csv(deqms_results,
              file.path(output_dir, "all_results.csv"),
              row.names = FALSE)
    cat("   Saved: all_results.csv (", nrow(deqms_results), " proteins)\n\n")

    # 2. Significant results
    cat("2. Exporting significant results...\n")
    sig <- deqms_results[!is.na(deqms_results$sca.adj.pval) &
                          deqms_results$sca.adj.pval < padj_threshold &
                          abs(deqms_results$logFC) > lfc_threshold, ]
    sig <- sig[order(sig$sca.adj.pval), ]
    write.csv(sig,
              file.path(output_dir, "significant_results.csv"),
              row.names = FALSE)
    n_up <- sum(sig$logFC > 0)
    n_down <- sum(sig$logFC < 0)
    cat("   Saved: significant_results.csv (", nrow(sig), " proteins:",
        n_up, "up,", n_down, "down)\n")
    cat("   Thresholds: sca.adj.pval <", padj_threshold,
        ", |logFC| >", lfc_threshold, "\n\n")

    # 3. Normalized protein matrix
    cat("3. Exporting normalized protein matrix...\n")
    write.csv(protein_matrix,
              file.path(output_dir, "normalized_protein_matrix.csv"),
              row.names = TRUE)
    cat("   Saved: normalized_protein_matrix.csv (",
        nrow(protein_matrix), "x", ncol(protein_matrix), ")\n\n")

    # 4. Analysis object (CRITICAL for downstream skills)
    cat("4. Saving analysis object (RDS)...\n")
    analysis_object <- list(
        fit_deqms = fit_deqms,
        deqms_results = deqms_results,
        protein_matrix = protein_matrix,
        metadata = metadata,
        psm_counts = psm_counts,
        comparison_name = comparison_name,
        thresholds = list(padj = padj_threshold, lfc = lfc_threshold)
scripts/generate_report.R
# Generate PDF analysis report for proteomics DE analysis
# Uses rmarkdown with PDF output (optional dependency)

#' Generate PDF analysis report
#'
#' @param deqms_results DEqMS results data.frame
#' @param metadata Sample metadata data.frame
#' @param comparison_name Name of the comparison (e.g., "miR372-ctrl")
#' @param output_dir Directory containing plots and for output
#' @param n_proteins Total number of proteins tested
#' @return Path to generated PDF, or NULL if generation failed
#' @export
generate_report <- function(deqms_results, metadata,
                             comparison_name = "Treatment vs Control",
                             output_dir = "results",
                             n_proteins = NULL,
                             padj_threshold = 0.05,
                             lfc_threshold = 0.58) {

    # Check rmarkdown availability
    if (!requireNamespace("rmarkdown", quietly = TRUE)) {
        cat("   rmarkdown not installed - skipping PDF report\n")
        cat("   Install with: install.packages('rmarkdown')\n")
        return(NULL)
    }

    # Check for LaTeX
    has_latex <- FALSE
    if (requireNamespace("tinytex", quietly = TRUE)) {
        has_latex <- tinytex::is_tinytex() || nchar(Sys.which("xelatex")) > 0
    }
    if (!has_latex) {
        has_latex <- nchar(Sys.which("pdflatex")) > 0 || nchar(Sys.which("xelatex")) > 0
    }

    if (!has_latex) {
        cat("   No LaTeX installation found - skipping PDF report\n")
        cat("   Install with: tinytex::install_tinytex()\n")
        return(NULL)
    }

    cat("   Generating PDF report...\n")

    # Compute summary stats
    if (is.null(n_proteins)) n_proteins <- nrow(deqms_results)
    n_sig <- sum(deqms_results$sca.adj.pval < padj_threshold &
                  abs(deqms_results$logFC) > lfc_threshold, na.rm = TRUE)
    n_up <- sum(deqms_results$sca.adj.pval < padj_threshold &
                 deqms_results$logFC > lfc_threshold, na.rm = TRUE)
    n_down <- sum(deqms_results$sca.adj.pval < padj_threshold &
                   deqms_results$logFC < -lfc_threshold, na.rm = TRUE)
    n_samples <- nrow(metadata)
    conditions <- paste(levels(metadata$condition), collapse = ", ")

    # Top 20 proteins table
    top20 <- head(deqms_results[order(deqms_results$sca.adj.pval), ], 20)
    top20_table <- data.frame(
        Protein = top20$protein,
        logFC = sprintf("%.3f", top20$logFC),
        `DEqMS.adj.pval` = sprintf("%.2e", top20$sca.adj.pval),
        `limma.adj.pval` = sprintf("%.2e", top20$adj.P.Val),
        PSM.count = top20$count,
        check.names = FALSE
    )

    # Find available plot files
    plot_files <- list.files(output_dir, pattern = "\\.png$", full.names = TRUE)

    # Build Rmd content
    rmd_content <- paste0(
'---
title: "Proteomics Differential Expression Report"
subtitle: "limma + DEqMS Analysis"
date: "', format(Sys.Date(), "%B %d, %Y"), '"
output:
  pdf_document:
    toc: true
    toc_depth: 2
    number_sections: true
---
Companion files
| Type | Path | Bytes |
|---|---|---|
| Markdown | references/normalization-guide.md | 3,020 |
| Markdown | references/proteomics-reference.md | 4,882 |
| R | scripts/basic_workflow.R | 10,225 |
| R | scripts/export_results.R | 8,366 |
| R | scripts/generate_report.R | 8,514 |
| R | scripts/load_example_data.R | 6,831 |
| R | scripts/qc_plots.R | 15,392 |
| Markdown | SKILL.md | 11,510 |
| JSON | skill.meta.json | 1,858 |