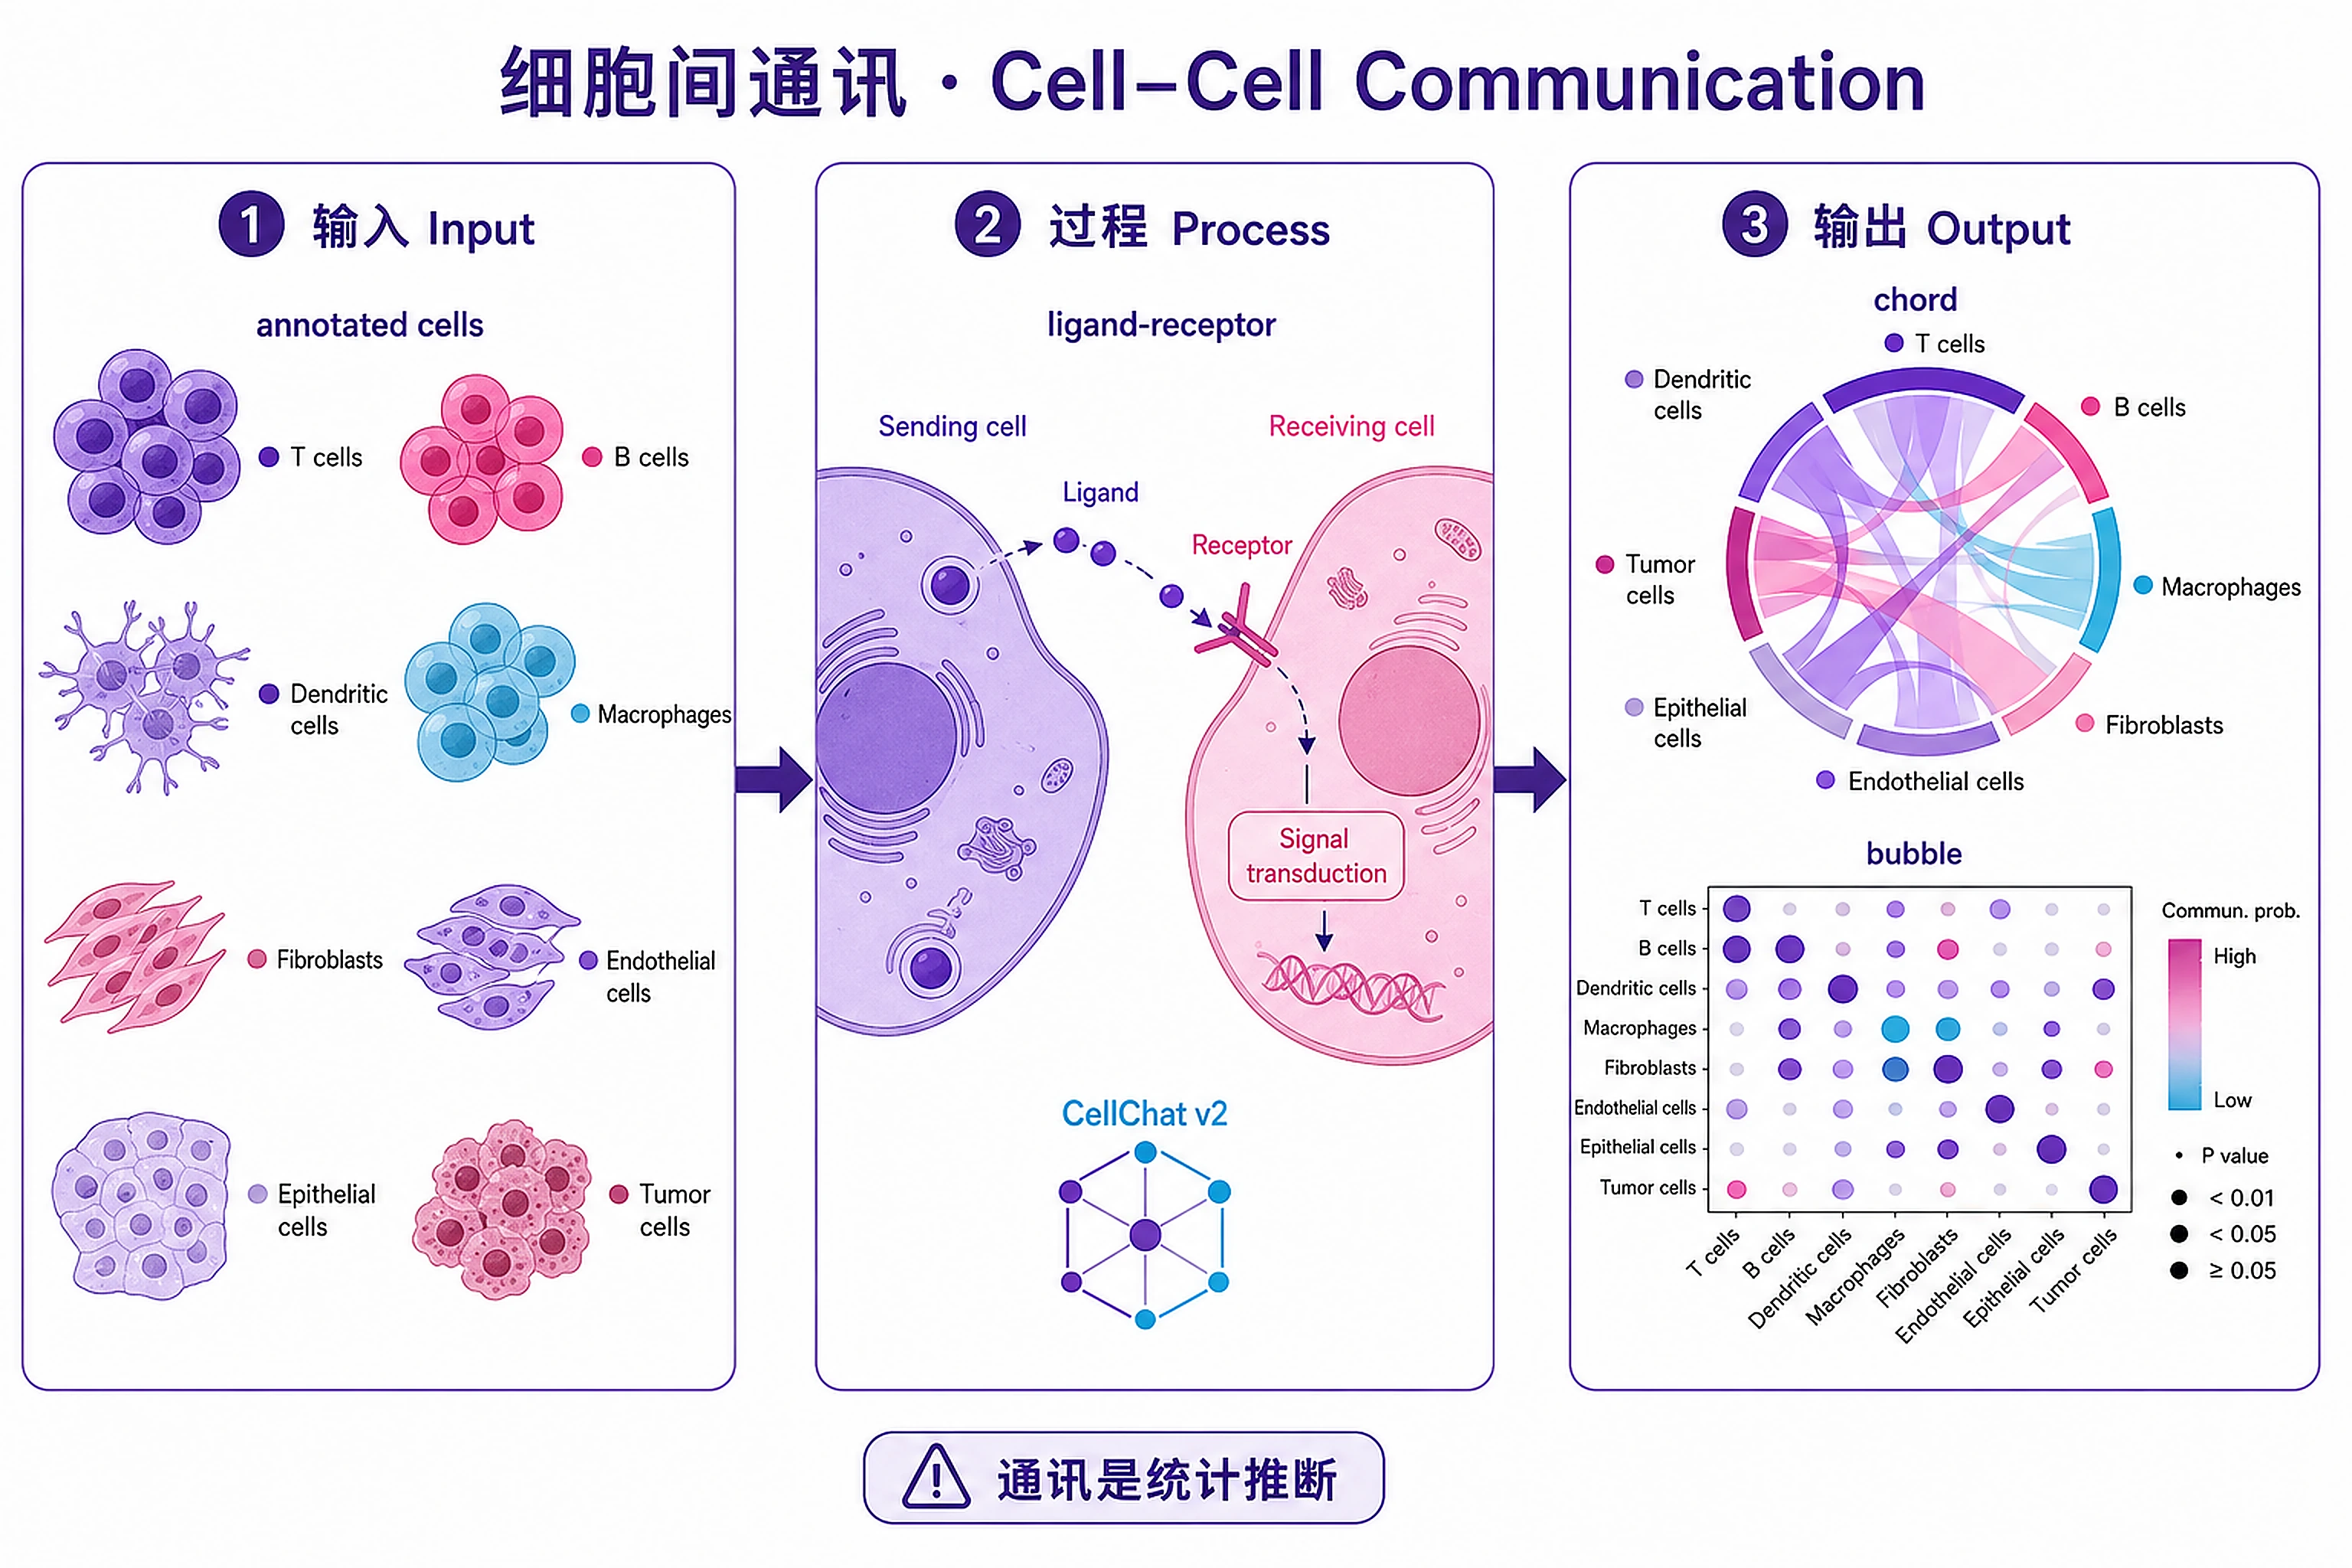
Cell–Cell Communication
Infer ligand–receptor communication networks with CellChat v2.
Overview
Problem. Which pathways let cell groups talk to each other.
Learning goals
- Communication is statistical, not observed
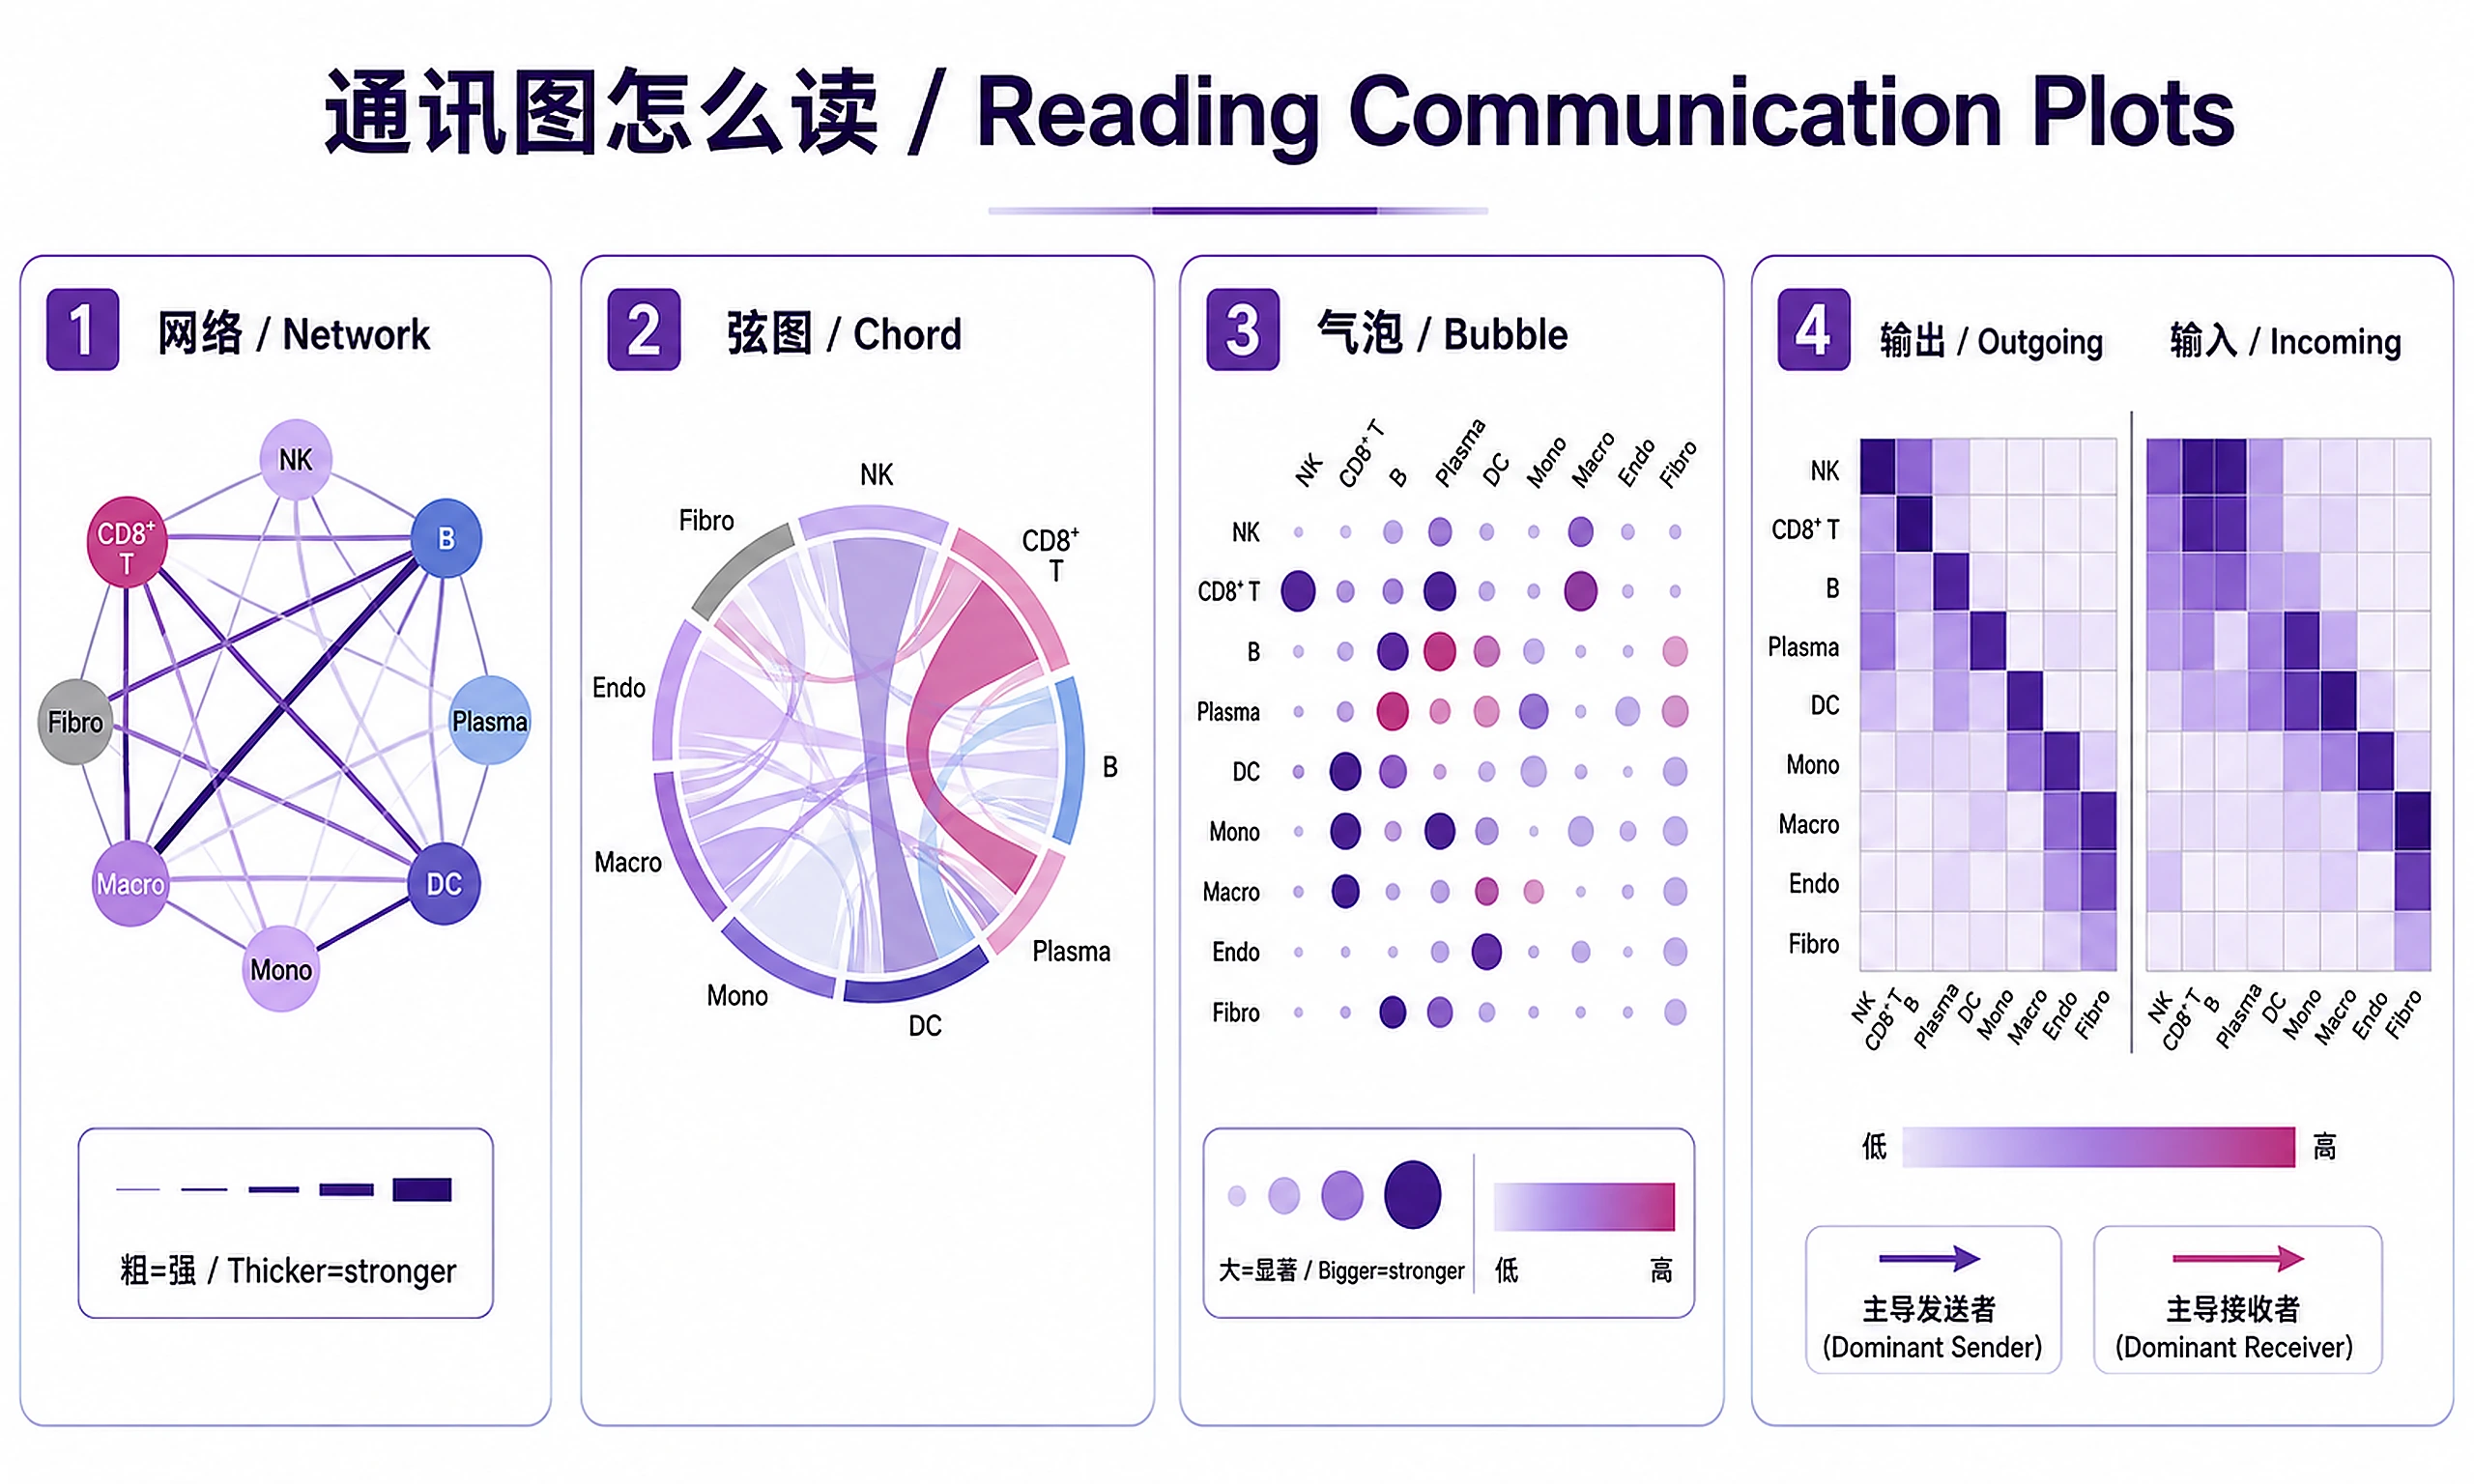
- Learn to read chord and bubble plots
Figures
Tutorial
When to Use This Skill
✅ Use when:
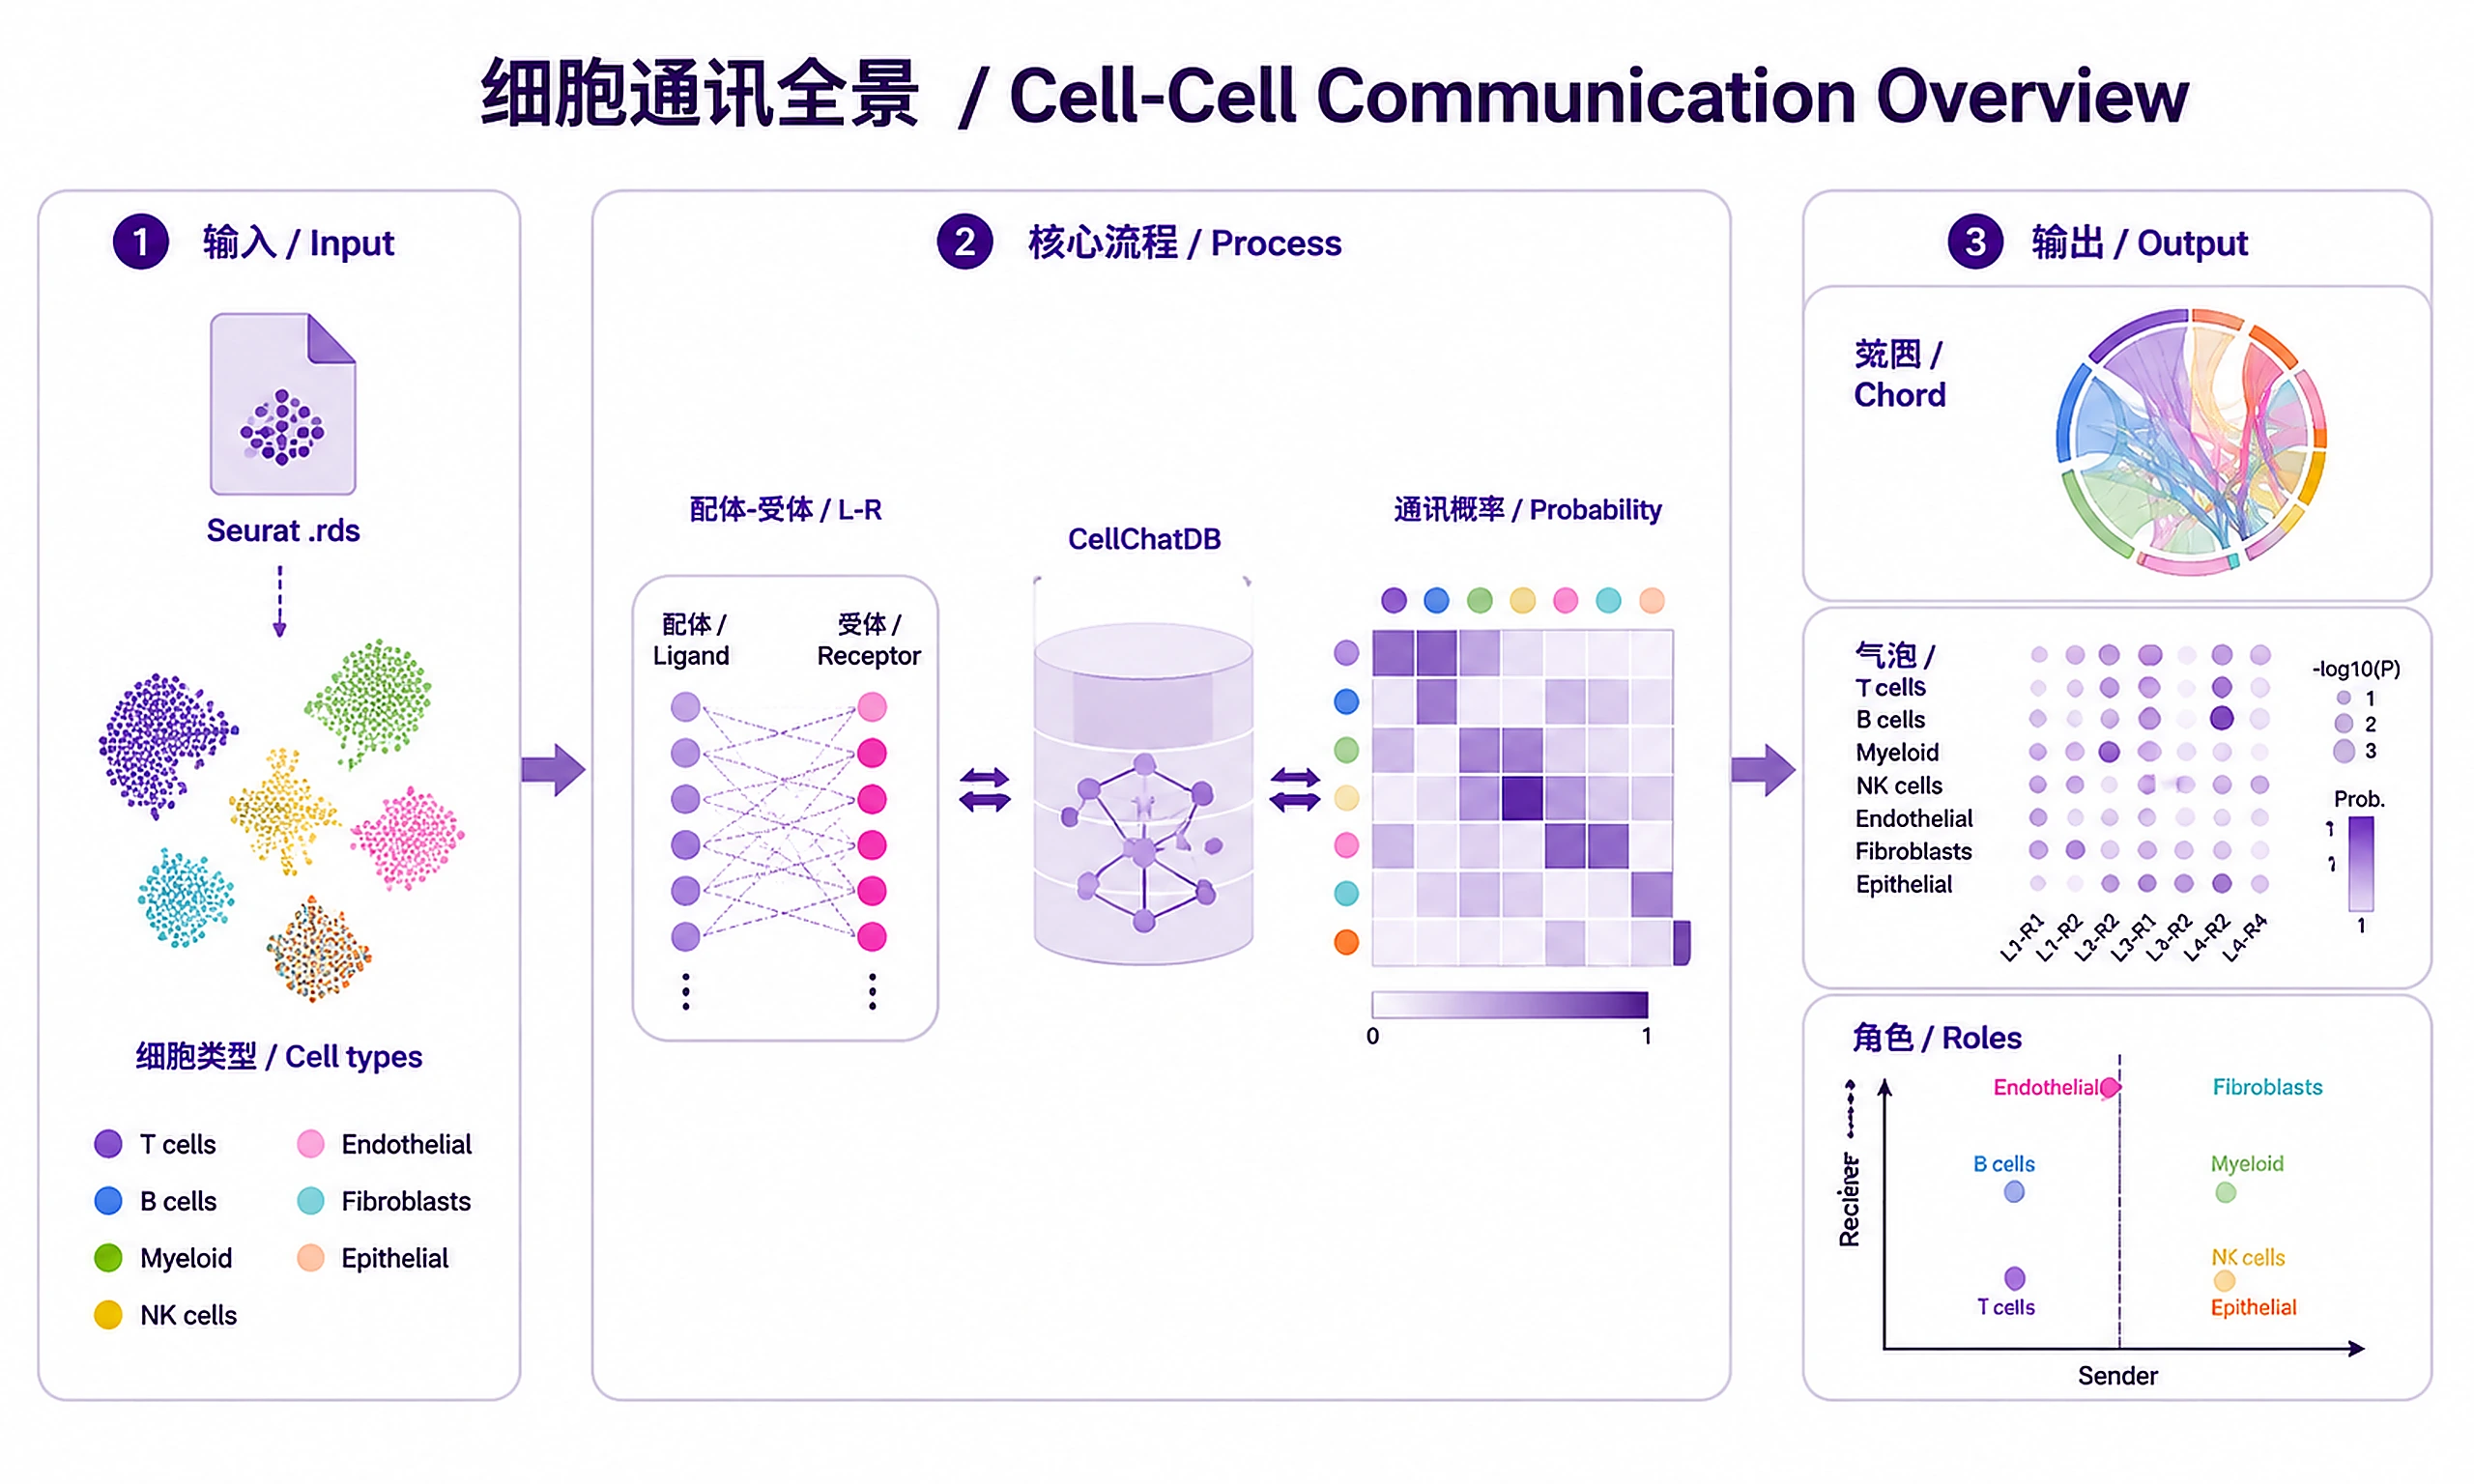
- You have an annotated scRNA-seq dataset (Seurat object with cell type labels)
- You want to identify ligand-receptor interactions between cell types
- You want to visualize communication networks (chord diagrams, bubble plots)
- You want to find dominant sender/receiver cell populations
- Chains from
scrnaseq-seurat-core-analysisoutput (seurat_processed.rds)
❌ Don't use when:
- Data is not annotated (run
scrnaseq-seurat-core-analysisfirst) - You need spatial cell-cell communication (CellChat v2 supports this but requires spatial coordinates)
- You want gene regulatory networks (use
grn-pyscenicinstead) - You have bulk RNA-seq data
Installation
| Package | Version | License | Commercial Use | Installation |
|---|---|---|---|---|
| CellChat | ≥2.0.0 | GPL-3 | ✅ Permitted | devtools::install_github("jinworks/CellChat") |
| Seurat | ≥5.0.0 | MIT | ✅ Permitted | install.packages('Seurat') |
| SeuratData | ≥0.2.1 | GPL-3 | ✅ Permitted | devtools::install_github('satijalab/seurat-data') |
| NMF | ≥0.23.0 | GPL-2+ | ✅ Permitted | install.packages('NMF') |
| circlize | ≥0.4.12 | MIT | ✅ Permitted | install.packages('circlize') |
| ComplexHeatmap | ≥2.12.0 | MIT | ✅ Permitted | BiocManager::install('ComplexHeatmap') |
| ggprism | ≥1.0.3 | GPL-3 | ✅ Permitted | install.packages('ggprism') |
| presto | ≥1.0.0 | GPL-3 | ✅ Permitted | remotes::install_github('immunogenomics/presto') |
| ggalluvial | ≥0.12.0 | GPL-2 | ✅ Permitted | install.packages('ggalluvial') |
| rmarkdown | ≥2.20 | GPL-3 | ✅ Permitted | install.packages('rmarkdown') |
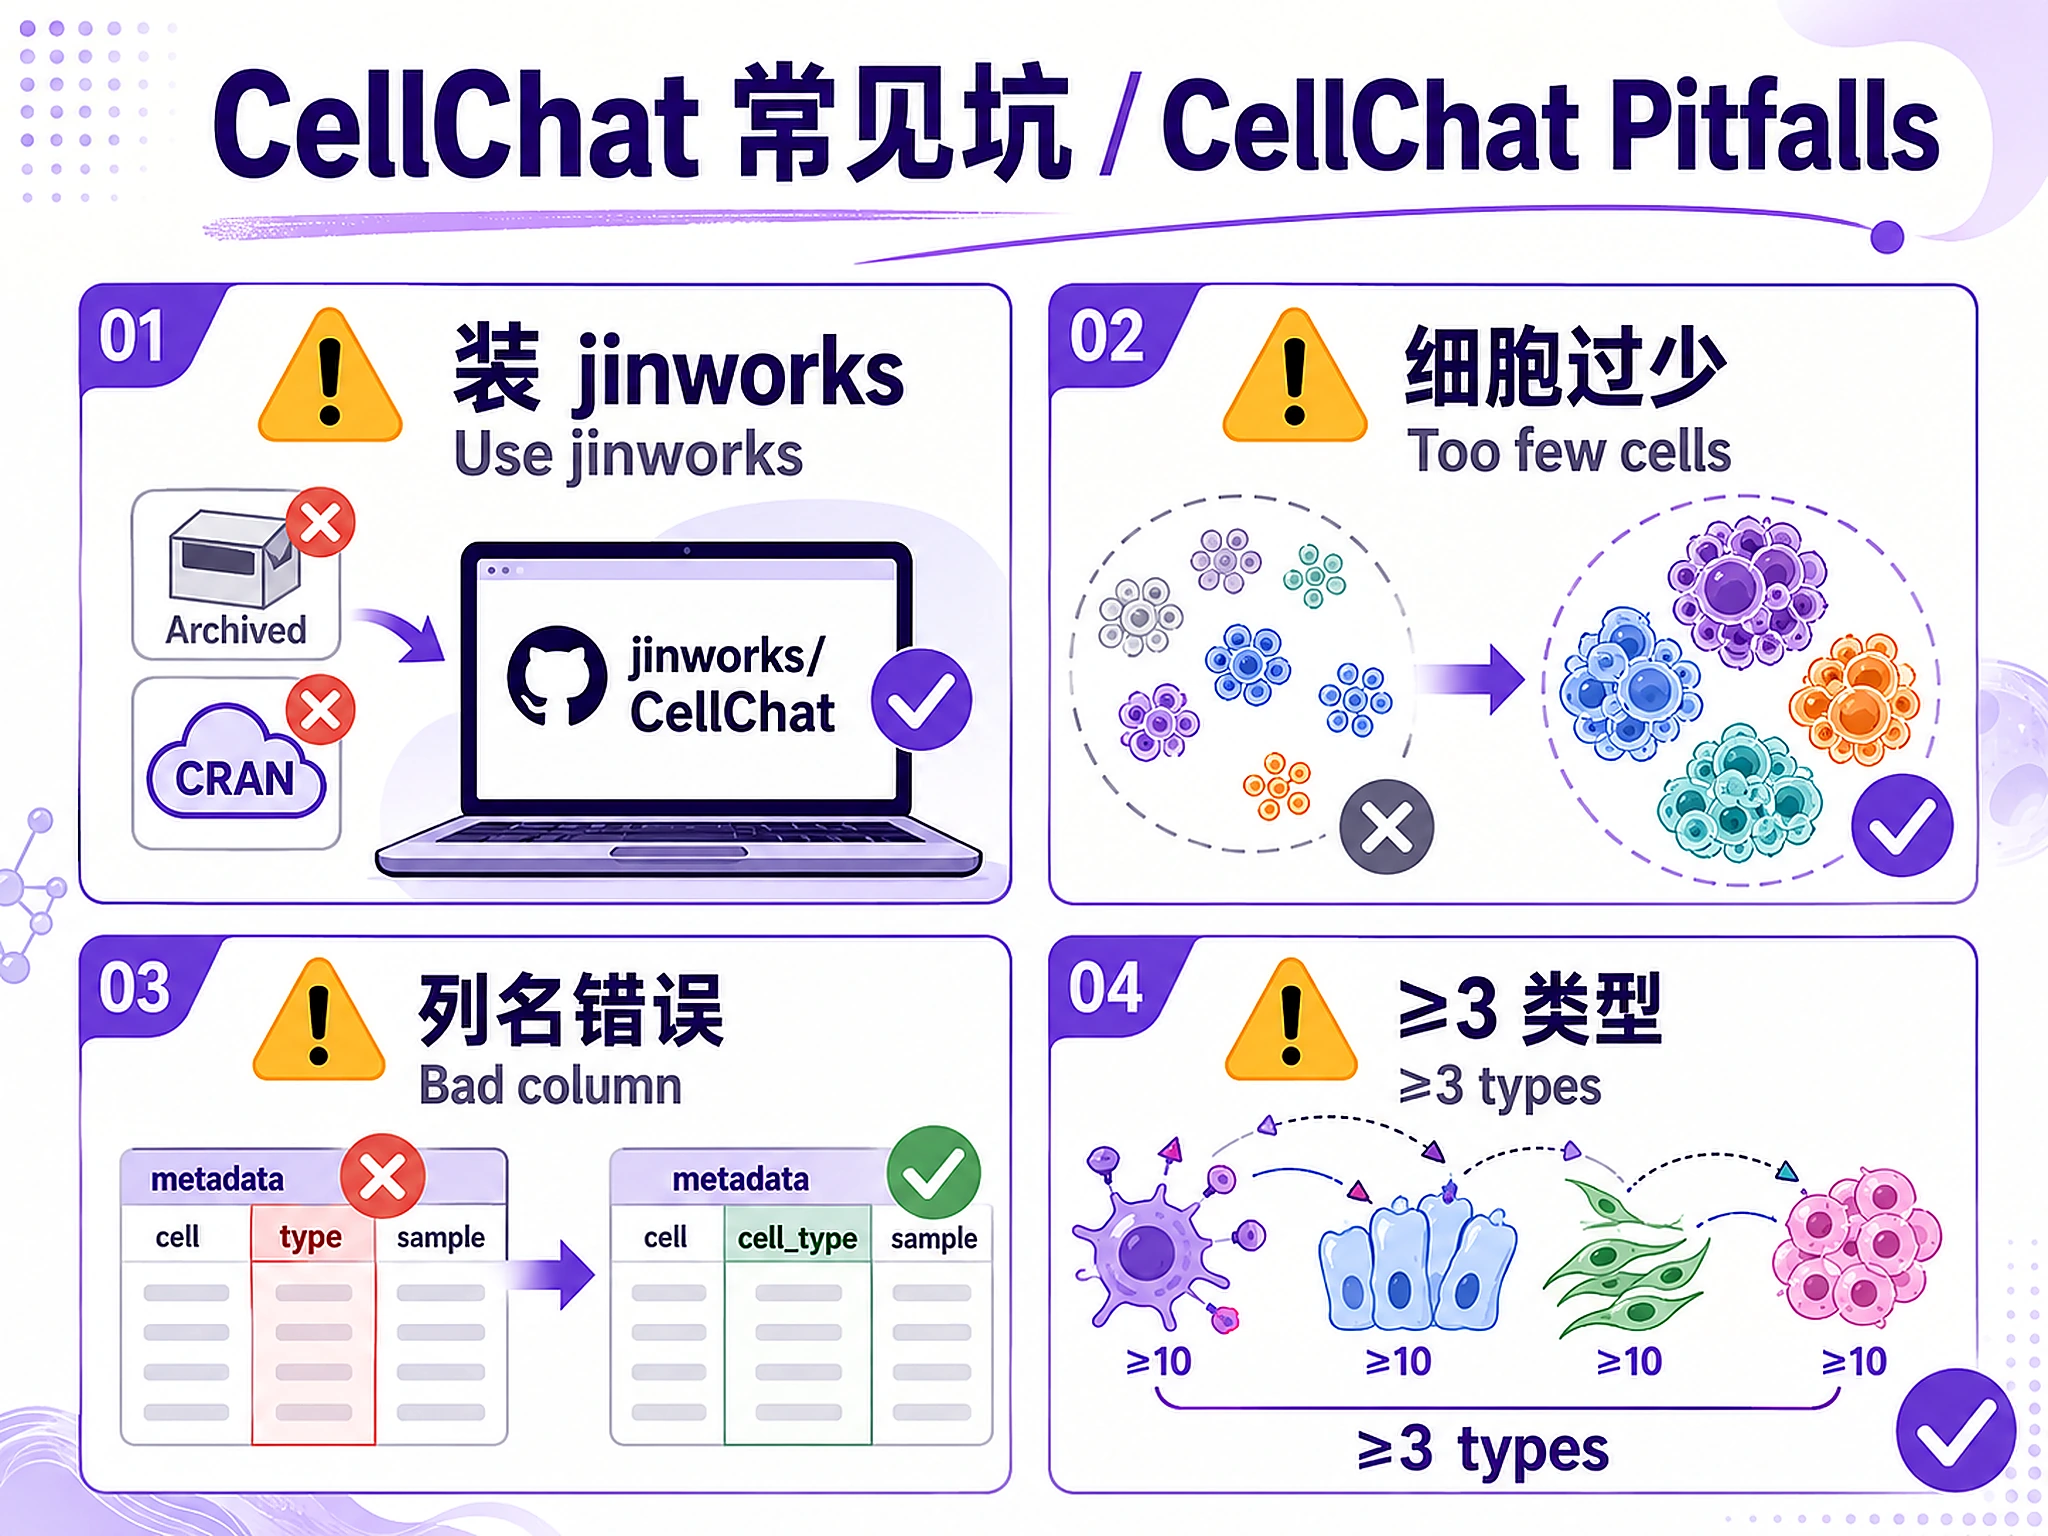
⚠️ CellChat must be installed from GitHub (not CRAN). Use the jinworks repository (active), not sqjin (archived).
Inputs
Required:
- Seurat object (.rds) with:
- Normalized expression data (
@assays$RNA@data) - Cell type annotations in metadata (e.g.,
celltypecolumn) - Minimum 3 cell types, ≥10 cells per type recommended
Accepted sources:
seurat_processed.rdsfromscrnaseq-seurat-core-analysis(chains directly)- Any annotated Seurat v5 object
- Example PBMC data (auto-loaded if no file provided)
Outputs
CSV tables:
significant_interactions.csv— All significant L-R pairs with source, target, pathway, probabilitypathway_summary.csv— Pathway-level communication summaryinteraction_count_matrix.csv— Cell type × cell type interaction countsinteraction_strength_matrix.csv— Cell type × cell type communication weightssignaling_roles.csv— Centrality scores (sender, receiver, mediator, influencer per pathway)top_interactions.csv— Top 20 interactions ranked by probability
Visualizations (PNG + SVG):
interaction_count_network— Circle plot of interaction countsinteraction_strength_network— Circle plot of communication strengthchord_aggregated— Chord diagram of the full communication networkbubble_ligand_receptor— Bubble plot of L-R pairs by cell type pairssignaling_outgoing_heatmap— Outgoing signaling patterns by cell typesignaling_incoming_heatmap— Incoming signaling patterns by cell typesignaling_role_scatter— Dominant senders vs receivers scatter
Analysis objects (RDS):
cellchat_object.rds— Complete CellChat object for downstream use- Load with:
cellchat <- readRDS('cellchat_object.rds') - Required for: multi-condition comparison, pathway-specific deep dives
Reports:
analysis_report.md— Markdown report (always generated)analysis_report.pdf— PDF report (requires rmarkdown + LaTeX)
Clarification Questions
🚨 ALWAYS ask Question 1 FIRST. Do not proceed before the user answers.
1. Input Files (ASK THIS FIRST):
- Do you have an annotated Seurat object (.rds) from scRNA-seq analysis?
- If yes: provide the path to the
.rdsfile - Expected: Seurat v5 object with cell type labels in metadata
- Or use example data? — PBMC 3k dataset (human immune cells, 2,638 cells, 8 cell types)
- Uses
source("scripts/load_data.R"); seurat_obj <- load_example_pbmc()
🚨 IF EXAMPLE DATA SELECTED: Parameters are pre-defined. Skip to Question 4 (or proceed directly to Step 1). Do NOT ask questions 2-3.
2. Species (own data only):
- a) Human (CellChatDB.human) — default
- b) Mouse (CellChatDB.mouse)
3. Cell Type Column (own data only):
- Which metadata column contains cell type annotations?
- Common:
celltype,singler_labels,cell_type,predicted.celltype.l2 - Check with:
colnames(seurat_obj@meta.data)
4. Analysis Scope (structured — works for demo and own data):
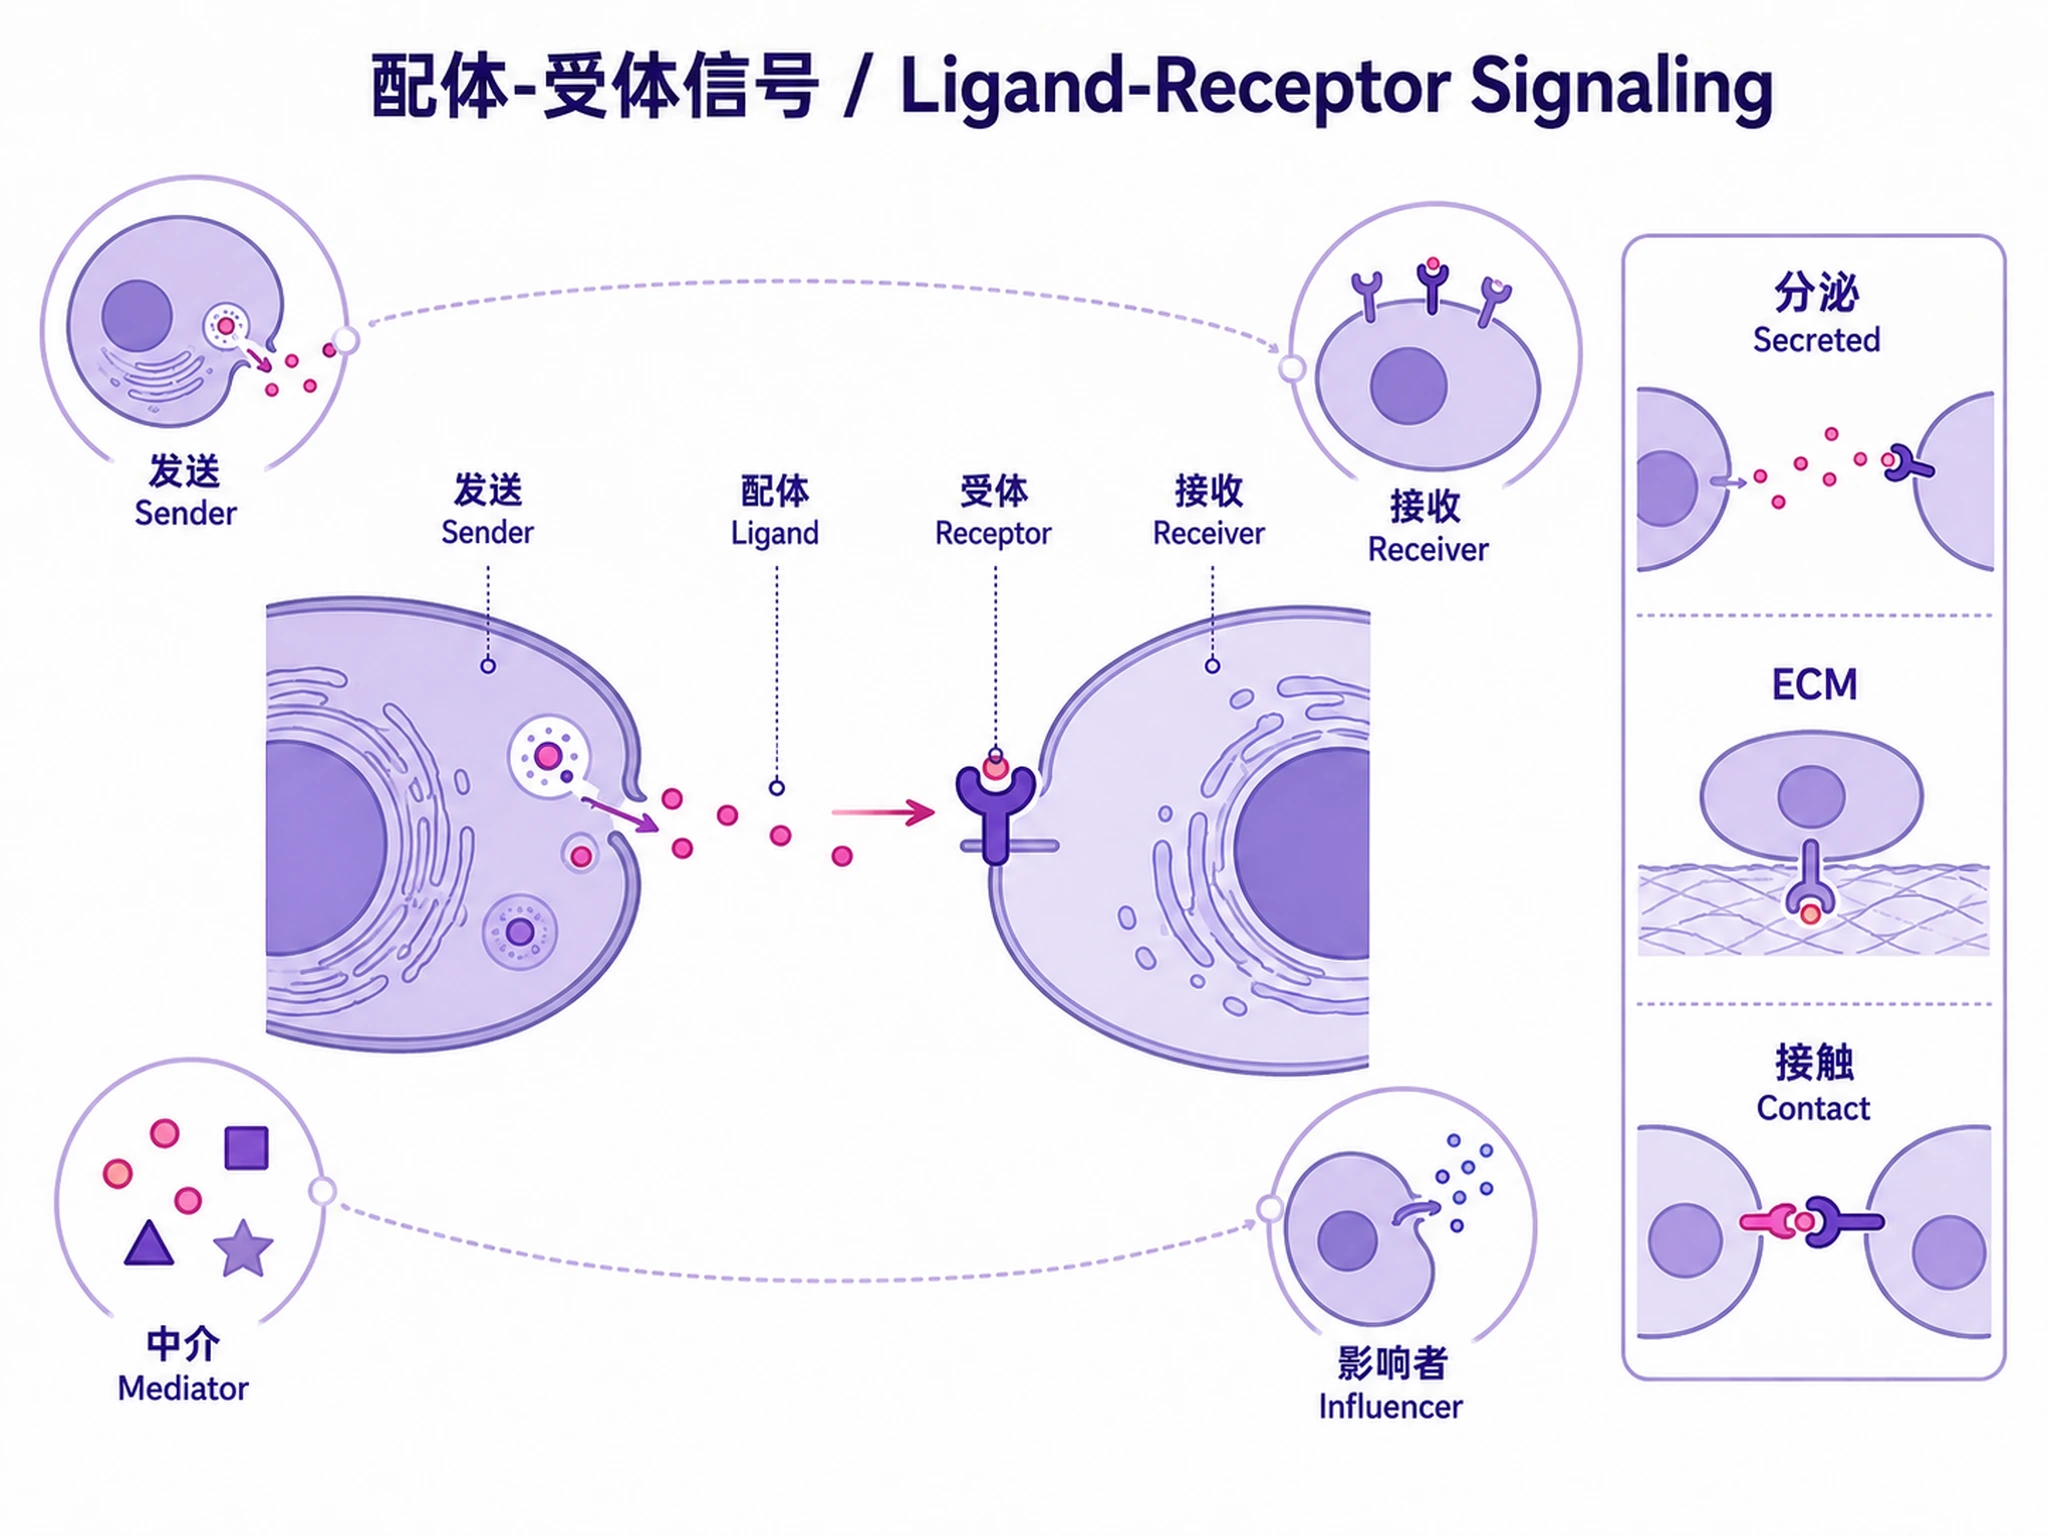
- a) All signaling types (Secreted + ECM-Receptor + Cell-Cell Contact) — ✅ recommended
- b) Secreted signaling only
- c) Cell-Cell Contact only
Standard Workflow
🚨 MANDATORY: USE SCRIPTS EXACTLY AS SHOWN — DO NOT WRITE INLINE CODE 🚨
Step 1 — Load data:
source("scripts/load_data.R")
seurat_obj <- load_cellchat_data()  # example PBMC data
# OR: seurat_obj <- load_cellchat_data("path/to/seurat_processed.rds")
Step 2 — Run CellChat analysis:
source("scripts/run_cellchat.R")
cellchat <- run_cellchat_analysis(seurat_obj, species = "human", group.by = "celltype")
DO NOT write inline CellChat code. Just source the script and call the function.
Step 3 — Generate visualizations:
source("scripts/cellchat_plots.R")
generate_all_plots(cellchat, output_dir = "results")
DO NOT write inline plotting code. Just use the script.
Step 4 — Export results:
source("scripts/export_results.R")
export_all(cellchat, seurat_obj = seurat_obj, output_dir = "results")
DO NOT write custom export code. Use export_all().
✅ VERIFICATION — You should see:
- After Step 1:
"✓ Data loaded successfully! [N] cells, [M] cell types" - After Step 2:
"✓ CellChat analysis completed! [N] significant interactions across [M] pathways" - After Step 3:
"✓ All plots generated successfully! [6] visualizations saved" - After Step 4:
"=== Export Complete ==="
❌ IF YOU DON'T SEE THESE: You wrote inline code. Stop and use source().
⚠️ CRITICAL — DO NOT:
- ❌ Write inline CellChat code → STOP: Use
source("scripts/run_cellchat.R") - ❌ Write inline plotting code → STOP: Use
generate_all_plots() - ❌ Write custom export code → STOP: Use
export_all() - ❌ Try to install system-level dependencies → CellChat handles its own deps
⚠️ IF SCRIPTS FAIL — Script Failure Hierarchy:
- Fix and Retry (90%) — Install missing package, re-run script
- Modify Script (5%) — Edit the script file itself, document changes
- Use as Reference (4%) — Read script, adapt approach, cite source
- Write from Scratch (1%) — Only if genuinely impossible, explain why
NEVER skip directly to writing inline code without trying the script first.
Common Issues
| Issue | Cause | Solution |
|---|---|---|
| CellChat not found | Not installed from GitHub | devtools::install_github("jinworks/CellChat") — must use jinworks repo (not sqjin) |
| "presto" required for Wilcoxon test | Missing presto package | remotes::install_github('immunogenomics/presto') — script falls back to standard test if unavailable |
| No significant interactions | Too few cells per type or stringent filtering | Lower min.cells parameter or merge rare cell types |
| Memory error on large datasets | >50k cells uses substantial RAM | Subsample or increase memory; see references/cellchat-guide.md |
| Chord diagram error | Missing circlize package | install.packages('circlize') |
| SVG export error "svglite required" | Missing optional dependency | Use generate_all_plots() — it handles fallback automatically. DO NOT try to install svglite manually. |
| svglite dependency conflict | System library version mismatch | Normal — generate_all_plots() falls back to base R svg() device automatically. Both PNG and SVG will be created. |
| "group.by not found" | Wrong column name for cell types | Check: colnames(seurat_obj@meta.data) |
| Seurat v5 slot error ("no slot of name images") | Old Seurat object from v3/v4 | Script handles this — UpdateSeuratObject() is called automatically |
| NMF not available | NMF package not installed | install.packages('NMF') |
| PDF report skipped | No LaTeX installation | install.packages('tinytex'); tinytex::install_tinytex() — markdown report still available |
Suggested Next Steps
After cell-cell communication analysis, consider:
- Multi-condition comparison — Compare communication between disease vs healthy, treated vs untreated
- See references/cellchat-guide.md for
mergeCellChat()workflow - Pathway deep dive — Examine specific pathways (e.g., TNF, MHC-II) with hierarchy plots
- Gene regulatory networks — Use
grn-pyscenicto find transcription factors driving the communication - Functional enrichment — Run pathway analysis on sender/receiver gene sets
Related Skills
| Skill | Relationship |
|---|---|
scrnaseq-seurat-core-analysis |
Upstream — produces the annotated Seurat object input |
scrnaseq-scanpy-core-analysis |
Alternative upstream (Python-based, convert to Seurat for CellChat) |
grn-pyscenic |
Complementary — gene regulatory networks from same scRNA-seq data |
References
- Jin S, et al. Inference and analysis of cell-cell communication using CellChat. Nature Communications. 2021;12:1088.
- Jin S, et al. CellChat for systematic analysis of cell-cell communication from single-cell and spatially resolved transcriptomics. Nature Protocols. 2024.
- CellChat v2 GitHub (active)
- CellChat tutorials
- Detailed patterns: references/cellchat-guide.md
- Visualization options: references/visualization-guide.md
Code preview
scripts/cellchat_plots.R
# =============================================================================
# Cell-Cell Communication Analysis — Visualization
# =============================================================================
# Generates 6 publication-quality plots from CellChat analysis results.
# Saves PNG + SVG with graceful SVG fallback.
# =============================================================================

suppressPackageStartupMessages({
    library(CellChat)
    library(ggplot2)
    library(ggprism)
})

# Try to load svglite for high-quality SVG (optional)
.has_svglite <- requireNamespace("svglite", quietly = TRUE)
if (.has_svglite) {
    suppressPackageStartupMessages(library(svglite))
}

# --- Save helpers -----------------------------------------------------------

#' Save a ggplot object to PNG + SVG
.save_ggplot <- function(plot, base_path, width = 8, height = 6, dpi = 300) {
    # Always save PNG
    png_path <- sub("\\.(svg|png)$", ".png", base_path)
    ggsave(png_path, plot = plot, width = width, height = height, dpi = dpi,
           device = "png")
    cat("   Saved:", png_path, "\n")

    # Always try SVG
    svg_path <- sub("\\.(svg|png)$", ".svg", base_path)
    tryCatch({
        ggsave(svg_path, plot = plot, width = width, height = height,
               device = "svg")
        cat("   Saved:", svg_path, "\n")
    }, error = function(e) {
        tryCatch({
            svg(svg_path, width = width, height = height)
            print(plot)
            dev.off()
            cat("   Saved:", svg_path, "\n")
        }, error = function(e2) {
            cat("   (SVG export failed for ggplot)\n")
        })
    })
}

#' Save a base R plot to PNG + SVG using a plot function (closure)
#' @param plot_fn A zero-argument function that draws the plot
.save_base_plot <- function(plot_fn, base_path, width = 8, height = 6,
                            dpi = 300) {
    # Always save PNG
    png_path <- sub("\\.(svg|png)$", ".png", base_path)
    png(png_path, width = width, height = height, units = "in", res = dpi)
    tryCatch(plot_fn(), error = function(e) {
        cat("   ⚠ PNG plot error:", conditionMessage(e), "\n")
    })
    dev.off()
    cat("   Saved:", png_path, "\n")

    # Always try SVG
    svg_path <- sub("\\.(svg|png)$", ".svg", base_path)
    tryCatch({
        svg(svg_path, width = width, height = height)
        plot_fn()
        dev.off()
        cat("   Saved:", svg_path, "\n")
    }, error = function(e) {
        tryCatch(dev.off(), error = function(e2) NULL)
        cat("   (SVG export failed for base plot)\n")
    })
}


# --- Individual Plot Functions -----------------------------------------------

#' Plot 1: Interaction count network (circle plot)
plot_interaction_count_network <- function(cellchat, output_dir) {
    cat("\n   [1/6] Interaction count network...\n")
scripts/export_results.R
# =============================================================================
# Cell-Cell Communication Analysis — Export Results
# =============================================================================
# Exports all CellChat analysis results: CSV tables, CellChat RDS object,
# markdown report, and PDF report (via generate_report.R).
# =============================================================================

suppressPackageStartupMessages({
    library(CellChat)
})

#' Export all CellChat analysis results
#'
#' @param cellchat CellChat object (from run_cellchat_analysis)
#' @param seurat_obj Original Seurat object (optional, for metadata export)
#' @param output_dir Output directory
export_all <- function(cellchat, seurat_obj = NULL, output_dir = "results") {

    cat("\n=== Exporting Results ===\n\n")

    dir.create(output_dir, showWarnings = FALSE, recursive = TRUE)

    # -------------------------------------------------------------------------
    # 1. Significant interactions (all L-R pairs with statistics)
    # -------------------------------------------------------------------------
    cat("1. Significant interactions...\n")
    df_net <- subsetCommunication(cellchat)
    write.csv(df_net, file.path(output_dir, "significant_interactions.csv"),
              row.names = FALSE)
    cat("   Saved:", file.path(output_dir, "significant_interactions.csv"),
        "(", nrow(df_net), "interactions )\n")

    # -------------------------------------------------------------------------
    # 2. Pathway-level summary
    # -------------------------------------------------------------------------
    cat("2. Pathway-level summary...\n")
    df_pathway <- subsetCommunication(cellchat, slot.name = "netP")
    write.csv(df_pathway, file.path(output_dir, "pathway_summary.csv"),
              row.names = FALSE)
    cat("   Saved:", file.path(output_dir, "pathway_summary.csv"),
        "(", nrow(df_pathway), "pathway-level interactions )\n")

    # -------------------------------------------------------------------------
    # 3. Interaction count matrix (cell type × cell type)
    # -------------------------------------------------------------------------
    cat("3. Interaction count matrix...\n")
    count_mat <- cellchat@net$count
    write.csv(count_mat, file.path(output_dir, "interaction_count_matrix.csv"))
    cat("   Saved:", file.path(output_dir, "interaction_count_matrix.csv"), "\n")

    # -------------------------------------------------------------------------
    # 4. Interaction strength matrix (cell type × cell type)
    # -------------------------------------------------------------------------
    cat("4. Interaction strength matrix...\n")
    weight_mat <- cellchat@net$weight
    write.csv(weight_mat, file.path(output_dir, "interaction_strength_matrix.csv"))
    cat("   Saved:", file.path(output_dir, "interaction_strength_matrix.csv"), "\n")

    # -------------------------------------------------------------------------
    # 5. Signaling roles (centrality scores)
    # -------------------------------------------------------------------------
    cat("5. Signaling role scores...\n")
    tryCatch({
        # Extract centrality measures for each pathway
        centr_list <- list()
        pathways <- cellchat@netP$pathways
        for (pw in pathways) {
            pw_centr <- tryCatch(
                cellchat@netP$centr[[pw]],
                error = function(e) NULL
            )
            if (!is.null(pw_centr)) {
                df_pw <- data.frame(
                    pathway = pw,
                    cell_type = names(pw_centr$outdeg),
                    outdeg_sender = pw_centr$outdeg,
                    indeg_receiver = pw_centr$indeg,
                    flowbet_mediator = if (!is.null(pw_centr$flowbet)) pw_centr$flowbet else NA,
                    info_influencer = if (!is.null(pw_centr$info)) pw_centr$info else NA,
                    stringsAsFactors = FALSE
scripts/generate_report.R
# =============================================================================
# Cell-Cell Communication Analysis — PDF Report Generation
# =============================================================================
# Generates a publication-quality PDF report using rmarkdown.
# Falls back gracefully if rmarkdown or tinytex is unavailable.
# =============================================================================

#' Generate PDF report from CellChat analysis
#'
#' @param cellchat CellChat object
#' @param df_net Data frame of significant interactions
#' @param df_pathway Data frame of pathway-level interactions
#' @param output_dir Directory containing plots and for output
generate_report <- function(cellchat, df_net, df_pathway,
                            output_dir = "results") {

    # Check rmarkdown availability
    if (!requireNamespace("rmarkdown", quietly = TRUE)) {
        cat("   rmarkdown not installed — skipping PDF report\n")
        cat("   Install with: install.packages('rmarkdown')\n")
        return(invisible(NULL))
    }

    # Check for PDF rendering capability
    has_tinytex <- requireNamespace("tinytex", quietly = TRUE) &&
                   tinytex::is_tinytex()
    has_xelatex <- nchar(Sys.which("xelatex")) > 0
    has_pdflatex <- nchar(Sys.which("pdflatex")) > 0

    if (!has_tinytex && !has_xelatex && !has_pdflatex) {
        cat("   No LaTeX installation found — skipping PDF report\n")
        cat("   Install with: tinytex::install_tinytex()\n")
        return(invisible(NULL))
    }

    # Create temporary Rmd file
    rmd_path <- file.path(output_dir, "_report.Rmd")
    pdf_path <- file.path(output_dir, "analysis_report.pdf")

    pathways <- cellchat@netP$pathways
    cell_types <- levels(cellchat@idents)
    n_interactions <- nrow(df_net)
    n_pathways <- length(pathways)
    n_celltypes <- length(cell_types)

    # Top pathways
    top_pathways_text <- ""
    if (n_pathways > 0) {
        pathway_prob <- cellchat@netP$prob
        if (!is.null(pathway_prob) && length(dim(pathway_prob)) == 3) {
            pathway_strength <- apply(pathway_prob, 3, sum)
            pathway_strength <- sort(pathway_strength, decreasing = TRUE)
            top_n <- min(10, length(pathway_strength))
            top_pw <- data.frame(
                Pathway = names(pathway_strength)[1:top_n],
                Strength = round(pathway_strength[1:top_n], 4)
            )
            top_pathways_text <- knitr::kable(top_pw, format = "pipe")
            top_pathways_text <- paste(top_pathways_text, collapse = "\n")
        }
    }

    # Top interactions
    top_interactions_text <- ""
    if (n_interactions > 0) {
        df_top <- df_net[order(df_net$prob, decreasing = TRUE), ]
        df_top <- head(df_top, 10)
        ti <- data.frame(
            Source = df_top$source,
            Target = df_top$target,
            Interaction = df_top$interaction_name_2,
            Pathway = df_top$pathway_name,
            Prob = round(df_top$prob, 4)
        )
        top_interactions_text <- knitr::kable(ti, format = "pipe")
        top_interactions_text <- paste(top_interactions_text, collapse = "\n")
    }

    # Find available plot PNGs
    plot_files <- list.files(output_dir, pattern = "\\.png$", full.names = TRUE)
Companion files
| Type | Path | Bytes |
|---|---|---|
| Markdown | references/cellchat-guide.md | 5,911 |
| Markdown | references/visualization-guide.md | 5,776 |
| R | scripts/cellchat_plots.R | 11,118 |
| R | scripts/export_results.R | 11,626 |
| R | scripts/generate_report.R | 6,266 |
| R | scripts/load_data.R | 6,734 |
| R | scripts/run_cellchat.R | 6,725 |
| Markdown | SKILL.md | 10,222 |
| JSON | skill.meta.json | 1,891 |