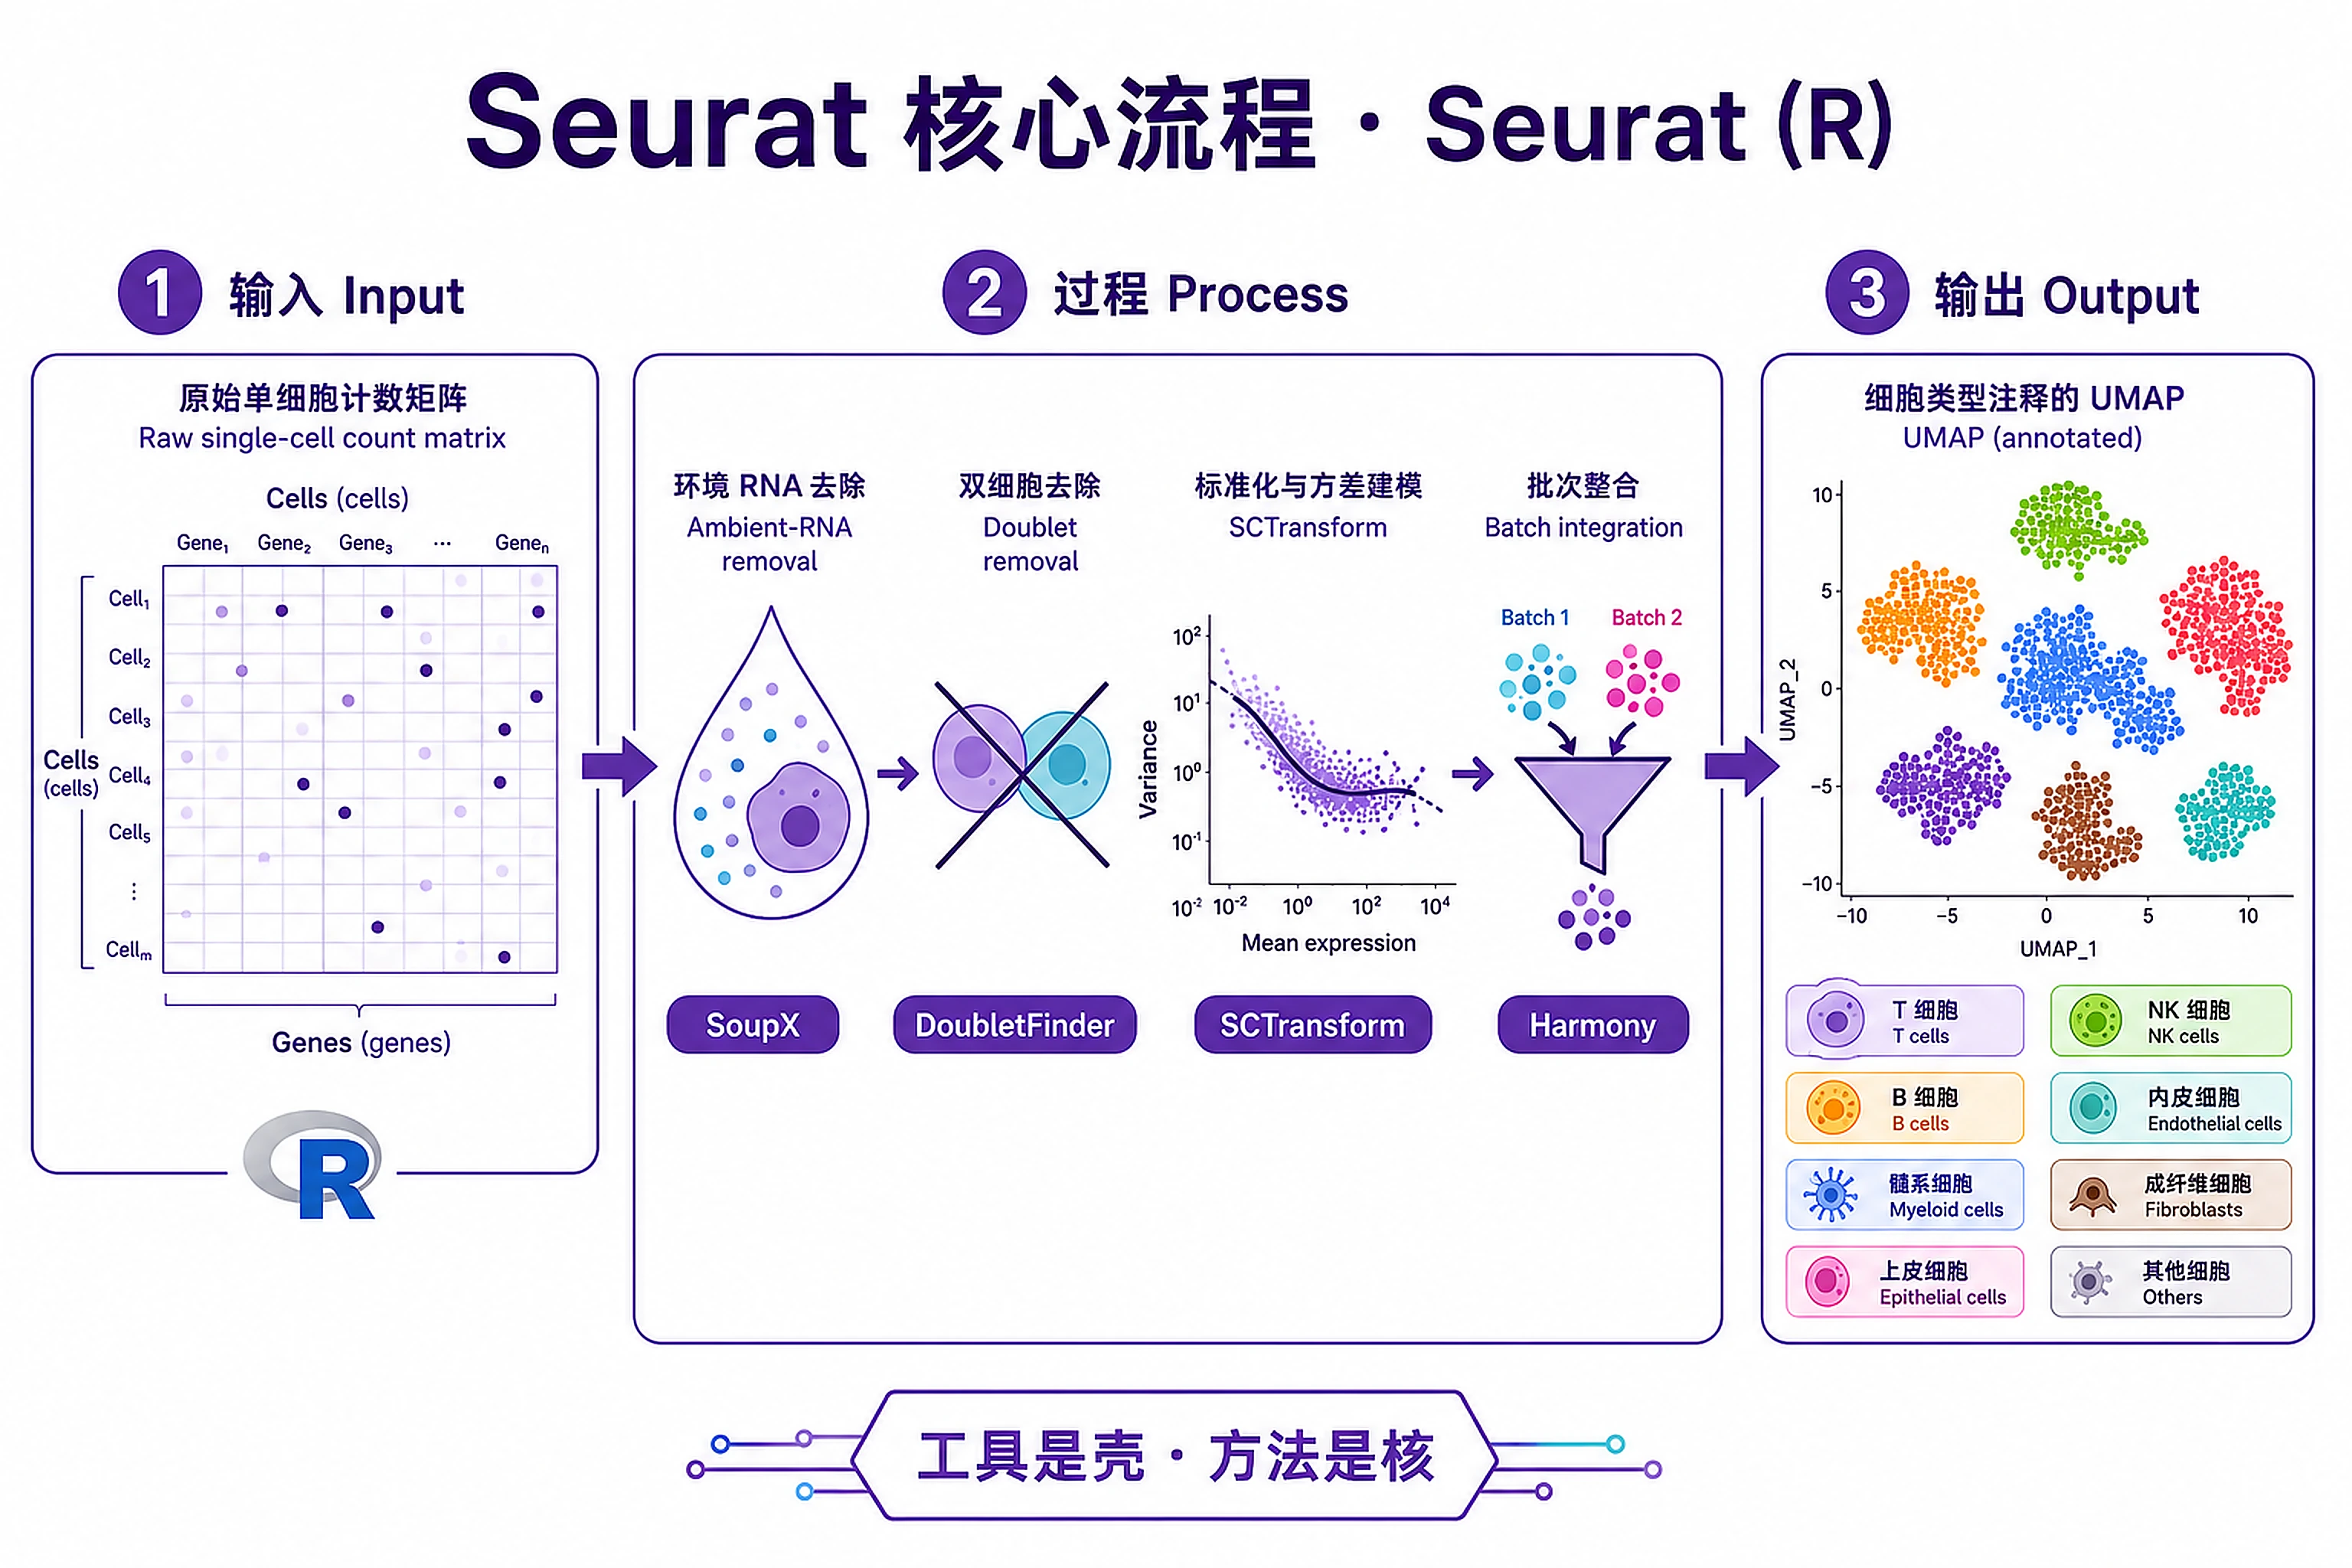
Seurat Core Analysis
The R equivalent of the Scanpy pipeline (Seurat v5).
Overview
Problem. Same, in the R/Seurat ecosystem.
Learning goals
- Same concepts, different tools
- Tools are shells; the method is the core
Figures
Tutorial
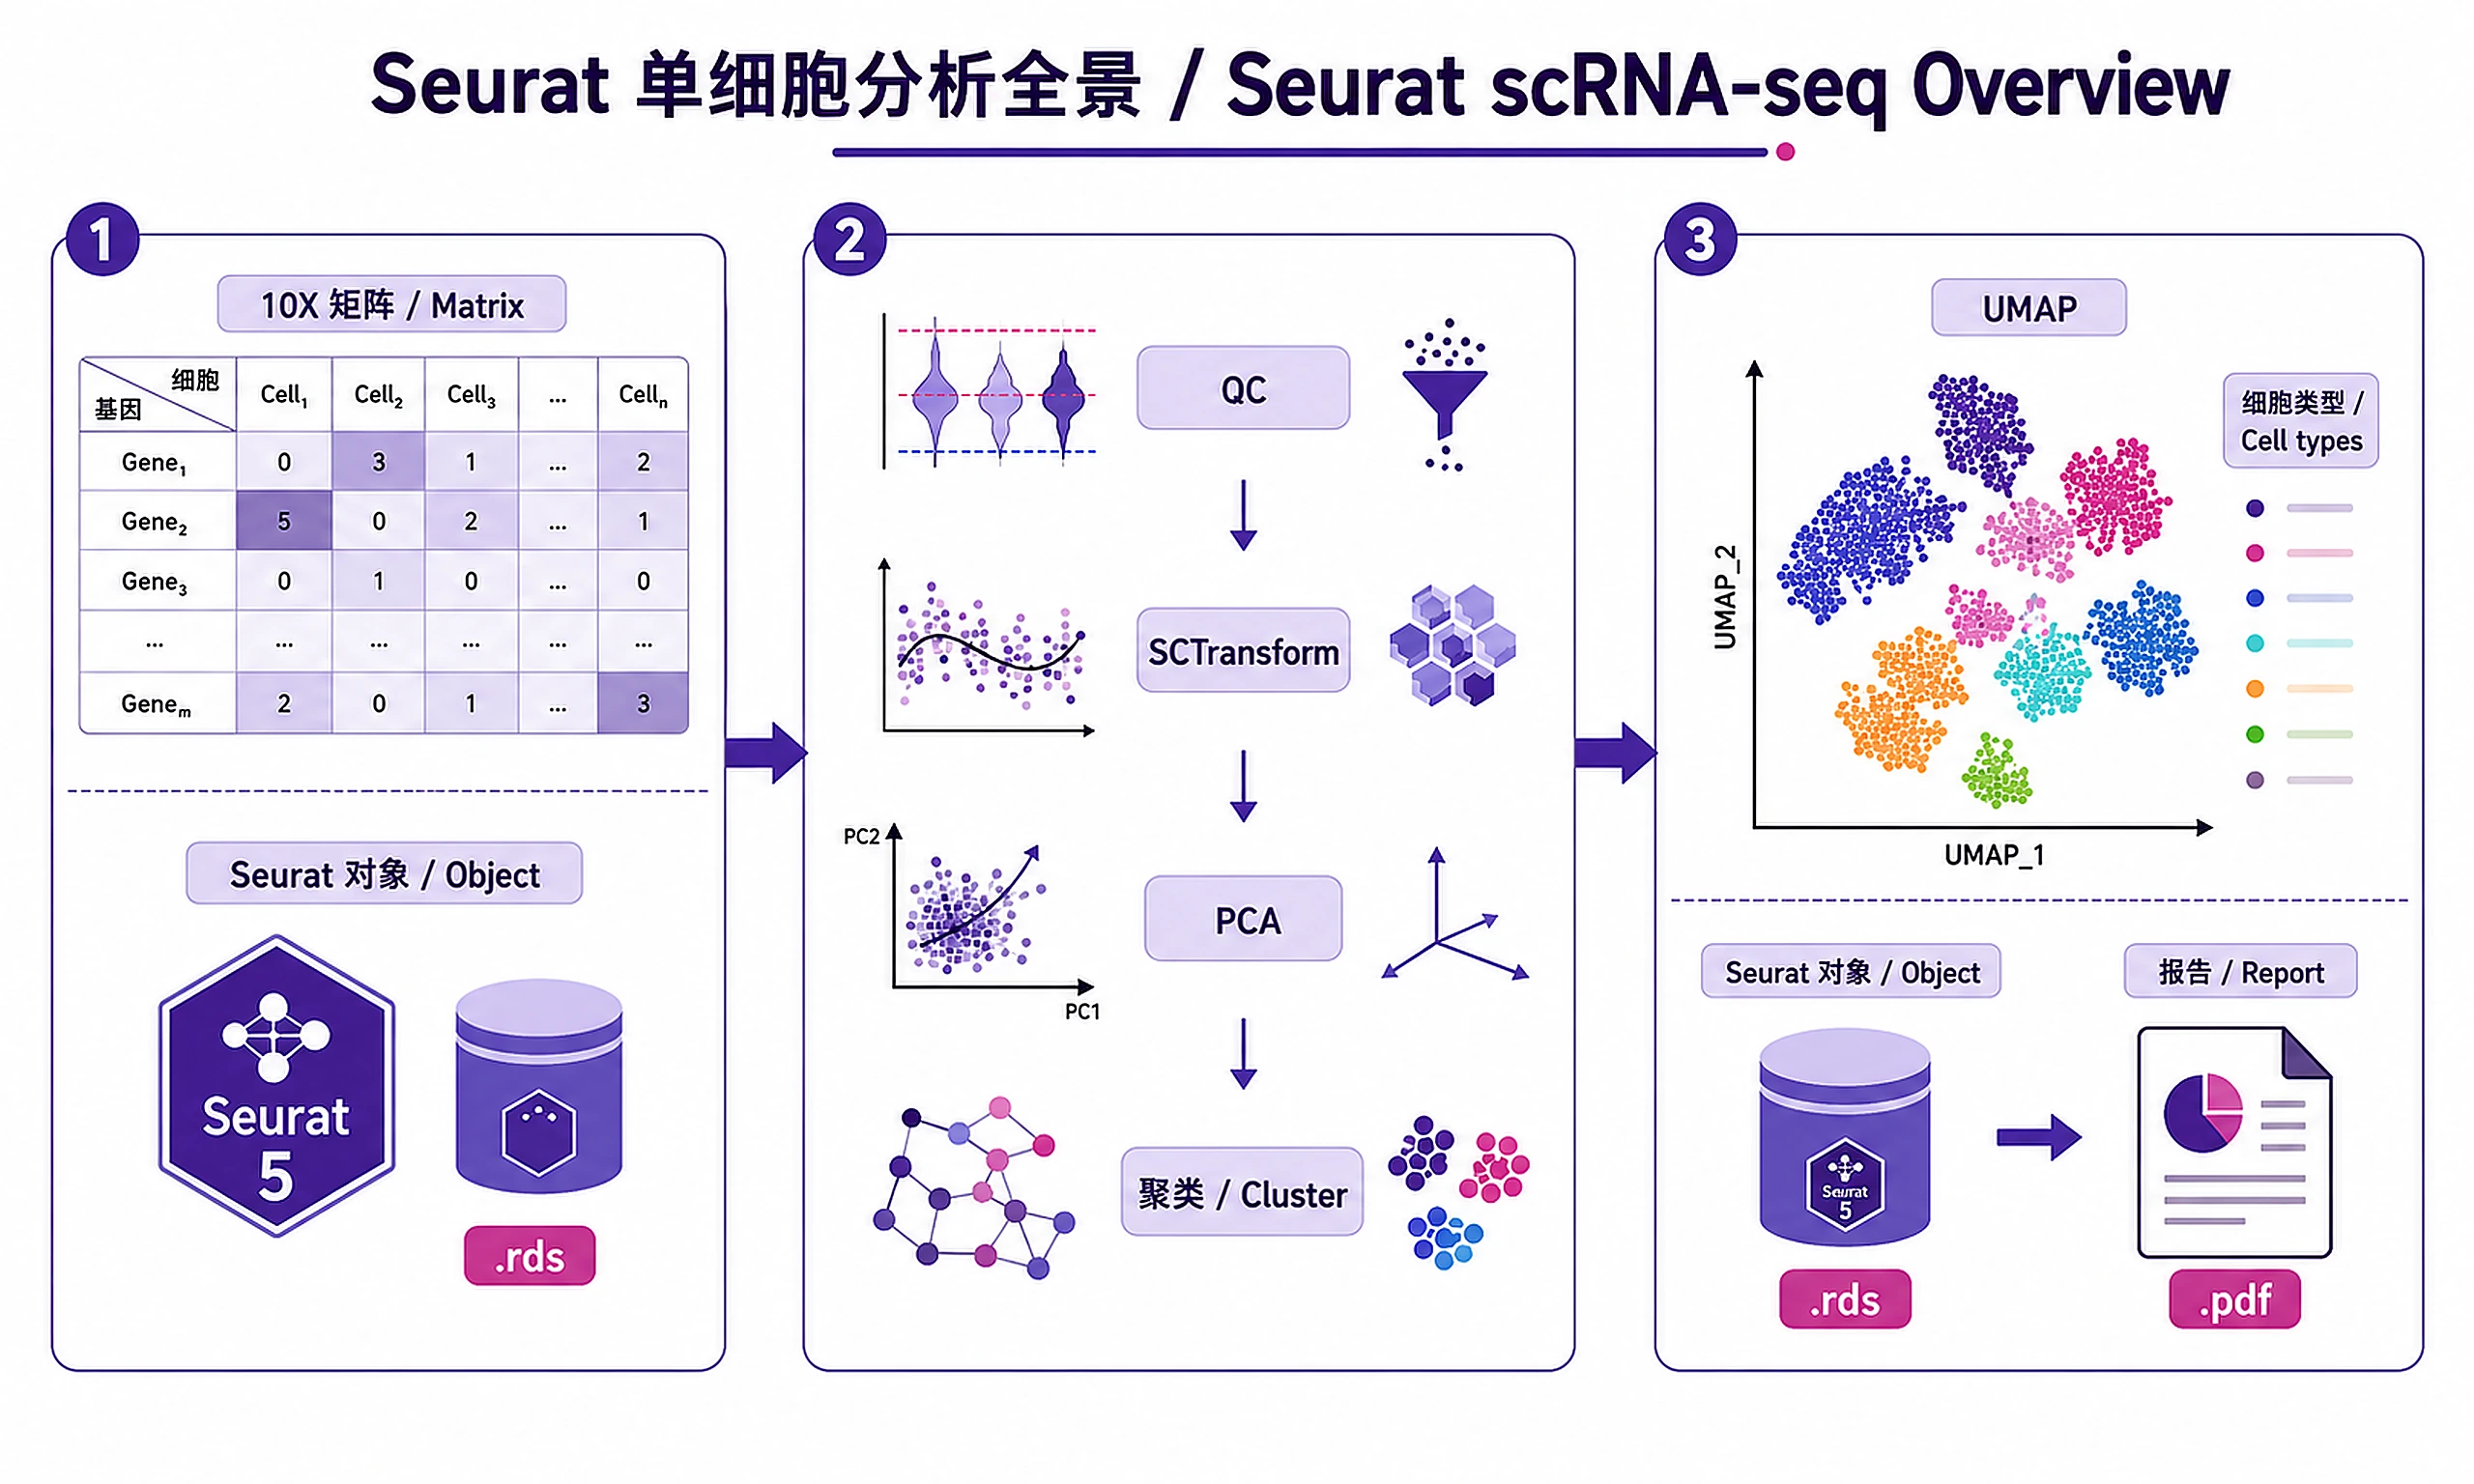
Complete workflow for single-cell RNA-seq analysis using Seurat v5. Process raw data through quality control, normalization, clustering, and cell type annotation with publication-ready visualizations.
When to Use This Skill
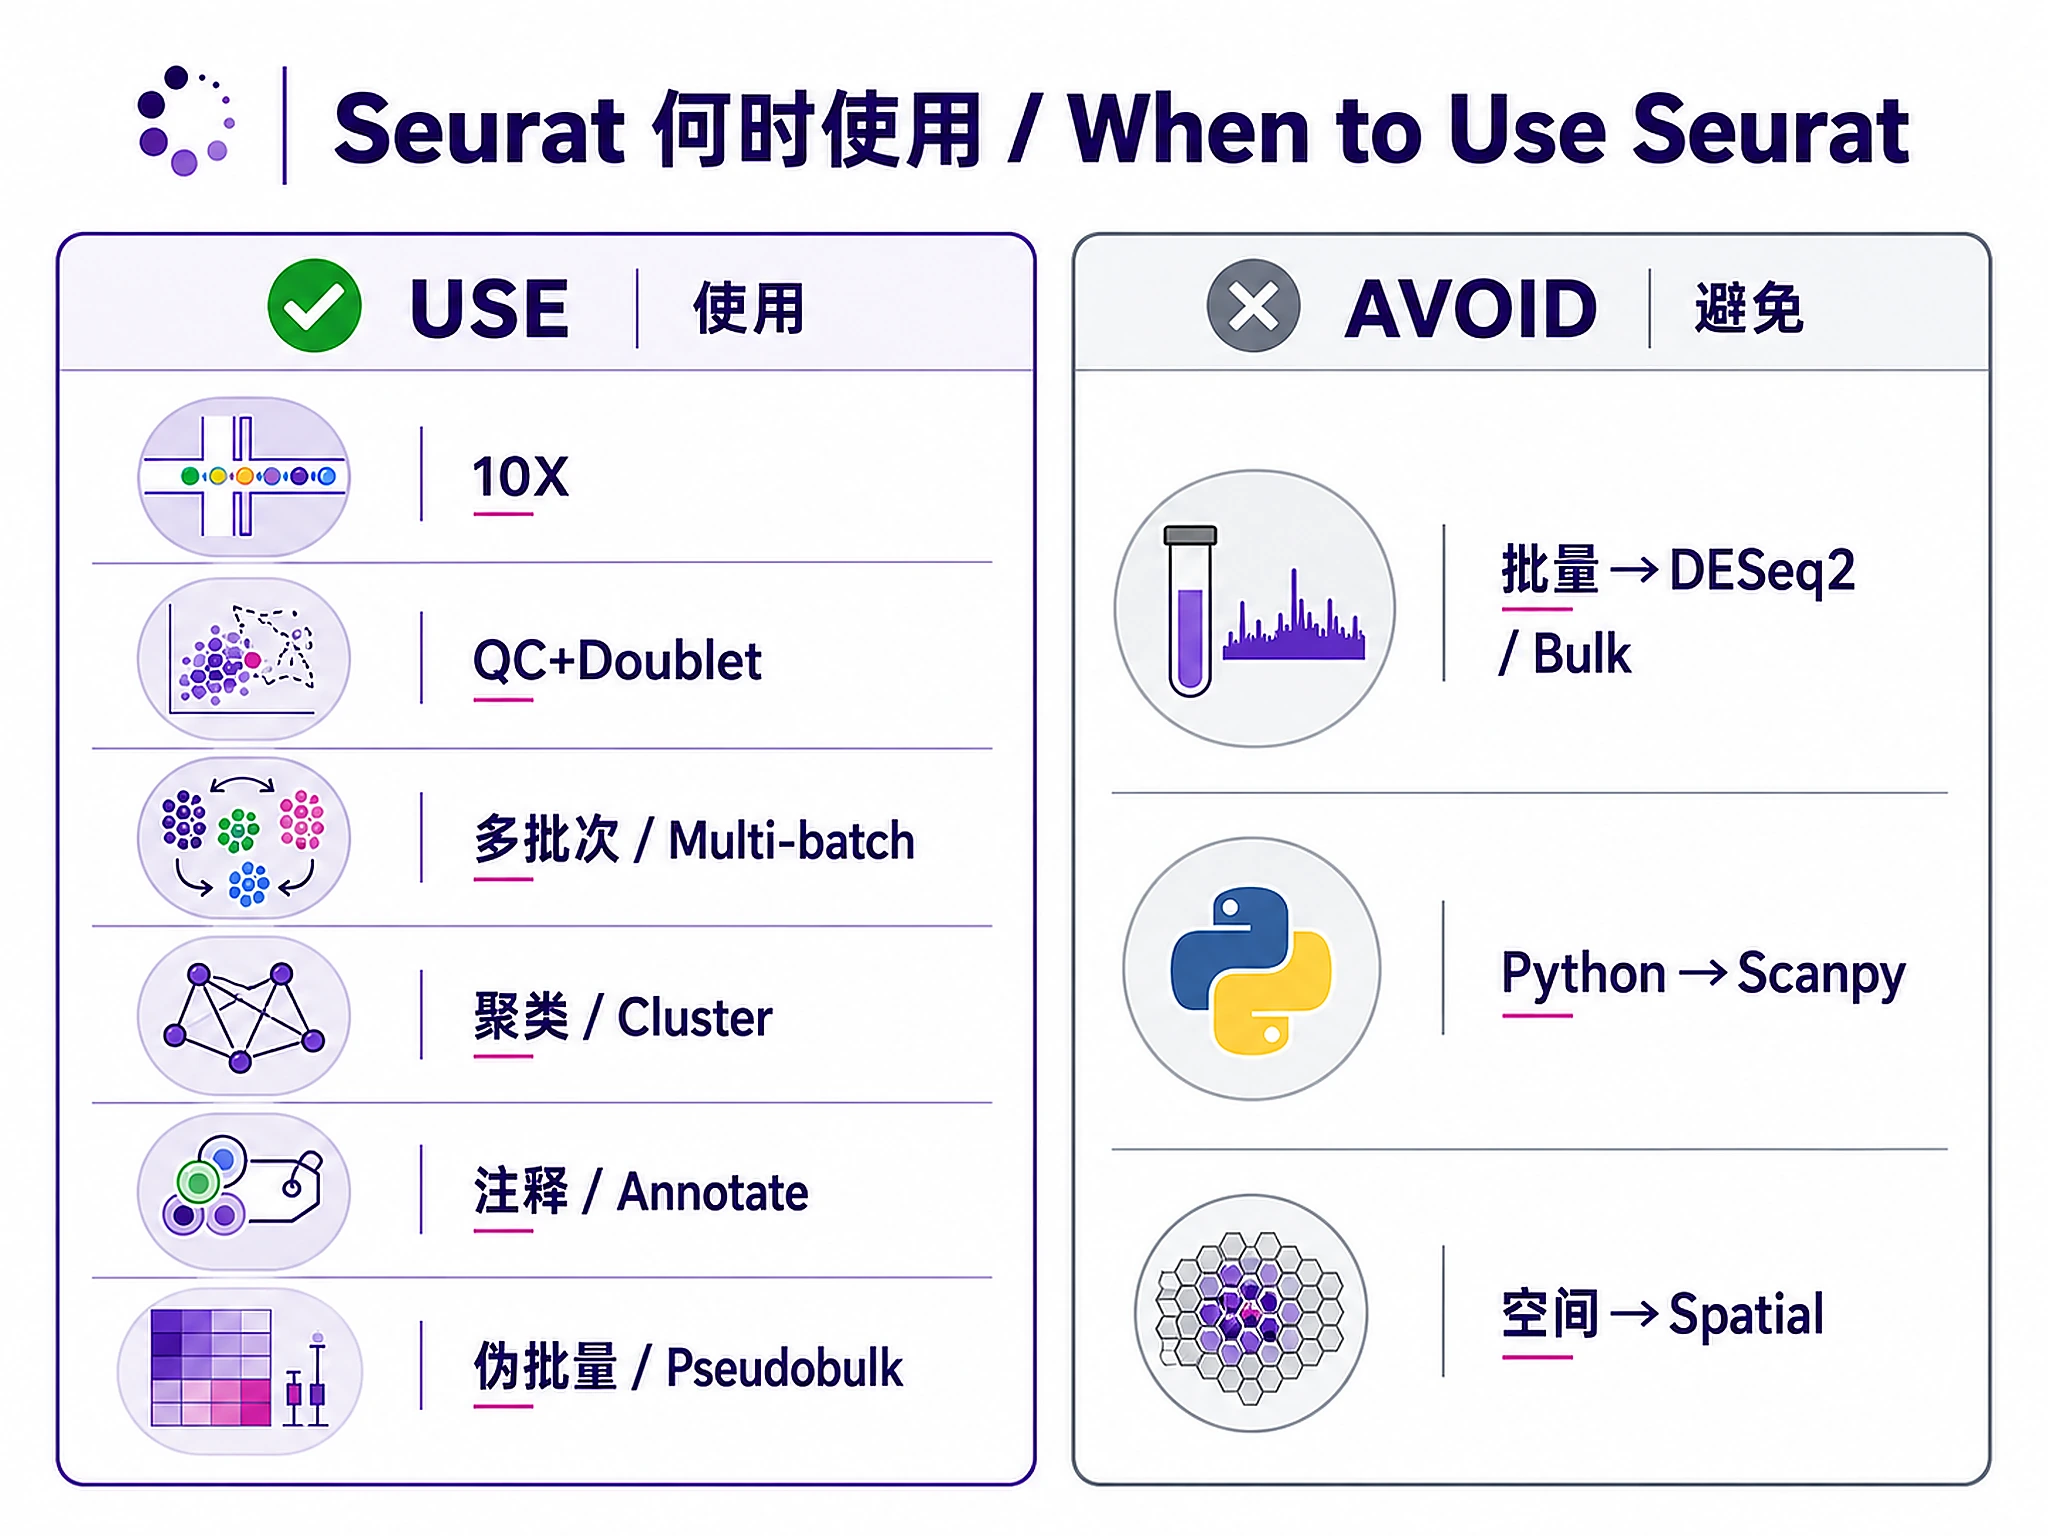
Use this skill when you need to:
- ✅ Analyze 10X Chromium data (CellRanger output, H5 files, raw/filtered matrices)
- ✅ Process Drop-seq, Smart-seq2, or inDrop single-cell RNA-seq data
- ✅ Perform complete QC workflow with adaptive thresholds and doublet detection
- ✅ Integrate multi-batch data using Harmony or Seurat CCA/RPCA
- ✅ Discover cell populations via graph-based clustering with validation
- ✅ Annotate cell types manually or with automated reference-based methods
- ✅ Compare conditions using pseudobulk differential expression (multi-sample data)
Don't use this skill for:
- ❌ Bulk RNA-seq data → Use bulk-rnaseq-counts-to-de-deseq2
- ❌ Python-based scRNA-seq analysis → Use scrnaseq-scanpy-core-analysis
- ❌ Spatial transcriptomics → Use spatial-transcriptomics-seurat (coming soon)
Key Concept: Single-cell RNA-seq captures individual cell transcriptomes, revealing cell type heterogeneity, rare populations, and cell states invisible to bulk methods. This workflow implements Seurat v5 best practices for robust, reproducible analysis.
Installation
Required Software
| Package | Version | License | Commercial Use | Installation |
|---|---|---|---|---|
| Seurat | ≥5.0 | MIT | ✅ Permitted | install.packages("Seurat") |
| ggplot2 | ≥3.4 | MIT | ✅ Permitted | install.packages("ggplot2") |
| ggprism | ≥1.0.4 | GPL-3 | ✅ Permitted | install.packages("ggprism") |
| dplyr | ≥1.0 | MIT | ✅ Permitted | install.packages("dplyr") |
| patchwork | ≥1.1 | MIT | ✅ Permitted | install.packages("patchwork") |
| DoubletFinder | ≥2.0.3 | CC0 | ✅ Permitted | install.packages("DoubletFinder") |
| harmony | ≥0.1.0 | GPL-3 | ✅ Permitted | install.packages("harmony") |
| SoupX | ≥1.5 | GPL-2 | ✅ Permitted | install.packages("SoupX") |
| DESeq2 | ≥1.36 | LGPL | ✅ Permitted | BiocManager::install("DESeq2") |
| muscat | ≥1.10 | GPL-3 | ✅ Permitted | BiocManager::install("muscat") |
| SingleR | ≥2.0 | GPL-3 | ✅ Permitted | BiocManager::install("SingleR") |
| celldex | ≥1.8 | GPL-3 | ✅ Permitted | BiocManager::install("celldex") |
License Compliance: All packages use permissive licenses (MIT, GPL, LGPL, CC0) that permit commercial use in AI agent applications. GPL allows commercial use and distribution.
Minimum versions: R ≥4.1, Seurat ≥5.0
Inputs
Required:
- Raw or filtered count matrix from:
- CellRanger output (
filtered_feature_bc_matrix/orraw_feature_bc_matrix/) - H5 files (
.h5from 10X) - Seurat objects (
.rds) - Count matrices (genes × cells, CSV/TSV)
- SeuratData packages (
pbmc3k,ifnb)
Optional but recommended:
- Sample metadata (CSV/TSV): Sample IDs, conditions, batches, donor IDs
Data requirements:
- Minimum 500 cells per sample (1000+ recommended)
- Human (GRCh38) or Mouse (GRCm39)
- UMI-based (10X, Drop-seq) or read counts (Smart-seq2)
Tissue types: PBMC, brain, tumor, lung, liver, kidney, muscle, custom. See references/qc_guidelines.md for tissue-specific QC thresholds.
Outputs
Processed data:
seurat_processed.rds- Annotated Seurat object for downstream use- Load with:
seurat_obj <- readRDS('seurat_processed.rds') - Note: The default assay data slot contains log-normalized (not scaled) data. Scaled data is used internally for PCA but stored separately. This is correct for downstream analysis (DE, visualization).
- Required for: trajectory analysis, cell-cell communication, advanced visualizations
normalized_counts.csv- Normalized expression matrixnormalized_counts.rds- Normalized counts (sparse format, faster loading)cell_metadata.csv- Cell annotations, clusters, QC metricsumap_coordinates.csv- UMAP embeddingspca_coordinates.csv- PCA embeddings
Visualizations (PNG + SVG at 300 DPI):
- QC plots (violin, scatter, per-batch)
- UMAP plots (clusters, batches, cell types, QC metrics)
- Heatmaps of cluster markers
- Dot plots for cell type markers
- Volcano/MA plots for pseudobulk DE
Differential expression:
cluster_markers_all.csv- Marker genes per cluster (exploratory){celltype}_deseq2_results.csv- Pseudobulk DE per cell type (inferential)
Integration diagnostics (multi-batch):
- LISI/ASW scores, before/after UMAPs
analysis_report.pdf— Comprehensive PDF report with Introduction, Methods, Results, Conclusions, and embedded figures
⚠️ PDF style rules:
- US Letter page size (8.5 × 11 in) — always set page dimensions explicitly; do not rely on library defaults
- No Unicode superscripts — use
3.36e-06or3.36 × 10^(-6), not Unicode superscript chars (they render as ■ in PDF fonts) - No half-empty pages — group headings with their content; only page-break before major sections (Results, Conclusions)
- Figures ≥80% page width — multi-panel figures must be large enough to read; never embed below 50% width
Clarification Questions
Default settings (use unless user specifies otherwise):
- Format: Filtered 10X CellRanger output
- Species: Human
- Tissue: PBMC
- Normalization: SCTransform
- Clustering: Test resolutions 0.4, 0.6, 0.8, 1.0
- Annotation: Manual
Questions to ask only if ambiguous:
1. Input Files (ASK THIS FIRST):
- Do you have specific single-cell data file(s) to analyze?
- If uploaded: Is this the scRNA-seq data you'd like to process?
- Expected formats: 10X CellRanger output (
filtered_feature_bc_matrix/), H5 files (.h5), Seurat objects (.rds), count matrices (CSV/TSV) - Or use example data? (pbmc3k from SeuratData package - see Quick Start below)
2. What format is your data?
- Filtered 10X matrix (default,
filtered_feature_bc_matrix/) - Raw 10X matrix (needs ambient RNA correction)
- H5 file (.h5)
- Seurat object (.rds)
- SeuratData (dataset name)
3. Species and tissue type?
- Human (default) or Mouse
- Tissue: PBMC (default), brain, tumor, lung, liver, kidney, other
4. Multiple samples or batches?
- Single sample (no integration)
- Multiple batches (requires integration: Harmony recommended)
5. Which analyses?
- Ambient RNA correction (raw data or high-soup tissues)
- Doublet detection (recommended)
- Batch integration (multi-batch: Harmony, CCA, or RPCA)
- Cell type annotation (manual, SingleR, or both)
- Pseudobulk DE (condition comparisons)
6. Clustering granularity?
- Coarse (major types): 0.3-0.5
- Standard (default): 0.6-0.8
- Fine (subtypes): 1.0-1.5
- Test multiple: 0.4, 0.6, 0.8, 1.0 (recommended)
Quick Start
Test the workflow with example data in ~15 minutes:
# Load example data
source("scripts/load_example_data.R")
seurat_obj <- load_seurat_data("pbmc3k")

# Load required core scripts
source("scripts/setup_and_import.R")
source("scripts/qc_metrics.R")
source("scripts/filter_cells.R")
source("scripts/normalize_data.R")
source("scripts/scale_and_pca.R")
source("scripts/cluster_cells.R")
source("scripts/run_umap.R")
source("scripts/find_markers.R")
source("scripts/plot_dimreduction.R")
source("scripts/annotate_celltypes.R")
source("scripts/export_results.R")

setup_seurat_libraries()

# QC and filter
seurat_obj <- calculate_qc_metrics(seurat_obj, species = "human") |>
  filter_cells_by_qc(min_features = 200, max_features = 2500, max_mt_percent = 5)

# Normalize and reduce dimensions
seurat_obj <- run_sctransform(seurat_obj, vars_to_regress = "percent.mt") |>
  run_pca_analysis(n_pcs = 30) |>
  run_umap_reduction(dims = 1:30)

# Cluster and find markers
seurat_obj <- cluster_multiple_resolutions(seurat_obj, dims = 1:30, resolutions = c(0.6, 0.8))
all_markers <- find_all_cluster_markers(seurat_obj, resolution = 0.8)

# Visualize
plot_umap_clusters(seurat_obj, output_dir = "results/umap")
plot_top_markers_heatmap(seurat_obj, all_markers, n_top = 10, output_dir = "results/markers")

# Export all results
export_all(seurat_obj, output_dir = "results")
Expected results: ~2,700 PBMC cells in 8-9 major cell types (T cells, B cells, monocytes, NK cells, dendritic cells)
For complete analysis with all QC steps: See assets/eval/complete_example_analysis.R
Standard Workflow
Complete scRNA-seq analysis in 10 steps using modular scripts. CRITICAL: Use relative paths (scripts/, references/). DO NOT construct absolute paths like /mnt/knowhow/
Detailed code examples and explanations: references/workflow-details.md
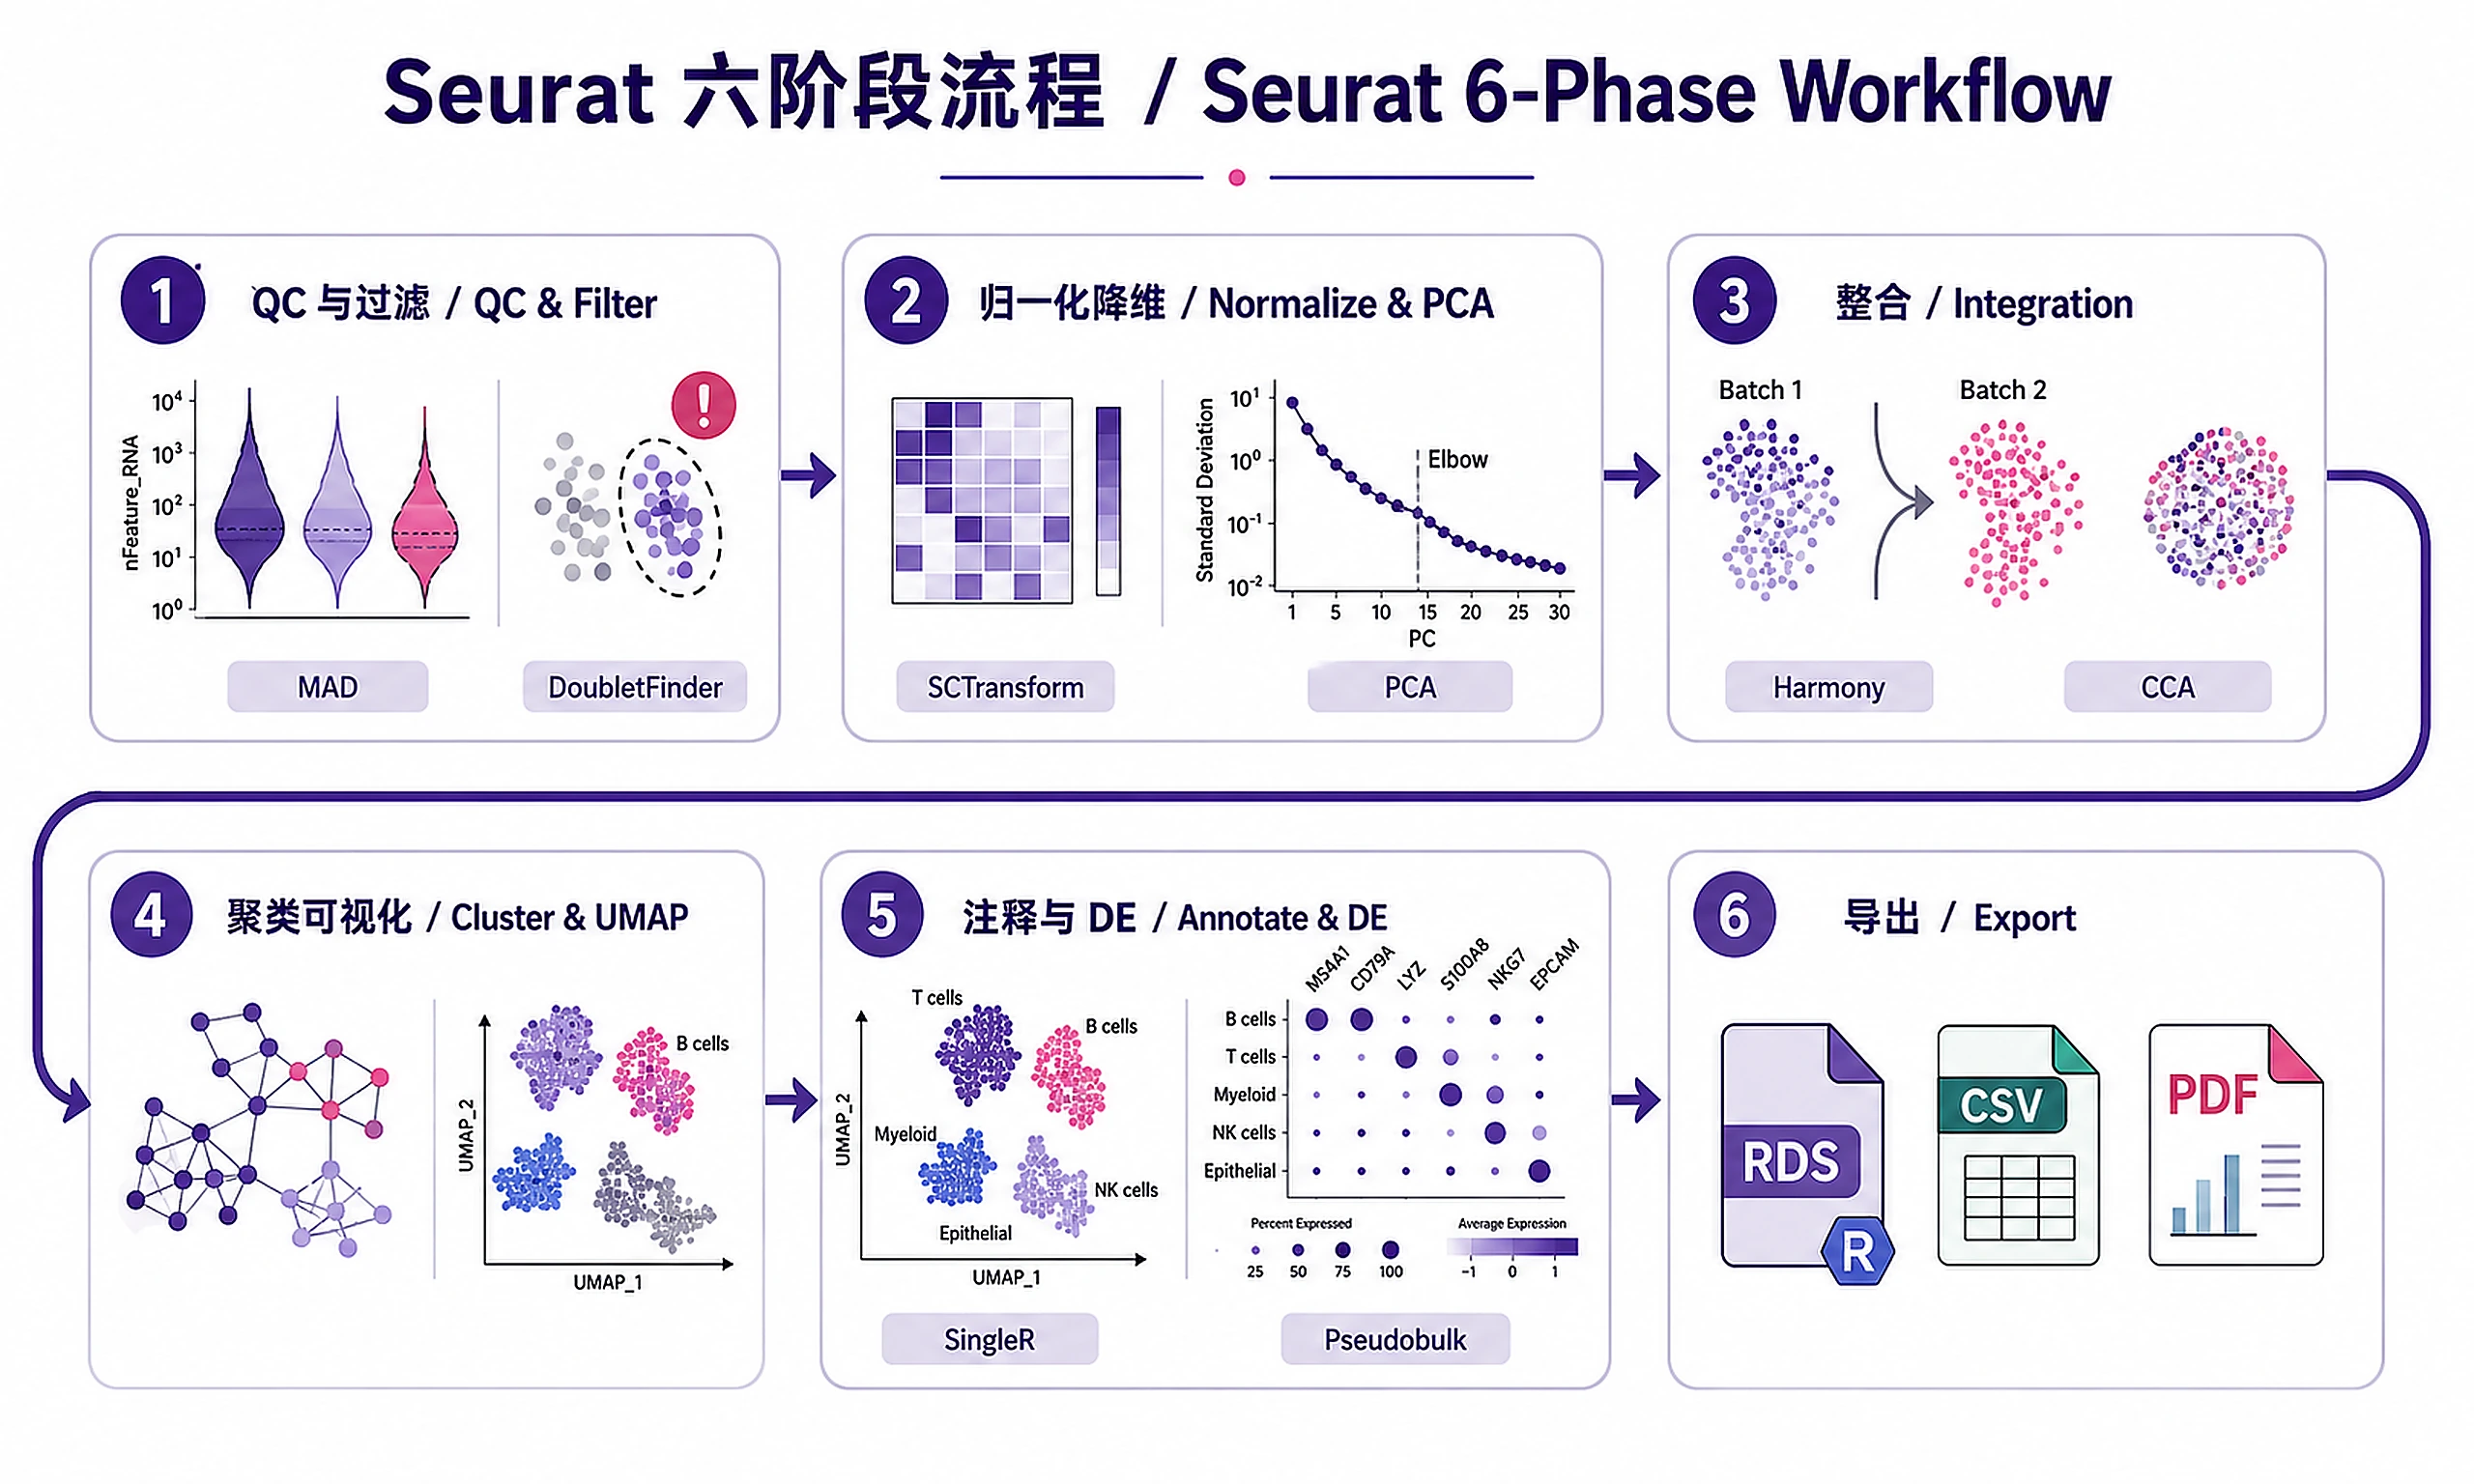
Phase 1: QC and Filtering (Steps 1-3)
Step 1: Ambient RNA Correction
🚨 Execute these function calls directly - do not reimplement:
source("scripts/remove_ambient_rna.R")
seurat_obj <- run_soupx_correction(raw_matrix_dir, filtered_matrix_dir)
✅ VERIFICATION: You should see: "✓ SoupX correction completed successfully!"
When to use: Raw matrices or high-soup tissues (brain, lung, tumor). See references/ambient_rna_correction.md
⚠️ DO NOT write inline SoupX correction code → causes parameter mismatches and inconsistent results
Step 2: Load Data and Calculate QC
🚨 Execute these function calls directly - do not reimplement:
scripts/setup_and_import.R, scripts/qc_metrics.R
source("scripts/setup_and_import.R")
source("scripts/qc_metrics.R")
seurat_obj <- import_10x_data("filtered_feature_bc_matrix/")
seurat_obj <- calculate_qc_metrics(seurat_obj, species = "human")
seurat_obj <- batch_mad_outlier_detection(seurat_obj, batch_col = "batch", nmads = 5)
✅ VERIFICATION: You should see: "✓ QC metrics calculated successfully" and "✓ MAD outlier detection completed"
QC Metrics calculated: nFeature_RNA (genes/cell), nCount_RNA (UMIs/cell), percent.mt (mitochondrial %)
Decision: MAD (adapts to batches) or fixed tissue thresholds. See references/qc_guidelines.md
⚠️ DO NOT write inline QC calculation code → missing mitochondrial gene patterns, incorrect species handling
Step 3: Doublet Detection and Filtering
🚨 Execute these function calls directly - do not reimplement:
source("scripts/filter_cells.R")
seurat_obj <- run_doubletfinder(seurat_obj, batch_col = "batch")
seurat_obj <- filter_by_mad_outliers(seurat_obj, remove_doublets = TRUE)
✅ VERIFICATION: You should see: "✓ DoubletFinder completed successfully" and "✓ Cell filtering completed successfully"
QC checkpoint: Aim for >70% cell retention
⚠️ DO NOT write inline doublet detection code → DoubletFinder has complex parameterization that requires batch-aware setup
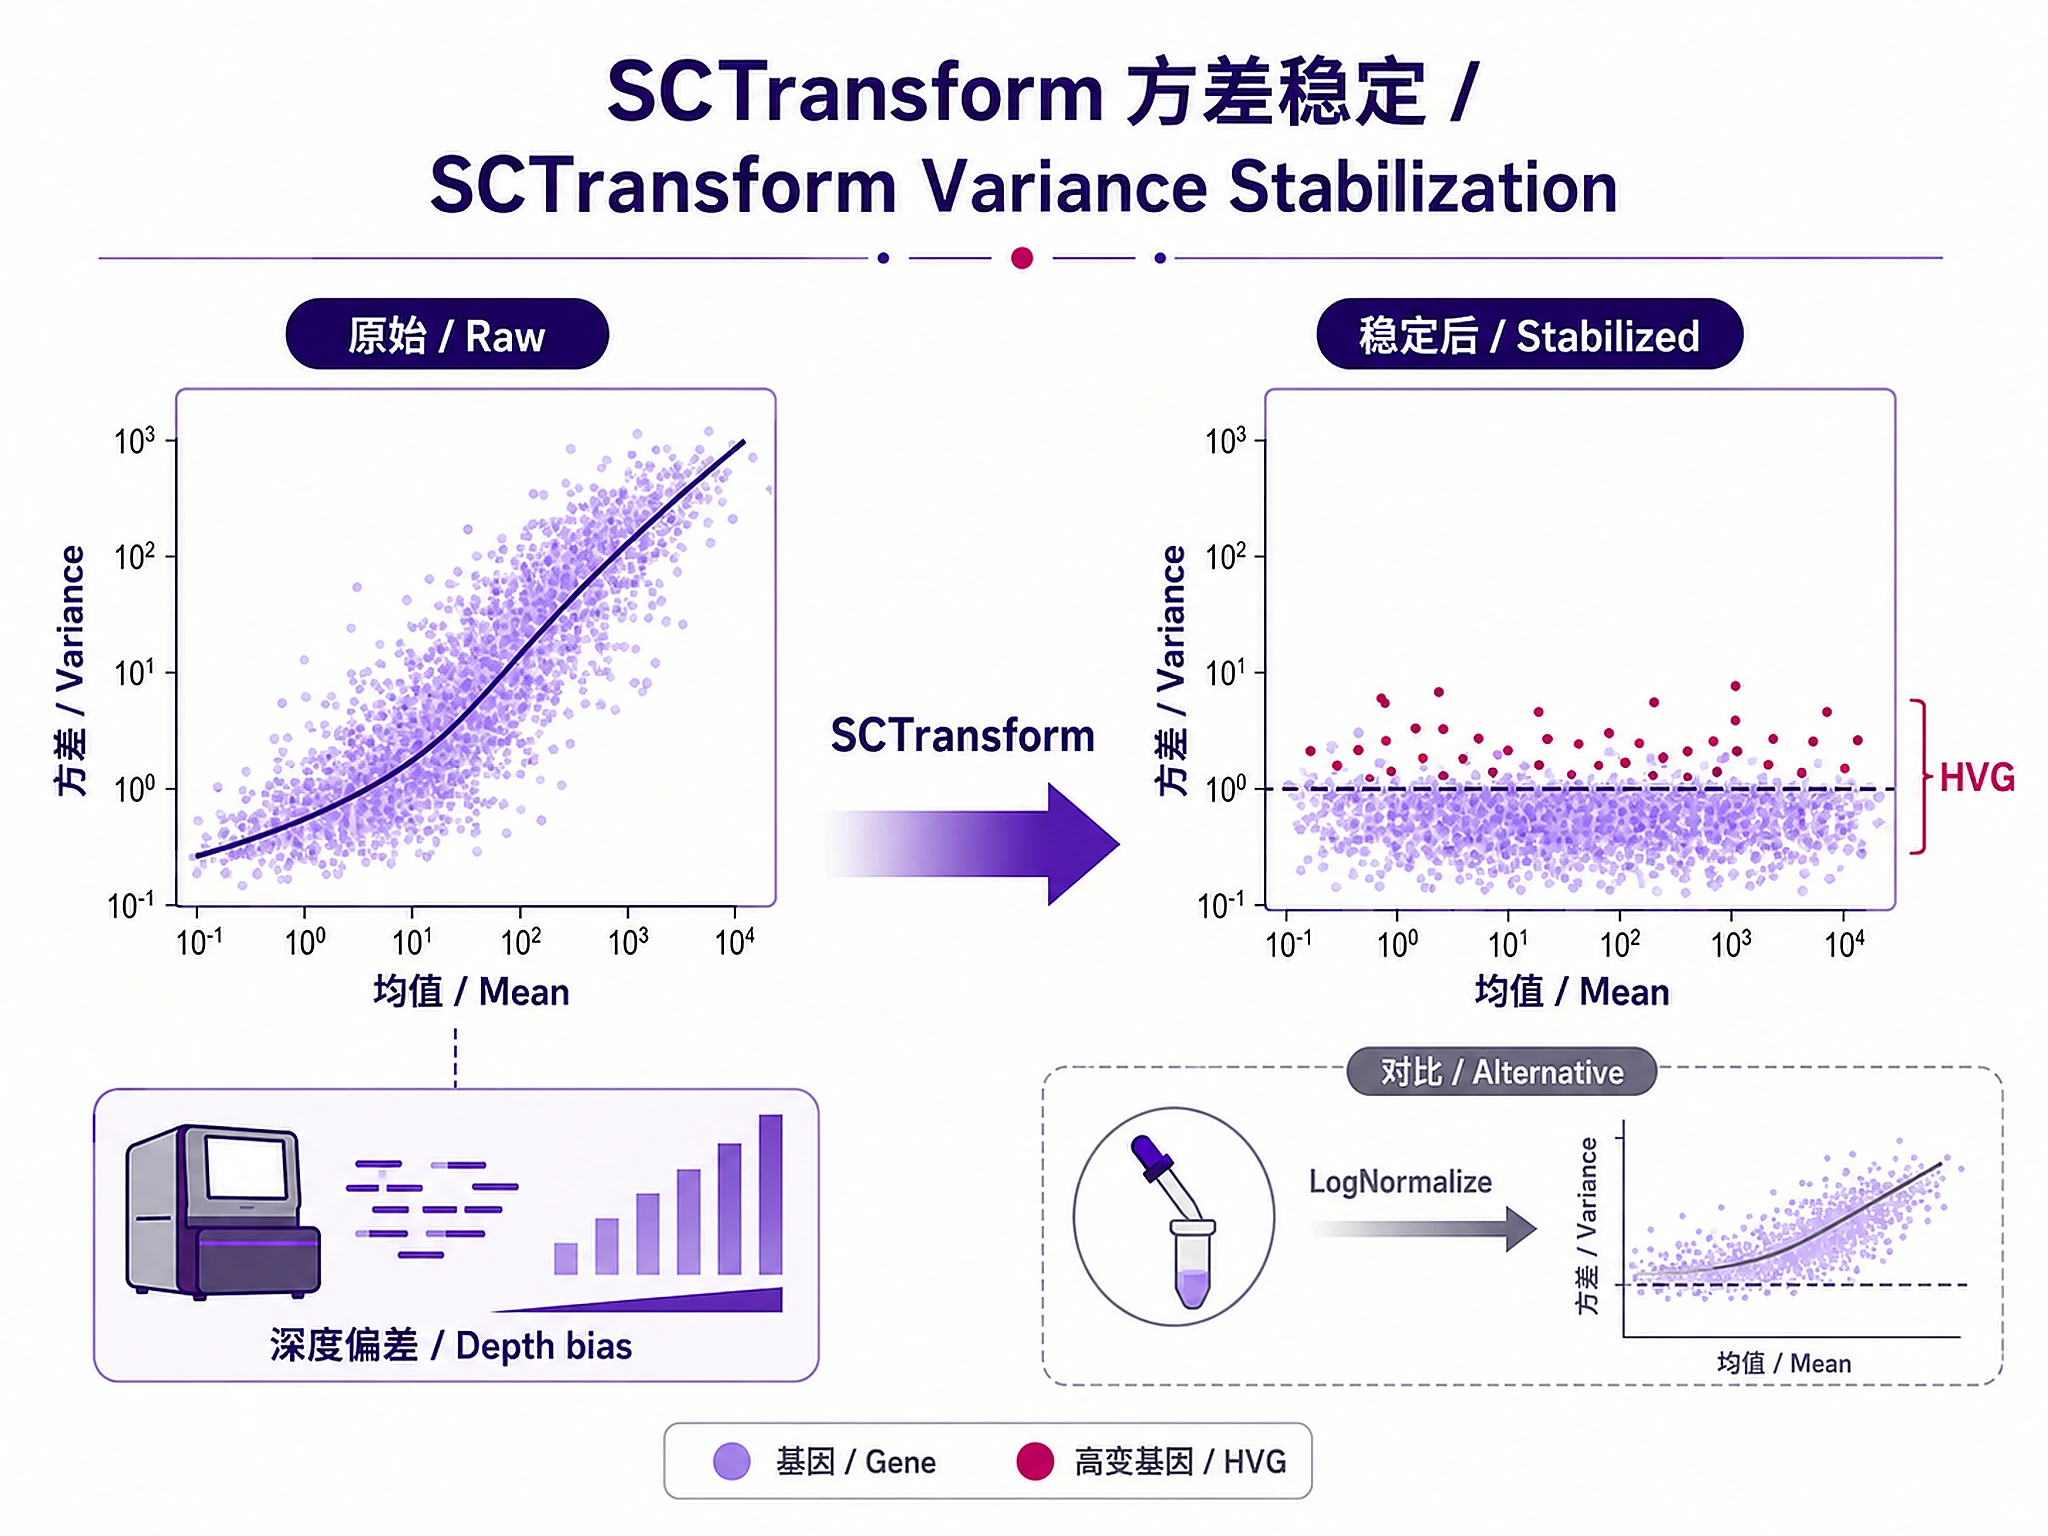
Phase 2: Normalization and Dimensionality Reduction (Steps 4-5)
Step 4: Normalize and Select Features
🚨 Execute these function calls directly - choose ONE normalization method:
source("scripts/normalize_data.R")

# SCTransform (recommended for UMI data)
seurat_obj <- run_sctransform(seurat_obj, vars_to_regress = "percent.mt")

# Alternative: LogNormalize (faster, classic workflow)
seurat_obj <- run_lognormalize(seurat_obj)
✅ VERIFICATION: You should see: "✓ SCTransform normalization completed" or "✓ LogNormalize completed"
Decision: SCTransform (UMI, batch effects) or LogNormalize (speed, non-UMI). See references/seurat_best_practices.md
⚠️ DO NOT write inline normalization code → SCTransform has complex variance stabilization; LogNormalize requires proper scaling
Step 5: PCA and Determine Dimensionality
🚨 Execute these function calls directly:
source("scripts/scale_and_pca.R")
seurat_obj <- run_pca_analysis(seurat_obj, n_pcs = 50)
plot_elbow(seurat_obj, output_dir = "results/pca")
✅ VERIFICATION:
"PCA loadings verified: N variable features used"— if you see a WARNING about feature count mismatch, check feature selection- Cumulative variance printed for PC1-10, PC1-20, PC1-30
- After PCA, call
suggest_n_pcs(seurat_obj)to get recommended PC count for Step 7
Decision: Look for "elbow" in scree plot. Standard: 20-30 PCs. NEVER use <15 PCs. Use suggest_n_pcs() for data-driven recommendation.
⚠️ DO NOT write inline PCA code → missing proper feature selection and scaling steps
Phase 3: Integration (Step 6 - Multi-Batch Only)
Step 6: Batch Integration
🚨 Execute these function calls directly - skip if single-batch data:
scripts/integrate_batches.R, scripts/integration_diagnostics.R
source("scripts/integrate_batches.R")
source("scripts/integration_diagnostics.R")

# Harmony (fast, recommended)
seurat_obj <- run_harmony_integration(seurat_obj, batch_var = "batch", dims_use = 1:30)

# Validate integration
lisi_scores <- compute_lisi_scores(seurat_obj, batch_var = "batch", reduction = "harmony")
✅ VERIFICATION: You should see: "✓ Harmony integration completed successfully" and LISI score summary
Success criteria: Batch LISI ≈1 (good mixing), cell type LISI preserved. See references/integration_methods.md
⚠️ DO NOT write inline Harmony/CCA integration code → complex parameter tuning and batch handling required
Phase 4: Clustering and Visualization (Steps 7-8)
Step 7: Clustering and UMAP
🚨 Execute these function calls directly:
scripts/cluster_cells.R, scripts/run_umap.R
source("scripts/cluster_cells.R")
source("scripts/run_umap.R")

reduction <- if ("harmony" %in% names(seurat_obj@reductions)) "harmony" else "pca"
# Default dims=1:30 is standard. NEVER use <15 PCs.
seurat_obj <- cluster_multiple_resolutions(seurat_obj, dims = 1:30, reduction = reduction, resolutions = c(0.4, 0.6, 0.8, 1.0))
seurat_obj <- run_umap_reduction(seurat_obj, dims = 1:30, reduction = reduction)
⚠️ dims for clustering: Default is 1:30 (standard). Using <15 PCs risks collapsing distinct populations. If you used suggest_n_pcs() in Step 5, pass 1:suggested_pcs here.
✅ VERIFICATION: You should see: "✓ Clustering completed at X resolutions" and "✓ UMAP completed successfully"
⚠️ DO NOT write inline clustering code → graph construction and Louvain algorithm have many hyperparameters
Step 8: Find Markers and Visualize
🚨 Execute these function calls directly:
scripts/find_markers.R, scripts/plot_dimreduction.R
source("scripts/find_markers.R")
source("scripts/plot_dimreduction.R")

all_markers <- find_all_cluster_markers(seurat_obj, resolution = 0.8)
plot_umap_clusters(seurat_obj, output_dir = "results/umap")
plot_top_markers_heatmap(seurat_obj, all_markers, n_top = 10)
✅ VERIFICATION:
"✓ Found markers for X clusters"and plots saved in results/umap/- After
find_all_cluster_markers(): verify the returned DataFrame and printhead(all_markers)to confirm values are sensible before saving to CSV.
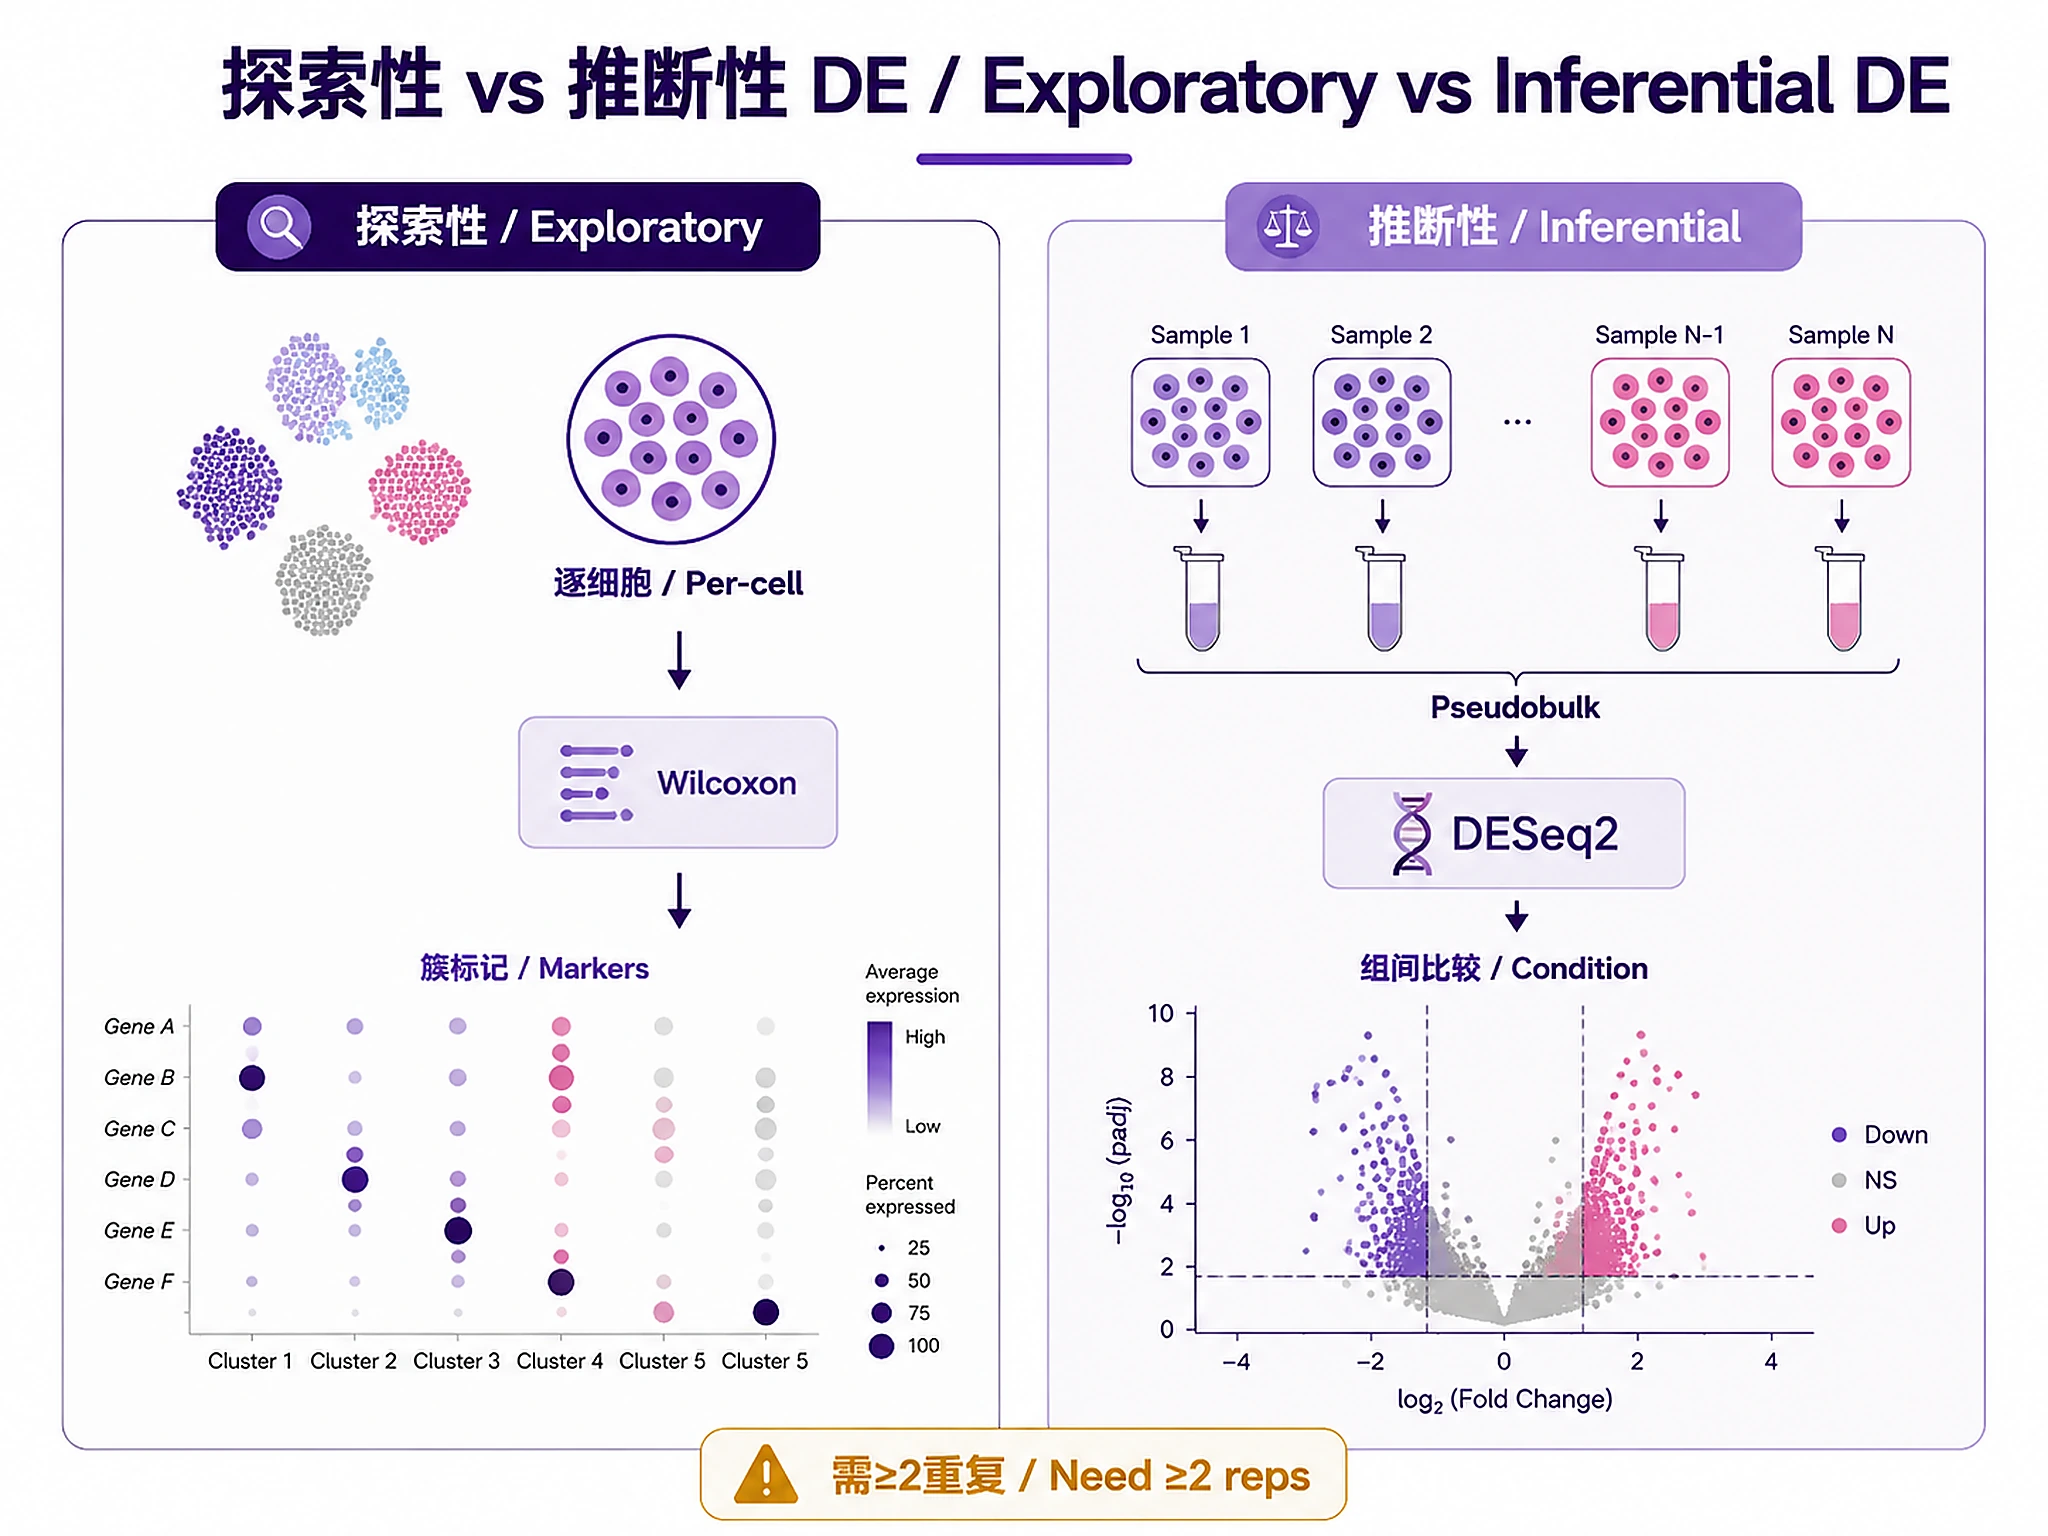
Important: Exploratory DE for characterizing clusters. For condition comparisons, use pseudobulk (Step 10).
⚠️ DO NOT write inline marker finding or plotting code (ggsave, ggplot, DimPlot, FeaturePlot, etc.) → publication-quality plots require ggprism/ggrepel; marker tests need proper multiple testing correction. Scripts handle PNG + SVG export with graceful fallback.
Phase 5: Annotation and Differential Expression (Steps 9-10)
Step 9: Annotate Cell Types
For manual annotation (recommended):
source("scripts/annotate_celltypes.R")

# Define annotations based on marker genes
annotations <- c("0" = "CD4 T cells", "1" = "CD14+ Monocytes", ...)
seurat_obj <- annotate_clusters_manual(seurat_obj, annotations, resolution = 0.8)
For automated annotation:
seurat_obj <- annotate_with_singler(seurat_obj, reference = "HPCA")
✅ VERIFICATION: You should see: "✓ Cell type annotation completed" and updated metadata
Decision: Manual (accurate) vs Automated (fast). See references/marker_gene_database.md
Step 10: Pseudobulk DE
🚨 Execute these function calls directly:
source("scripts/pseudobulk_de.R")

pseudobulk_data <- aggregate_to_pseudobulk(seurat_obj, sample_col = "sample_id", celltype_col = "cell_type")
de_results <- run_pseudobulk_deseq2(pseudobulk_data, formula = "~ batch + condition", contrast = c("condition", "treated", "control"))
✅ VERIFICATION: You should see: "✓ Pseudobulk aggregation completed" and "✓ DESeq2 analysis completed"
Critical: Exploratory (Step 8, Wilcoxon on cells) vs Inferential (Step 10, DESeq2 on pseudobulk). See references/pseudobulk_de_guide.md
⚠️ DO NOT write inline pseudobulk aggregation or DESeq2 code → requires proper sample-level aggregation and statistical modeling
Phase 6: Export Results (Step 11)
Step 11: Export All Results
🚨 MANDATORY: USE export_all() - DO NOT WRITE CUSTOM EXPORT CODE 🚨
source("scripts/export_results.R")
export_all(seurat_obj, output_dir = "results", all_markers = all_markers)
DO NOT write custom export code. Use export_all().
✅ VERIFICATION: You MUST see: "=== Export Complete ==="
What gets exported:
- Seurat object (RDS) for downstream analysis
- Normalized counts (CSV + RDS)
- Cell metadata with clusters and annotations
- UMAP/PCA coordinates
- Marker gene tables (if all_markers provided)
- Summary statistics
⚠️ DO NOT write inline export code → missing RDS objects breaks downstream skills
That's it! The scripts handle all complex operations automatically.
What the scripts provide:
- scripts/setup_and_import.R - Data import functions for 10X, H5, and matrix formats
- scripts/qc_metrics.R - Comprehensive QC with species-aware mitochondrial detection
- scripts/filter_cells.R - DoubletFinder integration and MAD-based filtering
- scripts/normalize_data.R - SCTransform and LogNormalize workflows
- scripts/integrate_batches.R - Harmony, CCA, RPCA integration methods
- scripts/plot_dimreduction.R - Publication-quality plots with automatic SVG fallback handling
- scripts/pseudobulk_de.R - Proper pseudobulk aggregation and DESeq2 analysis
⚠️ CRITICAL ENFORCEMENT RULES:
DO NOT:
- ❌ Write inline plotting code (ggsave, DimPlot, FeaturePlot, etc.) → Use plotting scripts
- ❌ Write inline analysis code → Use provided workflow scripts
- ❌ Try to install svglite → scripts handle SVG fallback automatically
⚠️ IF SCRIPTS FAIL - Script Failure Hierarchy:
- Fix and Retry (90%) - Install missing package, re-run script
- Modify Script (5%) - Edit the script file itself, document changes
- Use as Reference (4%) - Read script, adapt approach, cite source
- Write from Scratch (1%) - Only if genuinely impossible, explain why
NEVER skip directly to writing inline code without trying the script first.
Decision Guide
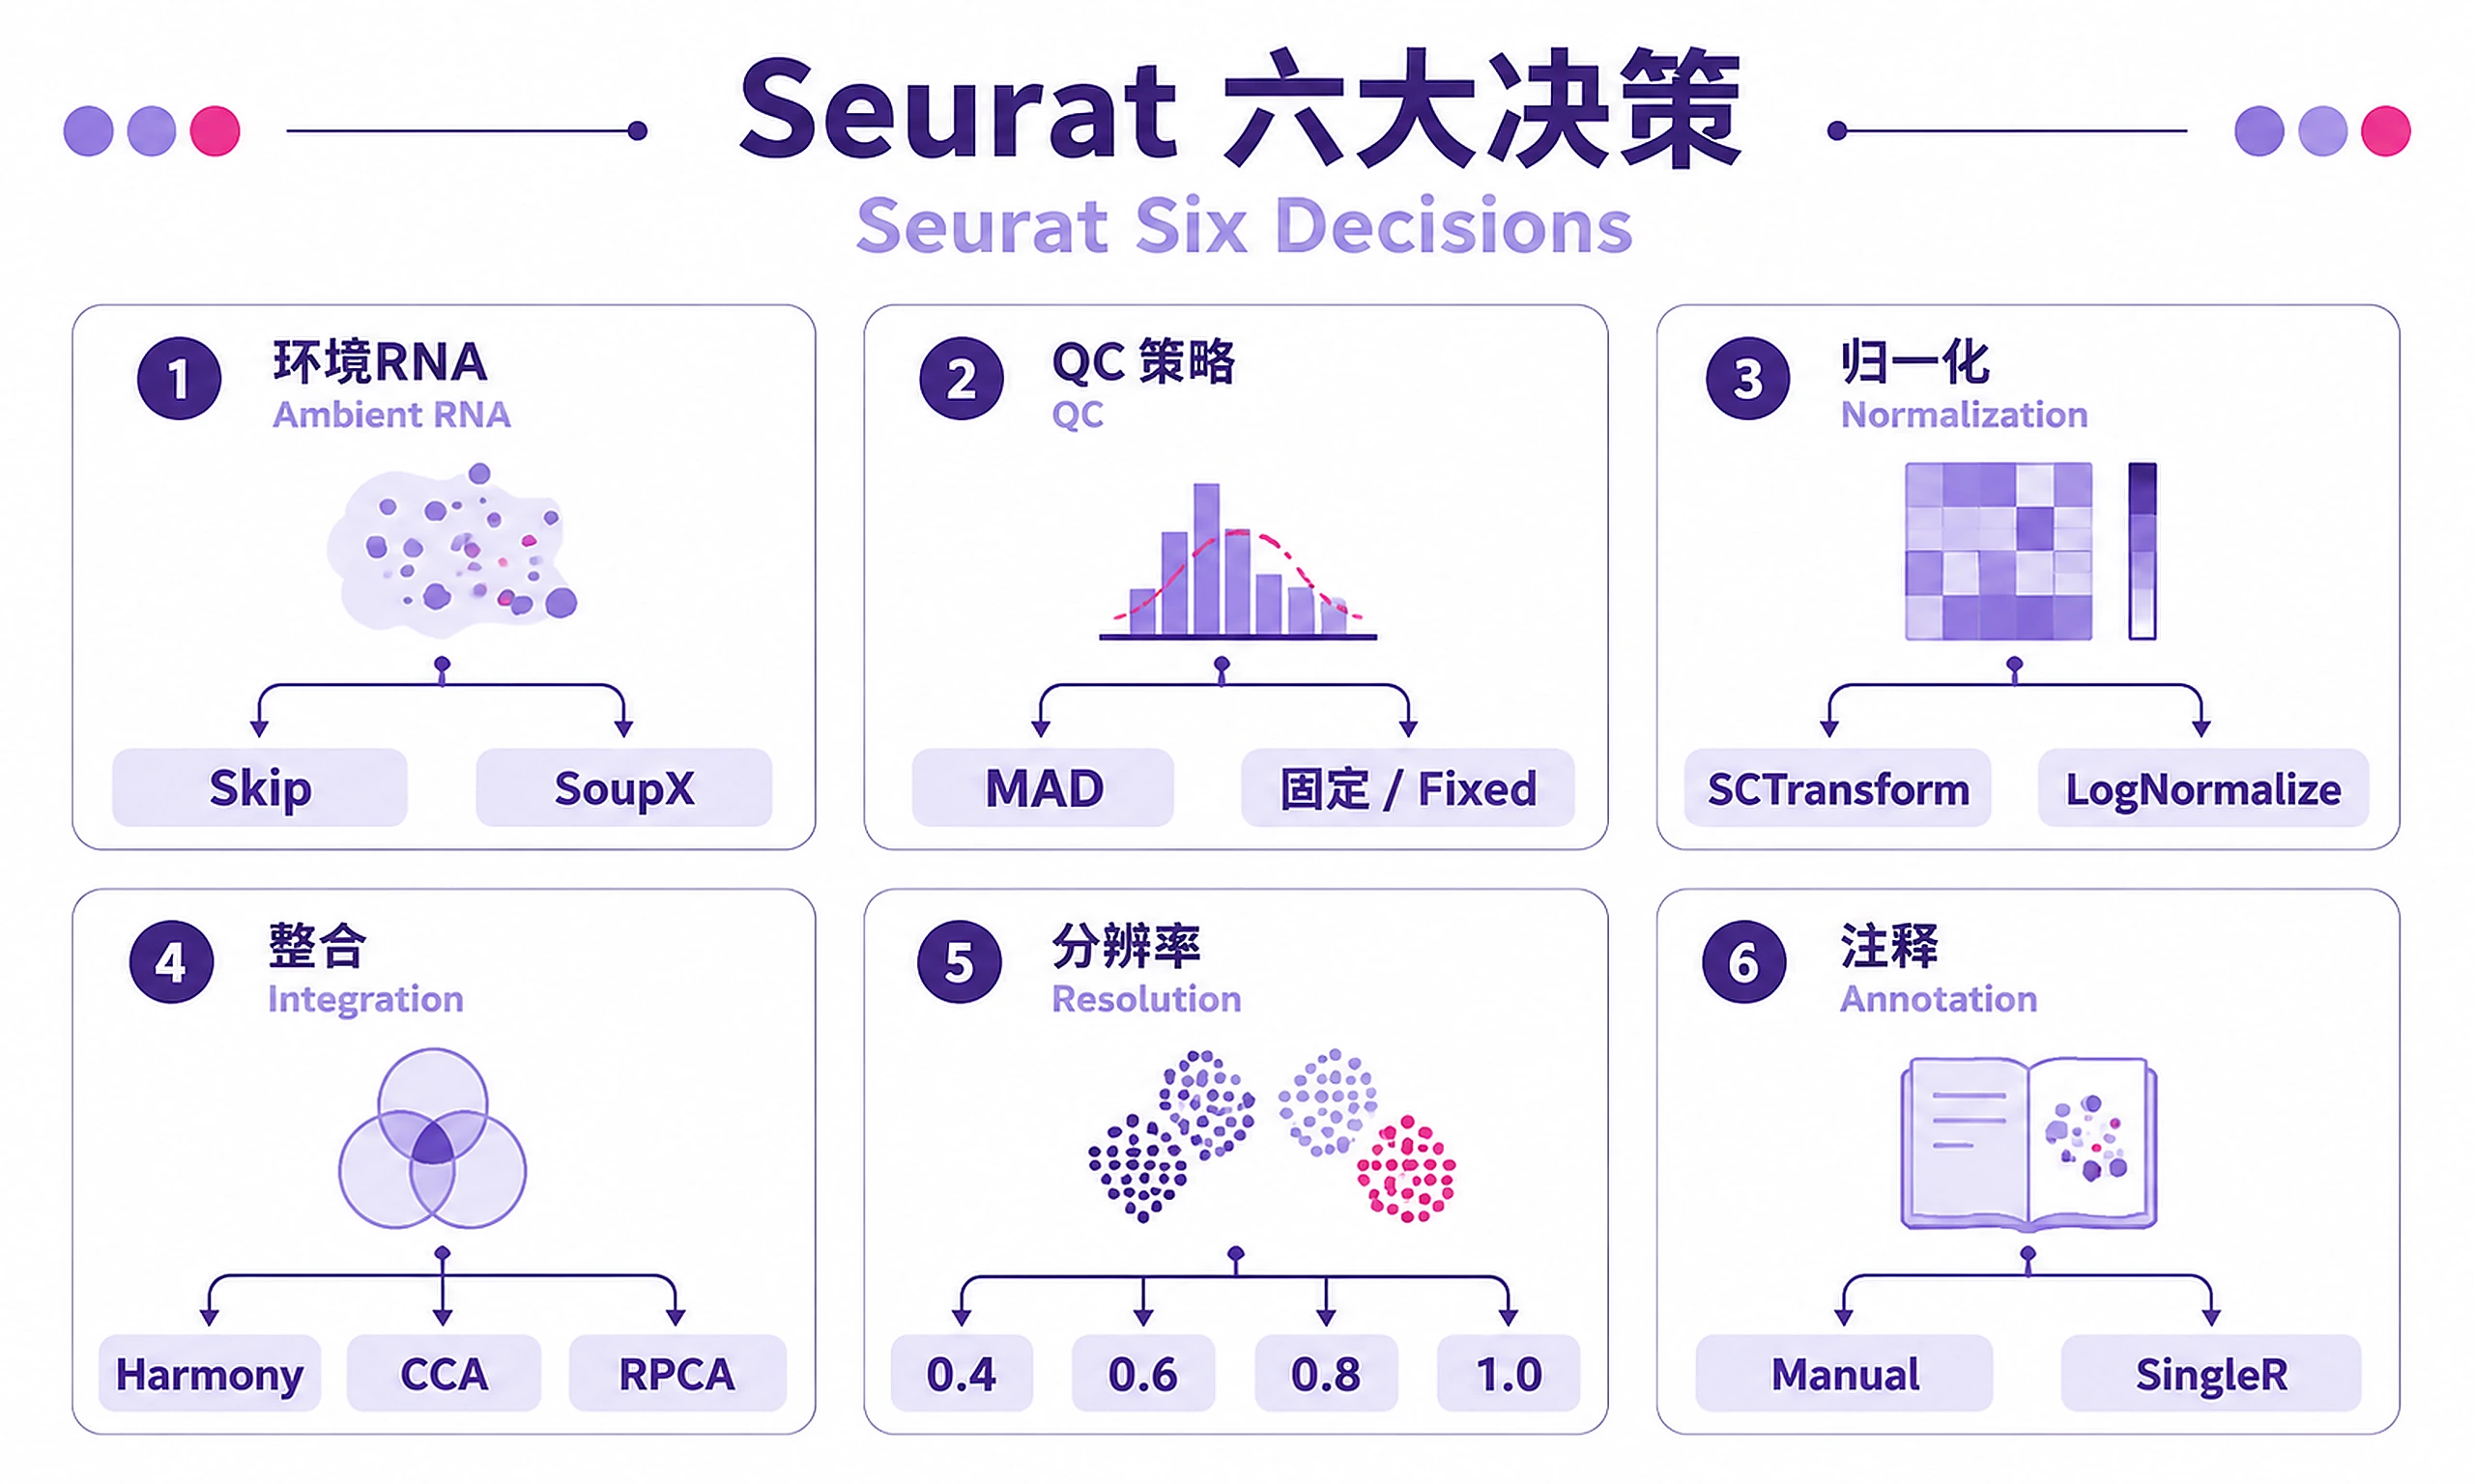
Make six critical decisions during analysis:
| Decision | Options | Quick Guide | Detailed Reference |
|---|---|---|---|
| Ambient RNA | Skip / SoupX | Skip for filtered/PBMC. Use for raw/high-soup tissues (brain, lung, tumor) | ambient_rna_correction.md |
| QC Strategy | MAD / Fixed | MAD (multi-batch, adapts). Fixed (single batch, tissue-specific) | qc_guidelines.md |
| Normalization | SCTransform / LogNormalize | SCTransform (UMI, batch effects). LogNormalize (speed, non-UMI) | seurat_best_practices.md |
| Integration | Harmony / CCA / RPCA | Harmony (fast, simple). CCA (complex batches). RPCA (>100k cells) | integration_methods.md |
| Resolution | 0.4-1.5 | Test multiple (0.4, 0.6, 0.8, 1.0). Choose by biology and stability | seurat_best_practices.md#clustering |
| Annotation | Manual / SingleR / Both | Manual (accurate, needs expertise). SingleR (fast, may misclassify). Both (validate) | marker_gene_database.md |
Comprehensive decision guidance: references/decision-guide.md
Common Issues
| Issue | Cause | Solution |
|---|---|---|
| "Cannot find package 'Seurat'" | Package not installed | install.packages("Seurat") or check R version ≥4.1 |
| Low cell retention (<50%) | Too strict QC thresholds | Use MAD-based filtering instead of fixed thresholds. Review tissue-specific QC guidelines: references/qc_guidelines.md |
| "No harmony reduction found" | Trying to cluster on harmony before integration | Skip integration step for single-batch data, or run run_harmony_integration() before clustering |
| Clusters don't separate on UMAP | Wrong reduction used or insufficient PCs | Verify using correct reduction (harmony for integrated, pca for single-batch). Increase dims to 30-40 PCs |
| Memory error during SCTransform | Dataset too large (>50k cells) | Use run_lognormalize() instead, or process in batches |
| All cells marked as doublets | DoubletFinder parameters incorrect | Check expected doublet rate (typically 0.075 per 1000 cells). Use batch-aware processing |
| "Cannot find mitochondrial genes" | Wrong species or gene format | Specify correct species in calculate_qc_metrics(). Check if genes use gene symbols (MT-) or Ensembl IDs |
Detailed troubleshooting: references/troubleshooting_guide.md
Common Patterns
Pattern 1: Standard 10X PBMC Analysis
# QC and filter
seurat_obj <- import_10x_data("filtered_feature_bc_matrix/") |>
  calculate_qc_metrics(species = "human") |>
  run_doubletfinder() |>
  filter_by_mad_outliers(remove_doublets = TRUE)

# Normalize and cluster
seurat_obj <- seurat_obj |>
  run_sctransform(vars_to_regress = "percent.mt") |>
  run_pca_analysis(n_pcs = 50) |>
  cluster_multiple_resolutions(dims = 1:30, resolutions = c(0.4, 0.6, 0.8)) |>
  run_umap_reduction(dims = 1:30)

# Annotate
all_markers <- find_all_cluster_markers(seurat_obj, resolution = 0.8)
seurat_obj <- annotate_clusters_manual(seurat_obj, annotations)
Pattern 2: Multi-Batch Integration
# After QC/filtering and normalization
seurat_obj <- seurat_obj |>
  run_pca_analysis(n_pcs = 50) |>
  run_harmony_integration(batch_var = "batch", dims_use = 1:30)

lisi_scores <- compute_lisi_scores(seurat_obj, batch_var = "batch", reduction = "harmony")

# Cluster on integrated space
seurat_obj <- seurat_obj |>
  cluster_multiple_resolutions(dims = 1:30, reduction = "harmony") |>
  run_umap_reduction(dims = 1:30, reduction = "harmony")
Pattern 3: Condition Comparison with Pseudobulk
# After clustering and annotation
pseudobulk_data <- aggregate_to_pseudobulk(seurat_obj, sample_col = "sample_id", celltype_col = "cell_type")
de_results <- run_pseudobulk_deseq2(pseudobulk_data, formula = "~ donor + condition", contrast = c("condition", "disease", "healthy"))
Additional patterns and complete code examples: references/common-patterns.md
Suggested Next Steps
After completing core scRNA-seq analysis:
- Functional Enrichment - Use functional-enrichment-from-degs to test pseudobulk DE results for enriched pathways and interpret biological differences
- Trajectory Analysis - Monocle3, Slingshot, or RNA velocity for developmental/differentiation datasets
- Cell-Cell Communication - CellChat, CellPhoneDB, or NicheNet for ligand-receptor interactions
- Advanced Visualization - Alluvial diagrams, proportional bar plots, gene regulatory networks
Related Skills
Alternative single-cell: scrnaseq-scanpy-core-analysis (Python-based)
Downstream: functional-enrichment-from-degs, de-results-to-plots, de-results-to-gene-lists
Complementary: bulk-omics-clustering (non-scRNA-seq), experimental-design-statistics (plan experiments)
References
Primary Citations
- Seurat v5: Hao Y, et al. (2024) Dictionary learning for integrative, multimodal and scalable single-cell analysis. Nat Biotechnol. 42:293-304.
- SCTransform: Hafemeister C, Satija R. (2019) Normalization and variance stabilization of single-cell RNA-seq data. Genome Biol. 20:296.
- Pseudobulk DE: Squair JW, et al. (2021) Confronting false discoveries in single-cell differential expression. Nat Commun. 12:5692.
- Harmony: Korsunsky I, et al. (2019) Fast, sensitive and accurate integration of single-cell data. Nat Methods. 16:1289-1296.
Detailed Documentation
Reference guides:
- references/decision-guide.md - Comprehensive decision guidance for all workflow choices
- references/workflow-details.md - Detailed code examples for all workflow steps
- references/common-patterns.md - Complete code patterns and use cases
- references/seurat_best_practices.md - Comprehensive best practices
- references/qc_guidelines.md - Tissue-specific QC thresholds
- references/integration_methods.md - Batch integration comparison
- references/pseudobulk_de_guide.md - Pseudobulk methodology
- references/ambient_rna_correction.md - SoupX guidance
- references/marker_gene_database.md - Cell type markers
- references/troubleshooting_guide.md - Common issues
Scripts: See scripts/ for all modular R functions
Evaluation: assets/eval/complete_example_analysis.R - Full PBMC 3k example
Online resources:
- Official Seurat tutorials: https://satijalab.org/seurat/articles/
- Seurat GitHub: https://github.com/satijalab/seurat
Code preview
assets/eval/complete_example_analysis.R
# ============================================================================
# COMPLETE SEURAT ANALYSIS EXAMPLE - PBMC 3K DATASET
# ============================================================================
#
# This script demonstrates a complete end-to-end scRNA-seq analysis
# using the PBMC 3k dataset from 10X Genomics.
#
# For dataset info, see: assets/eval/datasets/pbmc3k_info.md
#
# Expected runtime: ~15-20 minutes on standard laptop

# Load evaluation helpers (for example data)
source("assets/eval/eval_helpers.R")

# Load all required scripts
source("scripts/setup_and_import.R")
source("scripts/qc_metrics.R")
source("scripts/plot_qc.R")
source("scripts/filter_cells.R")
source("scripts/normalize_data.R")
source("scripts/scale_and_pca.R")
source("scripts/cluster_cells.R")
source("scripts/run_umap.R")
source("scripts/plot_dimreduction.R")
source("scripts/find_markers.R")
source("scripts/annotate_celltypes.R")
source("scripts/export_results.R")

# Setup
setup_seurat_libraries()

# ============================================================================
# STEP 1: Load data
# ============================================================================

# Option A: From SeuratData package (easiest)
seurat_obj <- load_seurat_data("pbmc3k")

# Option B: From downloaded 10X data
# seurat_obj <- import_10x_data("path/to/filtered_gene_bc_matrices/hg19/")

# Option C: From H5 file
# seurat_obj <- import_h5_data("path/to/filtered_feature_bc_matrix.h5")

# ============================================================================
# STEP 2: Quality Control
# ============================================================================

# Calculate QC metrics
seurat_obj <- calculate_qc_metrics(seurat_obj, species = "human")

# Visualize QC metrics
plot_qc_violin(seurat_obj, output_dir = "results/qc")
plot_qc_scatter(seurat_obj, output_dir = "results/qc")
plot_qc_histogram(seurat_obj, output_dir = "results/qc")

# Check metrics before filtering
summary(seurat_obj$nFeature_RNA)
summary(seurat_obj$nCount_RNA)
summary(seurat_obj$percent.mt)

# ============================================================================
# STEP 3: Filter cells
# ============================================================================

# Apply tissue-specific filtering (PBMC)
seurat_obj <- filter_cells_by_qc(
  seurat_obj,
  min_features = 200,
  max_features = 2500,
  max_mt_percent = 5
)

# Expected: ~2,600-2,700 cells retained (>95%)

# ============================================================================
# STEP 4: Normalize data
# ============================================================================

# Use SCTransform (recommended for 10X data)
assets/eval/eval_helpers.R
# ============================================================================
# EVALUATION HELPERS FOR SCRNASEQ-SEURAT-CORE-ANALYSIS
# ============================================================================
#
# This script contains helper functions for evaluating and testing the skill.
# These functions are NOT part of the core skill - they are only for demos,
# testing, and validation.
#
# Functions:
#   - load_seurat_data(): Load example data from SeuratData package (for testing)
#
# Usage:
#   source("assets/eval/eval_helpers.R")
#   seurat_obj <- load_seurat_data("pbmc3k")

#' Load data from SeuratData package (FOR TESTING/DEMO ONLY)
#'
#' This function is for evaluation and testing purposes only.
#' Users analyzing their own data should use the import functions in
#' scripts/setup_and_import.R instead.
#'
#' @param dataset_name Name of dataset (e.g., "pbmc3k", "ifnb")
#' @param type Type of data to load (default: auto-detect for dataset)
#' @return Seurat object
#' @export
load_seurat_data <- function(dataset_name, type = NULL) {

  # Check if SeuratData is installed
  if (!requireNamespace("SeuratData", quietly = TRUE)) {
    message("Installing SeuratData package...")
    if (!requireNamespace("remotes", quietly = TRUE)) {
      install.packages("remotes")
    }
    remotes::install_github('satijalab/seurat-data')
  }

  library(SeuratData)

  message("Loading ", dataset_name, " dataset from SeuratData")

  # Install dataset if not available
  if (!dataset_name %in% InstalledData()$Dataset) {
    message("Installing ", dataset_name, " dataset...")
    InstallData(dataset_name)
  }

  # Auto-detect type for specific datasets
  if (is.null(type)) {
    if (dataset_name == "pbmc3k") {
      type <- "default"  # pbmc3k uses "default" not "filtered"
    } else {
      type <- "filtered"
    }
  }

  # Load dataset
  LoadData(dataset_name, type = type)

  # Get the object
  seurat_obj <- get(dataset_name)

  # Update object for Seurat v5 compatibility
  if (packageVersion("Seurat") >= "5.0.0") {
    message("Updating object for Seurat v5 compatibility...")
    # SeuratObject v5 compatibility fix
    if (!".cache" %in% slotNames(seurat_obj)) {
      seurat_obj <- UpdateSeuratObject(seurat_obj)
    }
  }

  message(sprintf("Loaded Seurat object: %d genes x %d cells",
                  nrow(seurat_obj), ncol(seurat_obj)))

  return(seurat_obj)
}
assets/eval/test_quick_start.R
#!/usr/bin/env Rscript

# Quick Start Functional Test
# This script tests the Quick Start workflow from SKILL.md

cat("=== Quick Start Functional Test ===\n\n")
cat("Testing scrnaseq-seurat-core-analysis skill\n")
cat("Started at:", as.character(Sys.time()), "\n\n")

# Load evaluation helpers for example data
cat("Step 1: Loading evaluation helpers...\n")
tryCatch({
  source("assets/eval/eval_helpers.R")
  cat("✓ Loaded assets/eval/eval_helpers.R\n\n")
}, error = function(e) {
  cat("✗ Error loading eval_helpers.R:", conditionMessage(e), "\n")
  quit(status = 1)
})

# Load required core scripts
cat("Step 2: Loading core scripts...\n")
scripts <- c(
  "scripts/setup_and_import.R",
  "scripts/qc_metrics.R",
  "scripts/filter_cells.R",
  "scripts/normalize_data.R",
  "scripts/scale_and_pca.R",
  "scripts/cluster_cells.R",
  "scripts/run_umap.R",
  "scripts/find_markers.R",
  "scripts/plot_dimreduction.R",
  "scripts/annotate_celltypes.R"
)

for (script in scripts) {
  tryCatch({
    source(script)
    cat("✓ Loaded", script, "\n")
  }, error = function(e) {
    cat("✗ Error loading", script, ":", conditionMessage(e), "\n")
    quit(status = 1)
  })
}

cat("\nStep 3: Setting up Seurat libraries...\n")
tryCatch({
  setup_seurat_libraries()
  cat("✓ Libraries loaded successfully\n\n")
}, error = function(e) {
  cat("✗ Error setting up libraries:", conditionMessage(e), "\n")
  cat("Note: This is expected if Seurat packages are not installed\n")
  quit(status = 1)
})

cat("Step 4: Loading PBMC 3k example data...\n")
tryCatch({
  seurat_obj <- load_seurat_data("pbmc3k")
  cat("✓ Loaded pbmc3k data\n")
  cat("  Dimensions:", nrow(seurat_obj), "genes x", ncol(seurat_obj), "cells\n\n")
}, error = function(e) {
  cat("✗ Error loading pbmc3k data:", conditionMessage(e), "\n")
  cat("Note: This requires SeuratData package and pbmc3k dataset\n")
  quit(status = 1)
})

cat("Step 5: QC and filtering...\n")
tryCatch({
  seurat_obj <- calculate_qc_metrics(seurat_obj, species = "human")
  cat("✓ Calculated QC metrics\n")

  seurat_obj <- filter_cells_by_qc(seurat_obj, min_features = 200, max_features = 2500, max_mt_percent = 5)
  cat("✓ Filtered cells\n")
  cat("  Retained:", ncol(seurat_obj), "cells\n\n")
}, error = function(e) {
  cat("✗ Error in QC/filtering:", conditionMessage(e), "\n")
  quit(status = 1)
})

cat("Step 6: Normalization and dimensionality reduction...\n")
cat("(This step takes 5-10 minutes - running abbreviated version)\n")