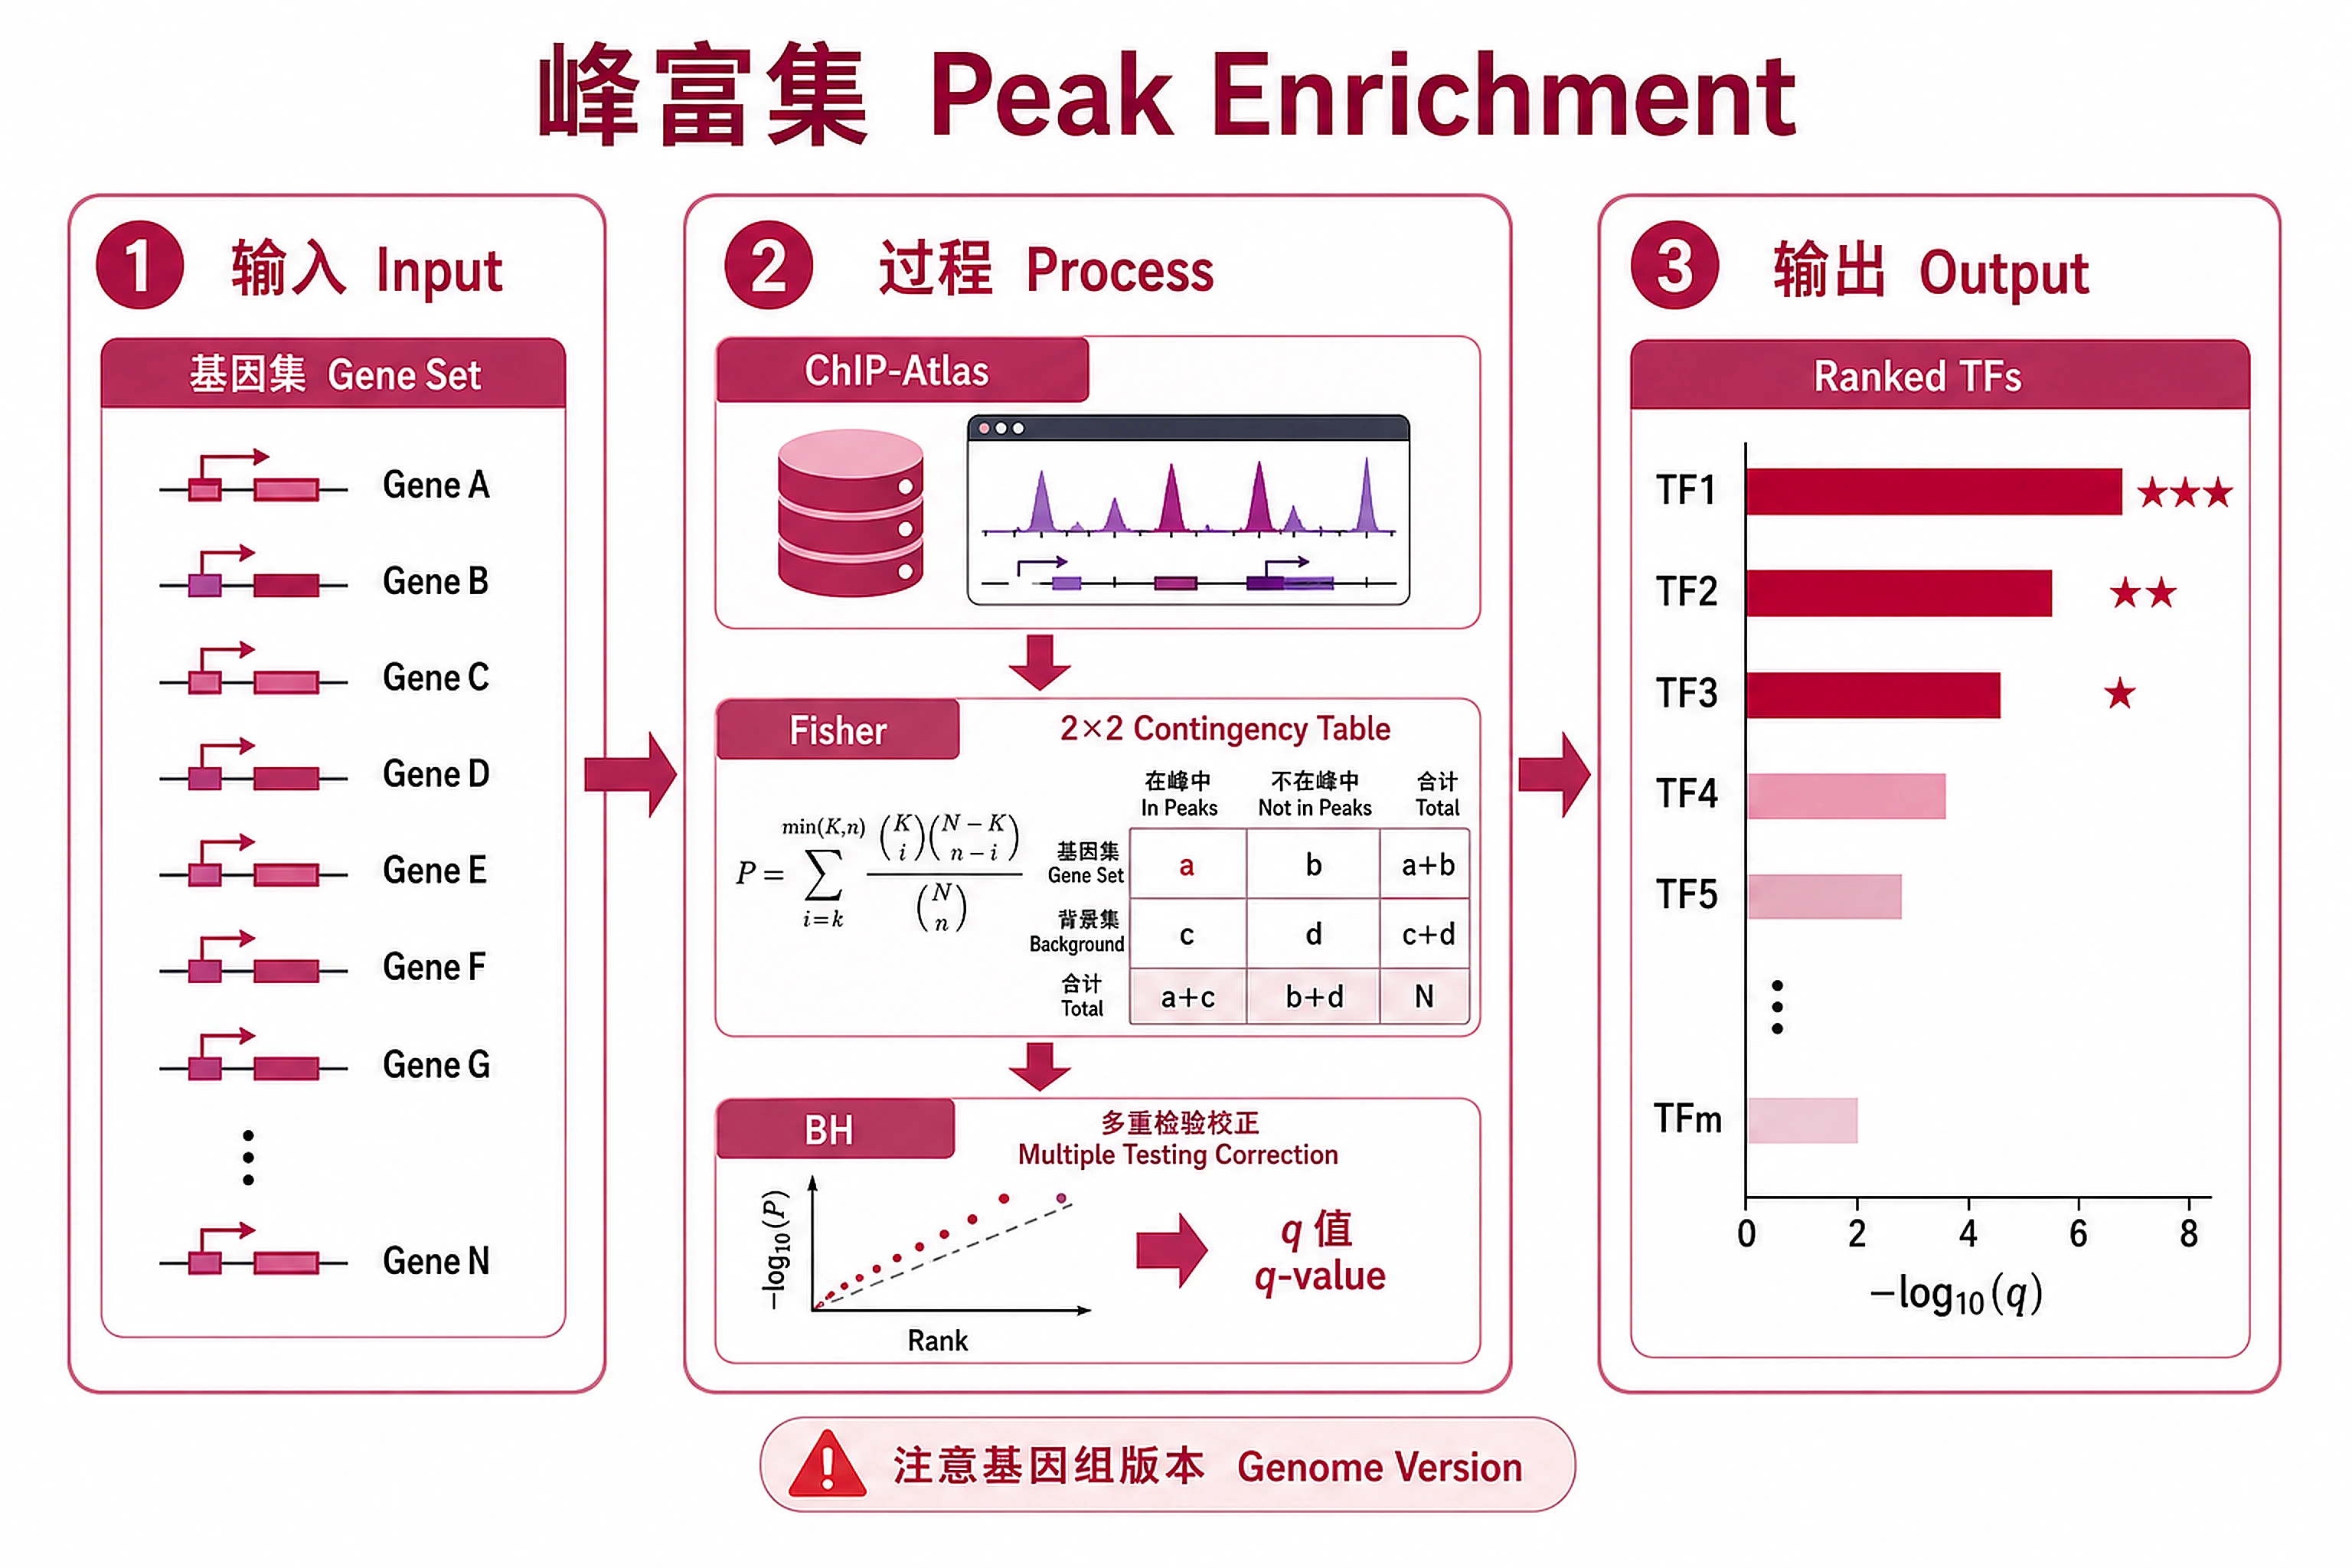
Peak Enrichment (genes → TF)
Given a gene set, which TFs are enriched over it.
Overview
Problem. Which TFs co-regulate the genes in my list?
Learning goals
- The Fisher + BH pattern recurs everywhere
- Reverse-infer regulation from public data
Figures
Tutorial
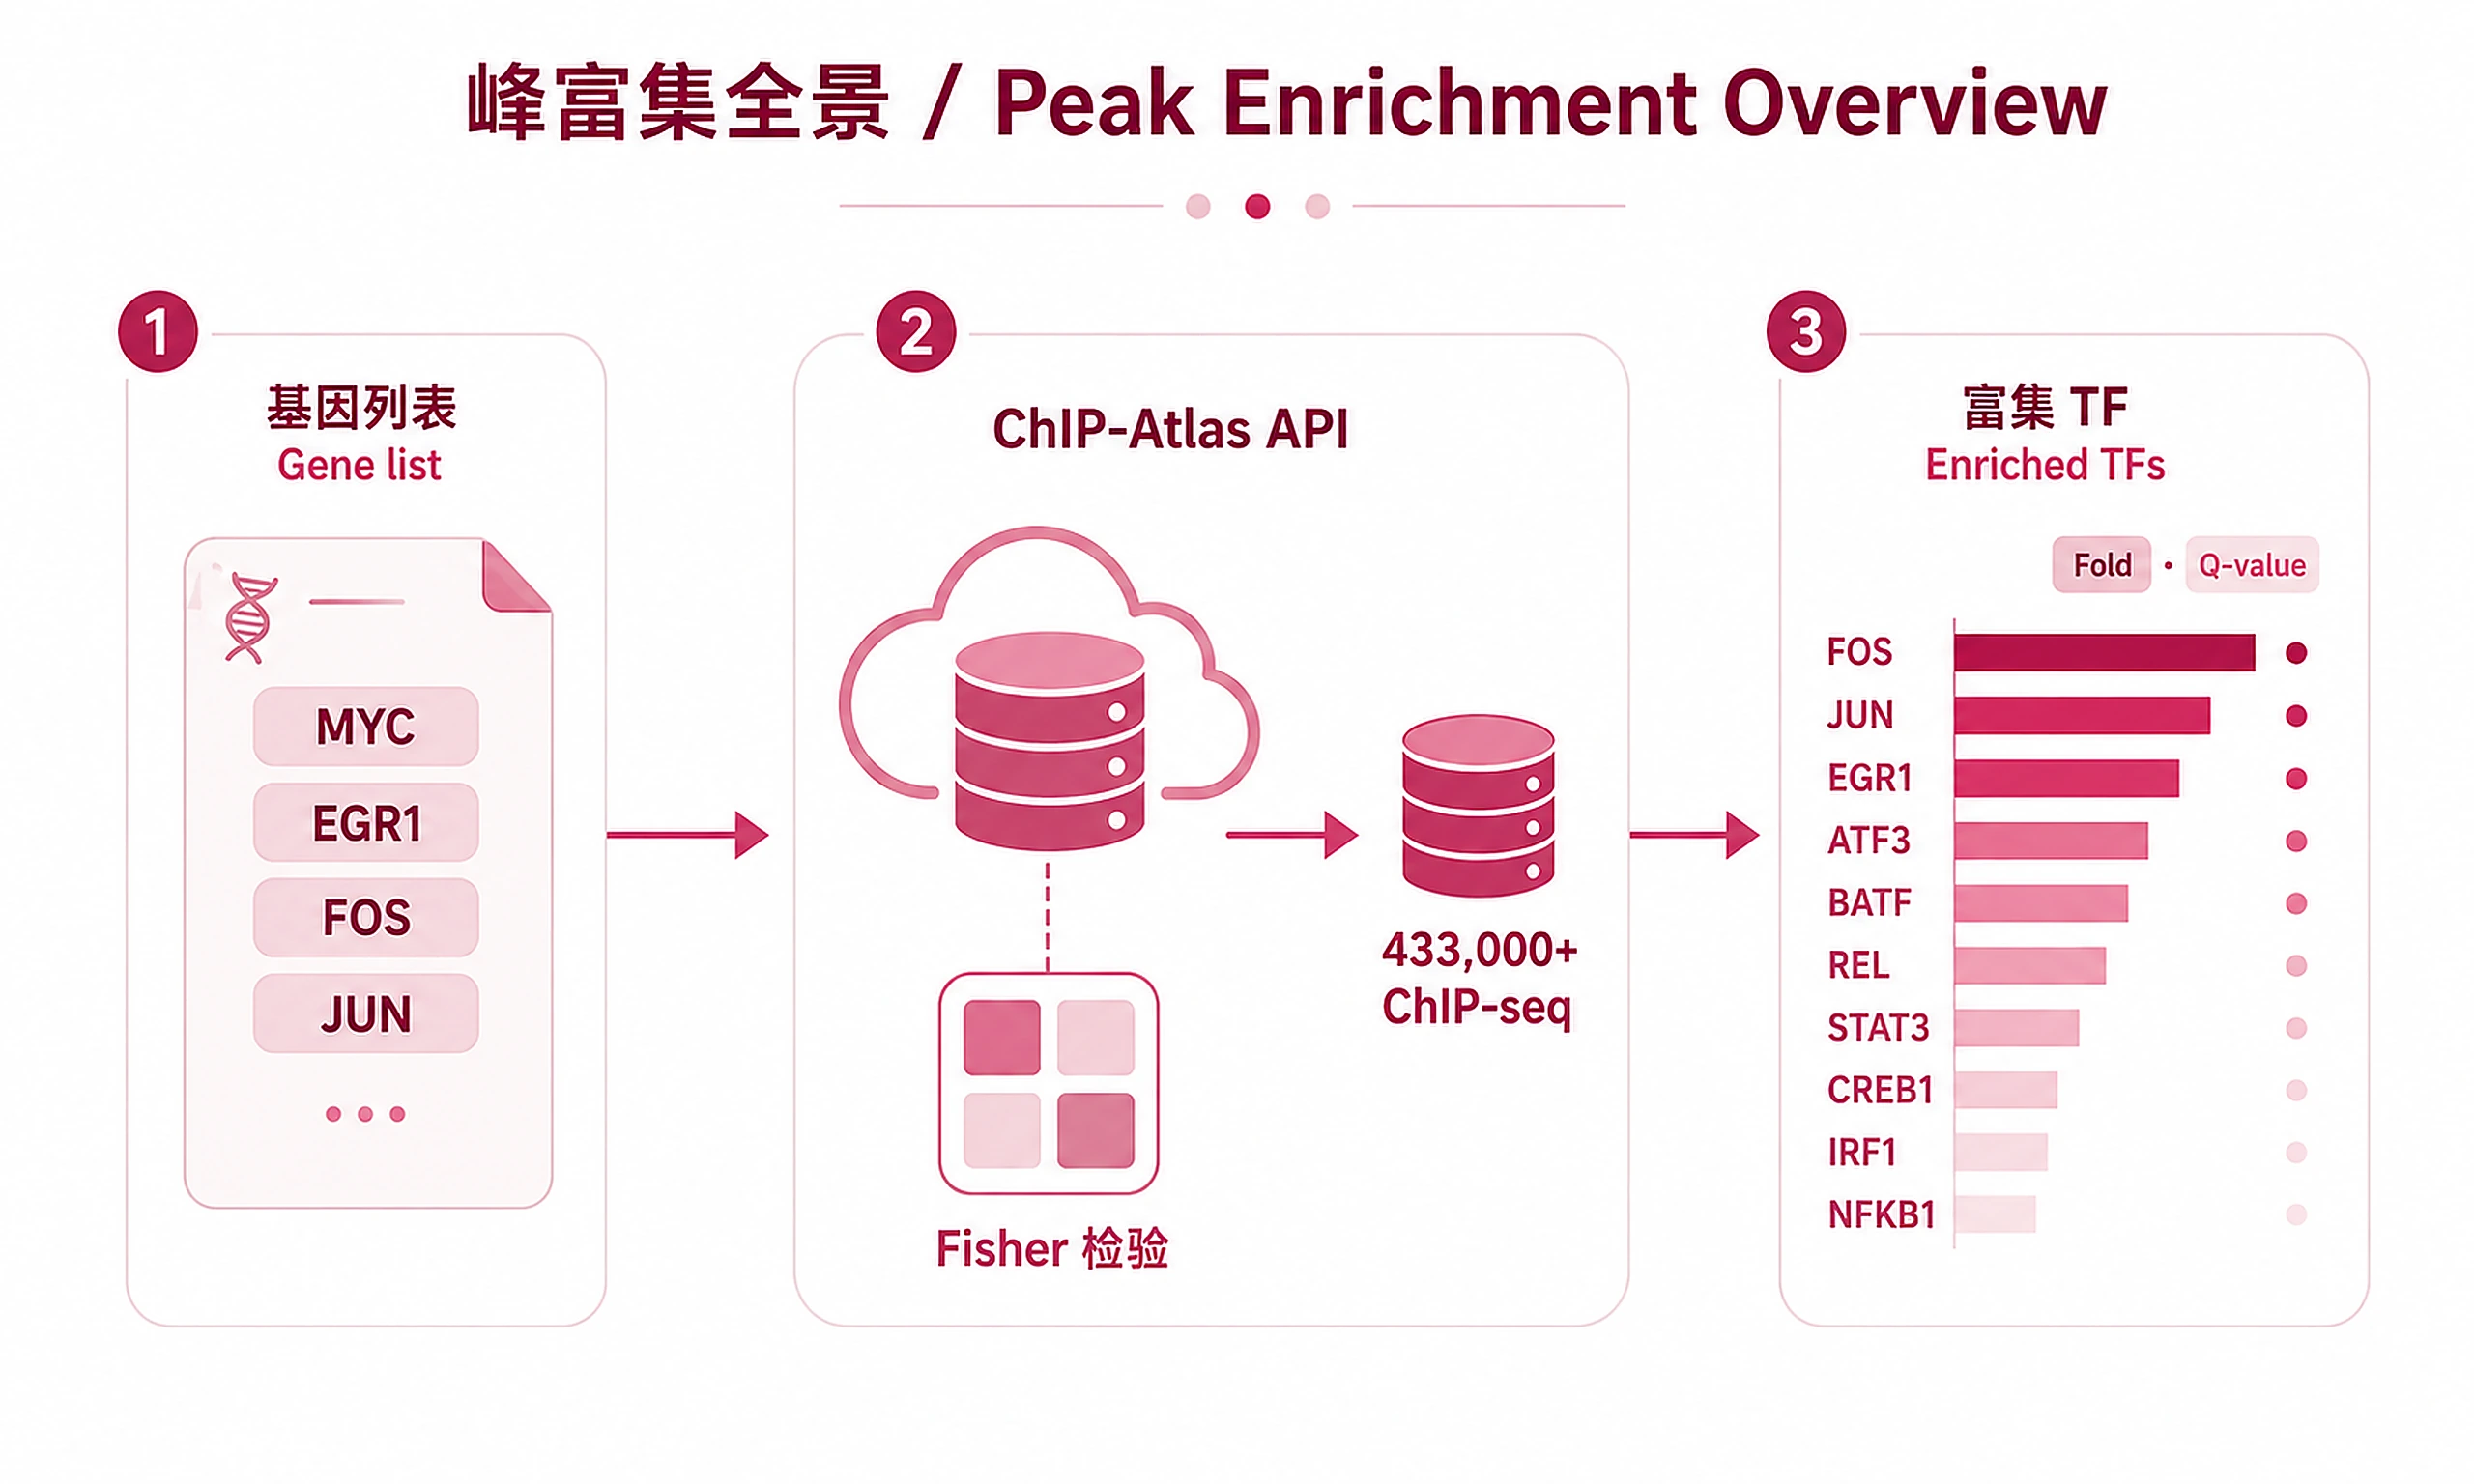
Find ChIP-seq peak enrichment near your genes using the official ChIP-Atlas Enrichment Analysis API.
When to Use This Skill
Use ChIP-Atlas peak enrichment when you need to:
- Identify transcription factors binding near your genes from DE analysis or pathway results
- Discover chromatin regulators (TFs, histone modifications, chromatin remodelers) enriched near your gene set
- Validate regulatory relationships between factors and target genes using public ChIP-seq data
- Find cell-type-specific regulators by filtering to specific cell classes
- Query 433,000+ ChIP-seq experiments via the official API without manual downloads
Don't use for:
- Direct ChIP-seq analysis from raw reads (use peak calling workflows)
- Single gene lookups (use ChIP-Atlas web interface directly)
- Offline analysis (requires internet for API calls)
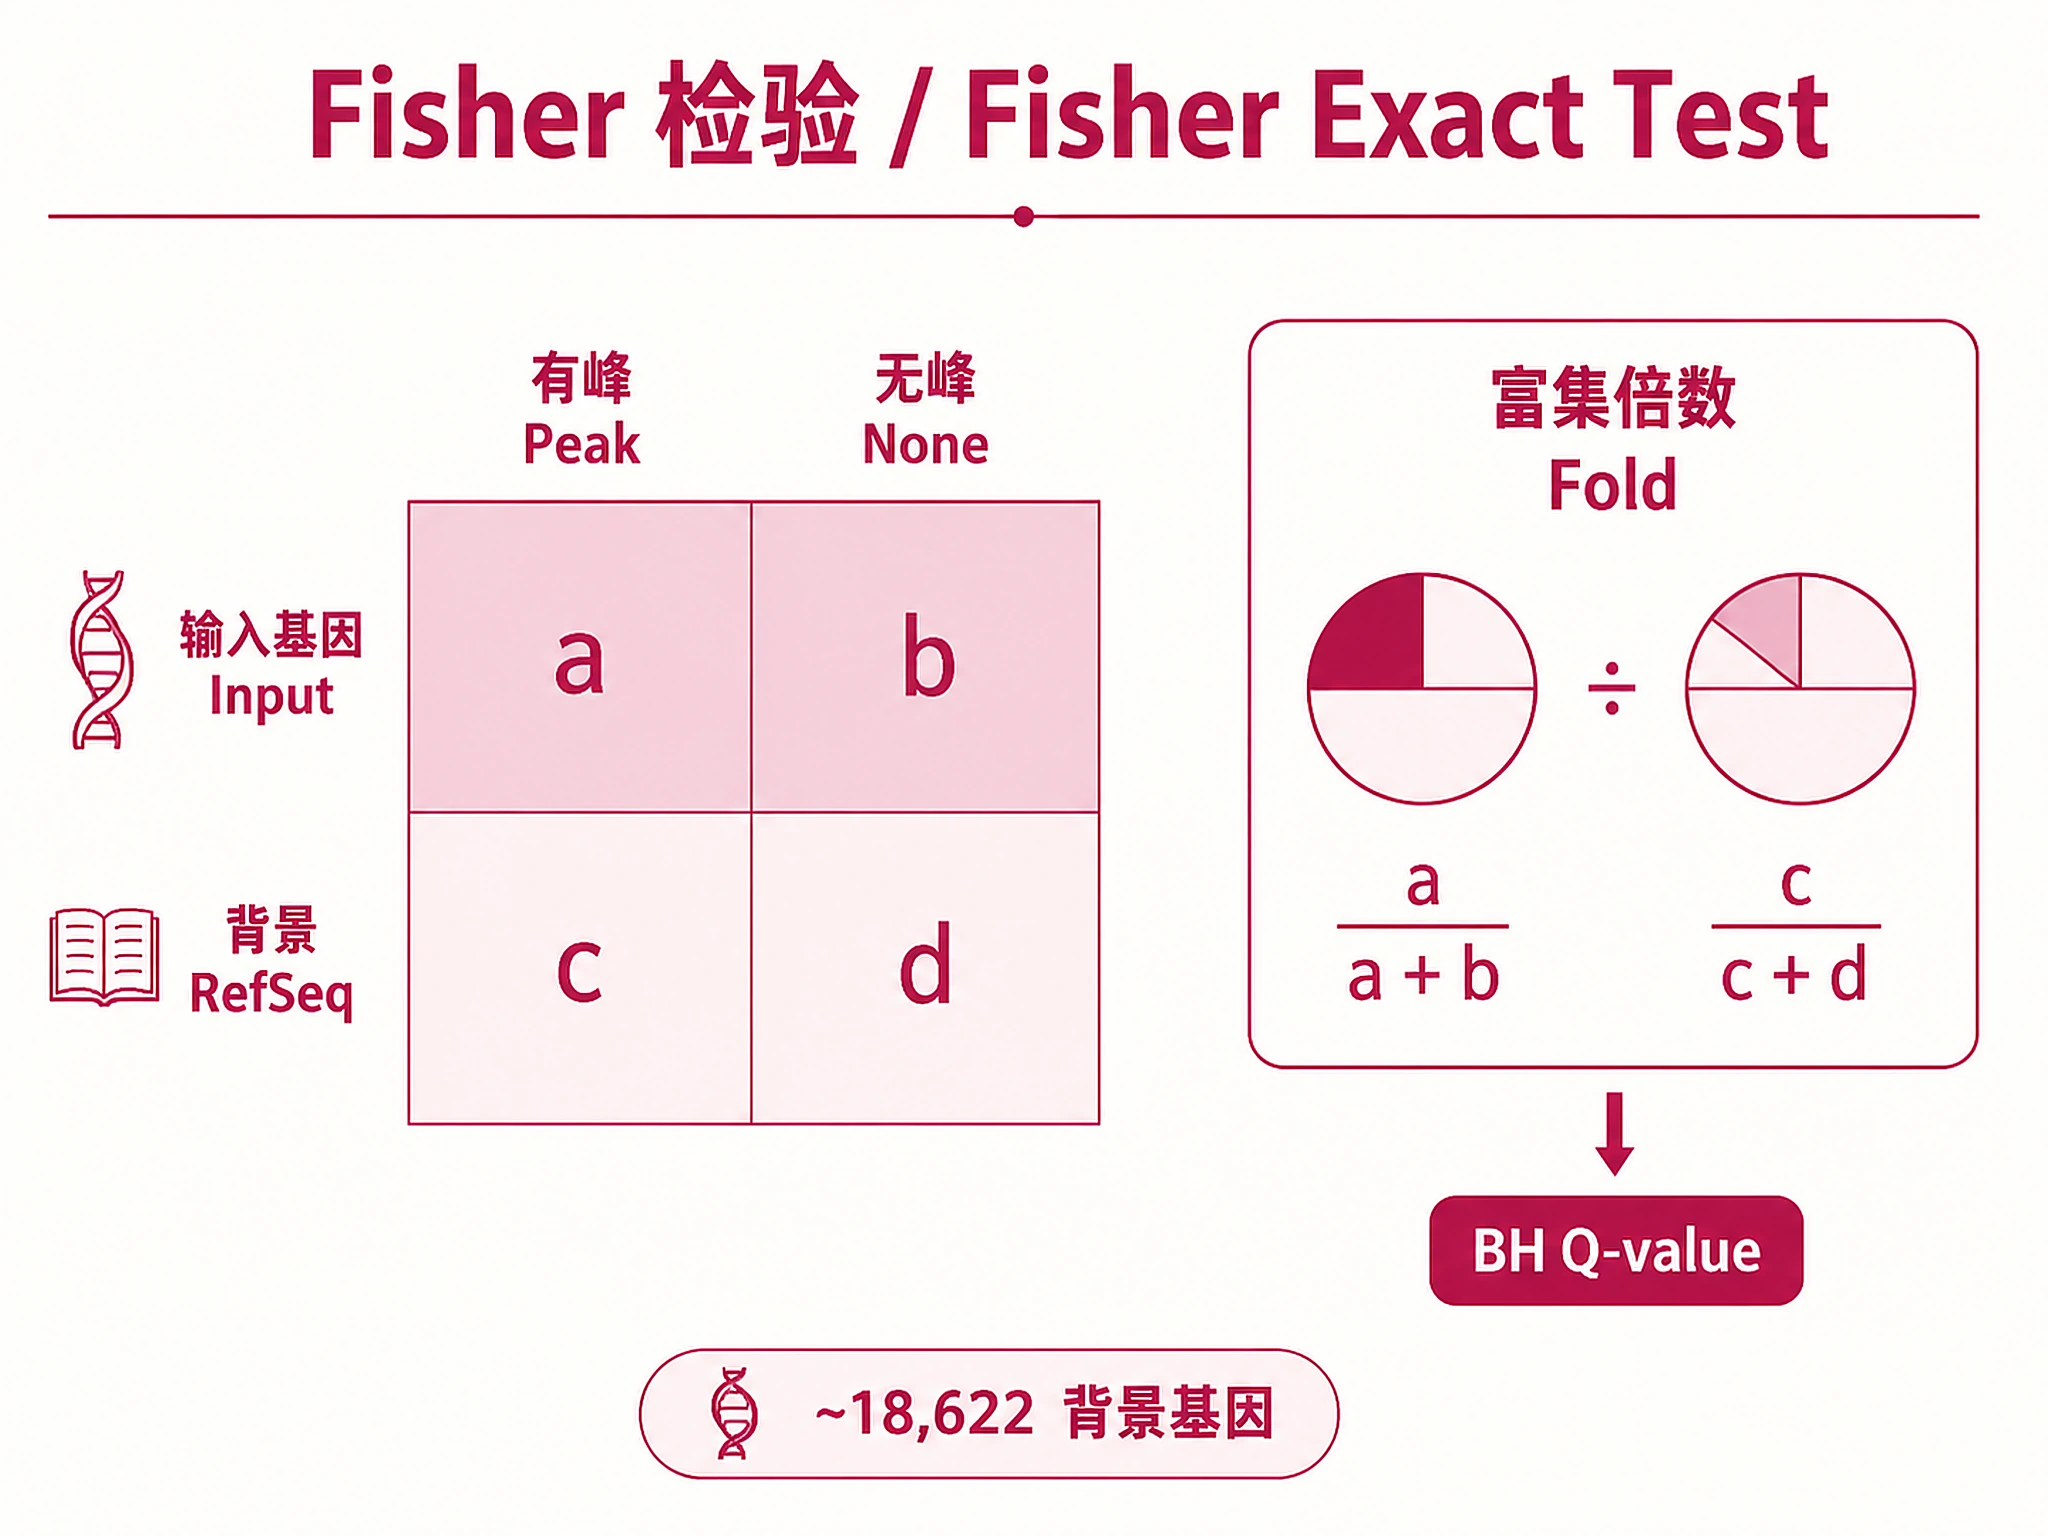
Key Concept: Submits your gene list to the ChIP-Atlas API, which performs Fisher's exact test enrichment analysis against all public ChIP-seq experiments. Returns fold enrichment, P-values, and BH-corrected Q-values.
Installation
| Software | Version | License | Commercial Use | Installation |
|---|---|---|---|---|
| pandas | >=1.3 | BSD-3-Clause | Permitted | pip install pandas |
| requests | >=2.25 | Apache-2.0 | Permitted | pip install requests |
| numpy | >=1.20 | BSD-3-Clause | Permitted | pip install numpy |
| plotnine | >=0.10 | MIT | Permitted | pip install plotnine |
| plotnine-prism | >=0.3 | MIT | Permitted | pip install plotnine-prism |
pip install pandas requests numpy plotnine plotnine-prism
System requirements: Internet connection (API calls to ChIP-Atlas and Ensembl)
Inputs
Gene list:
- Gene symbols (e.g., ["TP53", "MYC", "EGFR"])
- Minimum: 3 genes; Recommended: 5-100 genes
- Formats: Python list, plain text (one per line), CSV with gene column
Parameters:
- Genome: hg38 (default), hg19, mm10, mm9, rn6, dm6, dm3, ce11, ce10, sacCer3
- Antigen class: "TFs and others" (default), "Histone", "ATAC-Seq", "DNase-seq", "RNA polymerase"
- Cell class: "All cell types" (default), "Blood", "Neural", "Breast", etc.
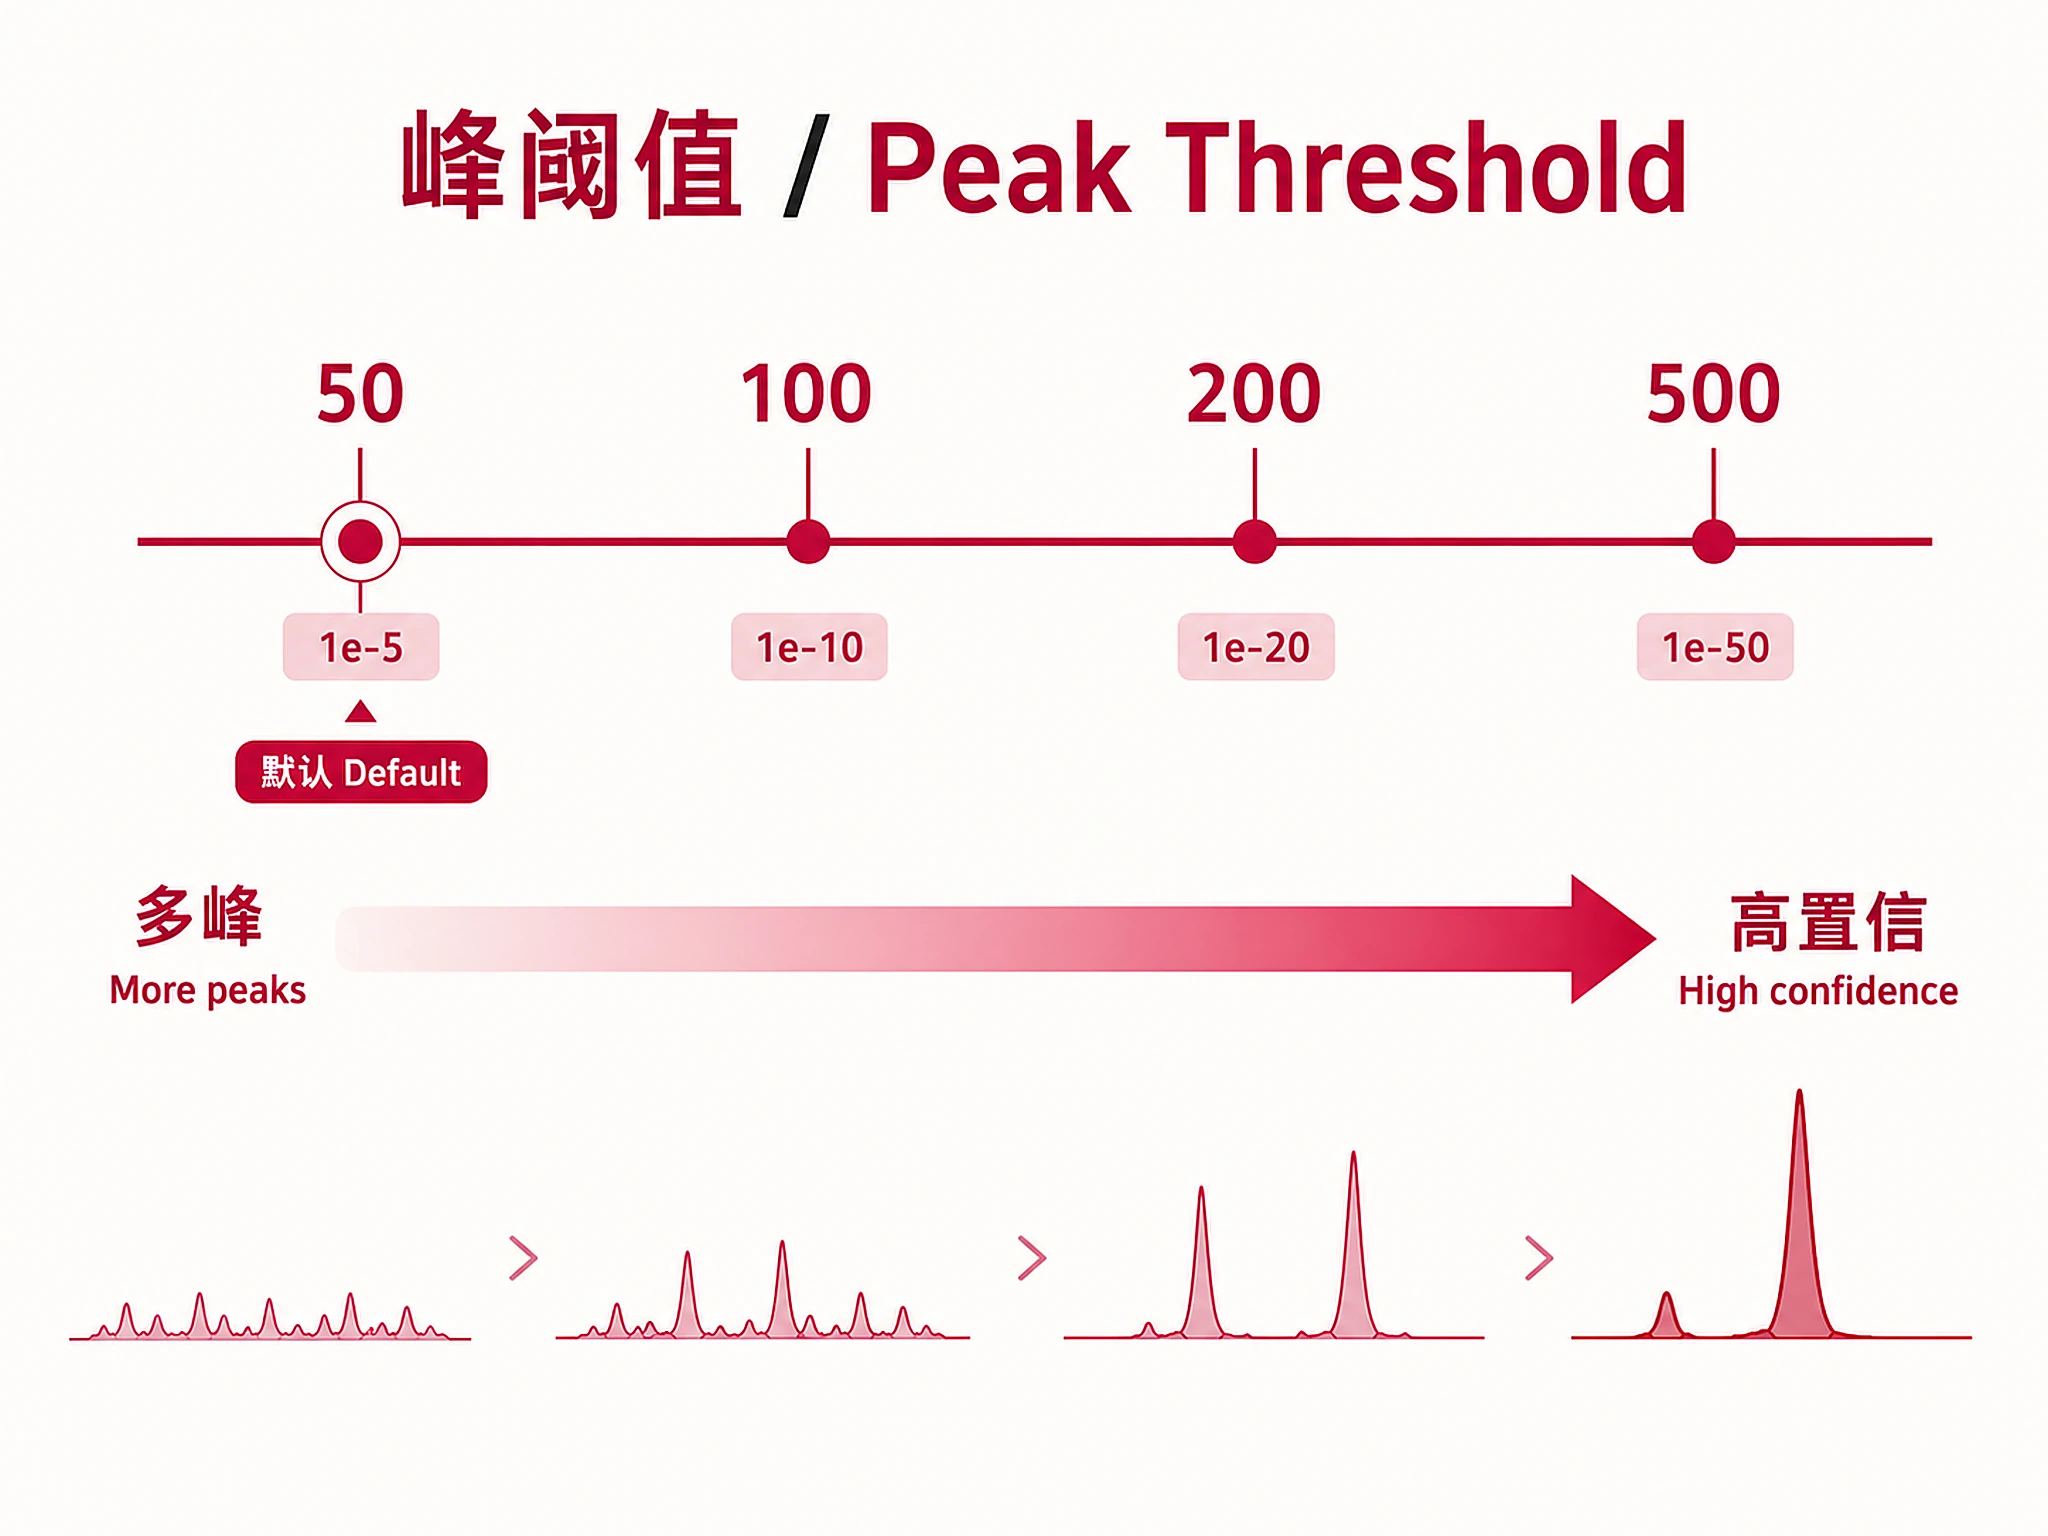
- Threshold: Peak-calling stringency (MACS2 -10×log10(p)): 50 (default, ~p<1e-5), 100 (~p<1e-10), 200 (~p<1e-20), 500 (~p<1e-50). Higher = fewer, more confident peaks. See references/peak_thresholds.md.
- TSS window: 5000bp upstream, 5000bp downstream (default)
Outputs
Analysis objects (Pickle):
analysis_object.pkl- Complete results for downstream use- Load with:
import pickle; obj = pickle.load(open('analysis_object.pkl', 'rb')) - Contains: enrichment_results, input_genes, input_regions, metadata, parameters
Results (CSV):
enrichment_results_all.csv- All experiments (experiment_id, antigen, cell_type, fold_enrichment, p_value, q_value, overlap_rate, regions_with_overlaps, total_regions)enrichment_results_significant.csv- Significant enrichments (q < 0.05, BH-corrected)enrichment_results_top20.csv- Top 20 by significance (q-value, minimum 2 gene overlaps)
Visualizations (PNG + SVG):
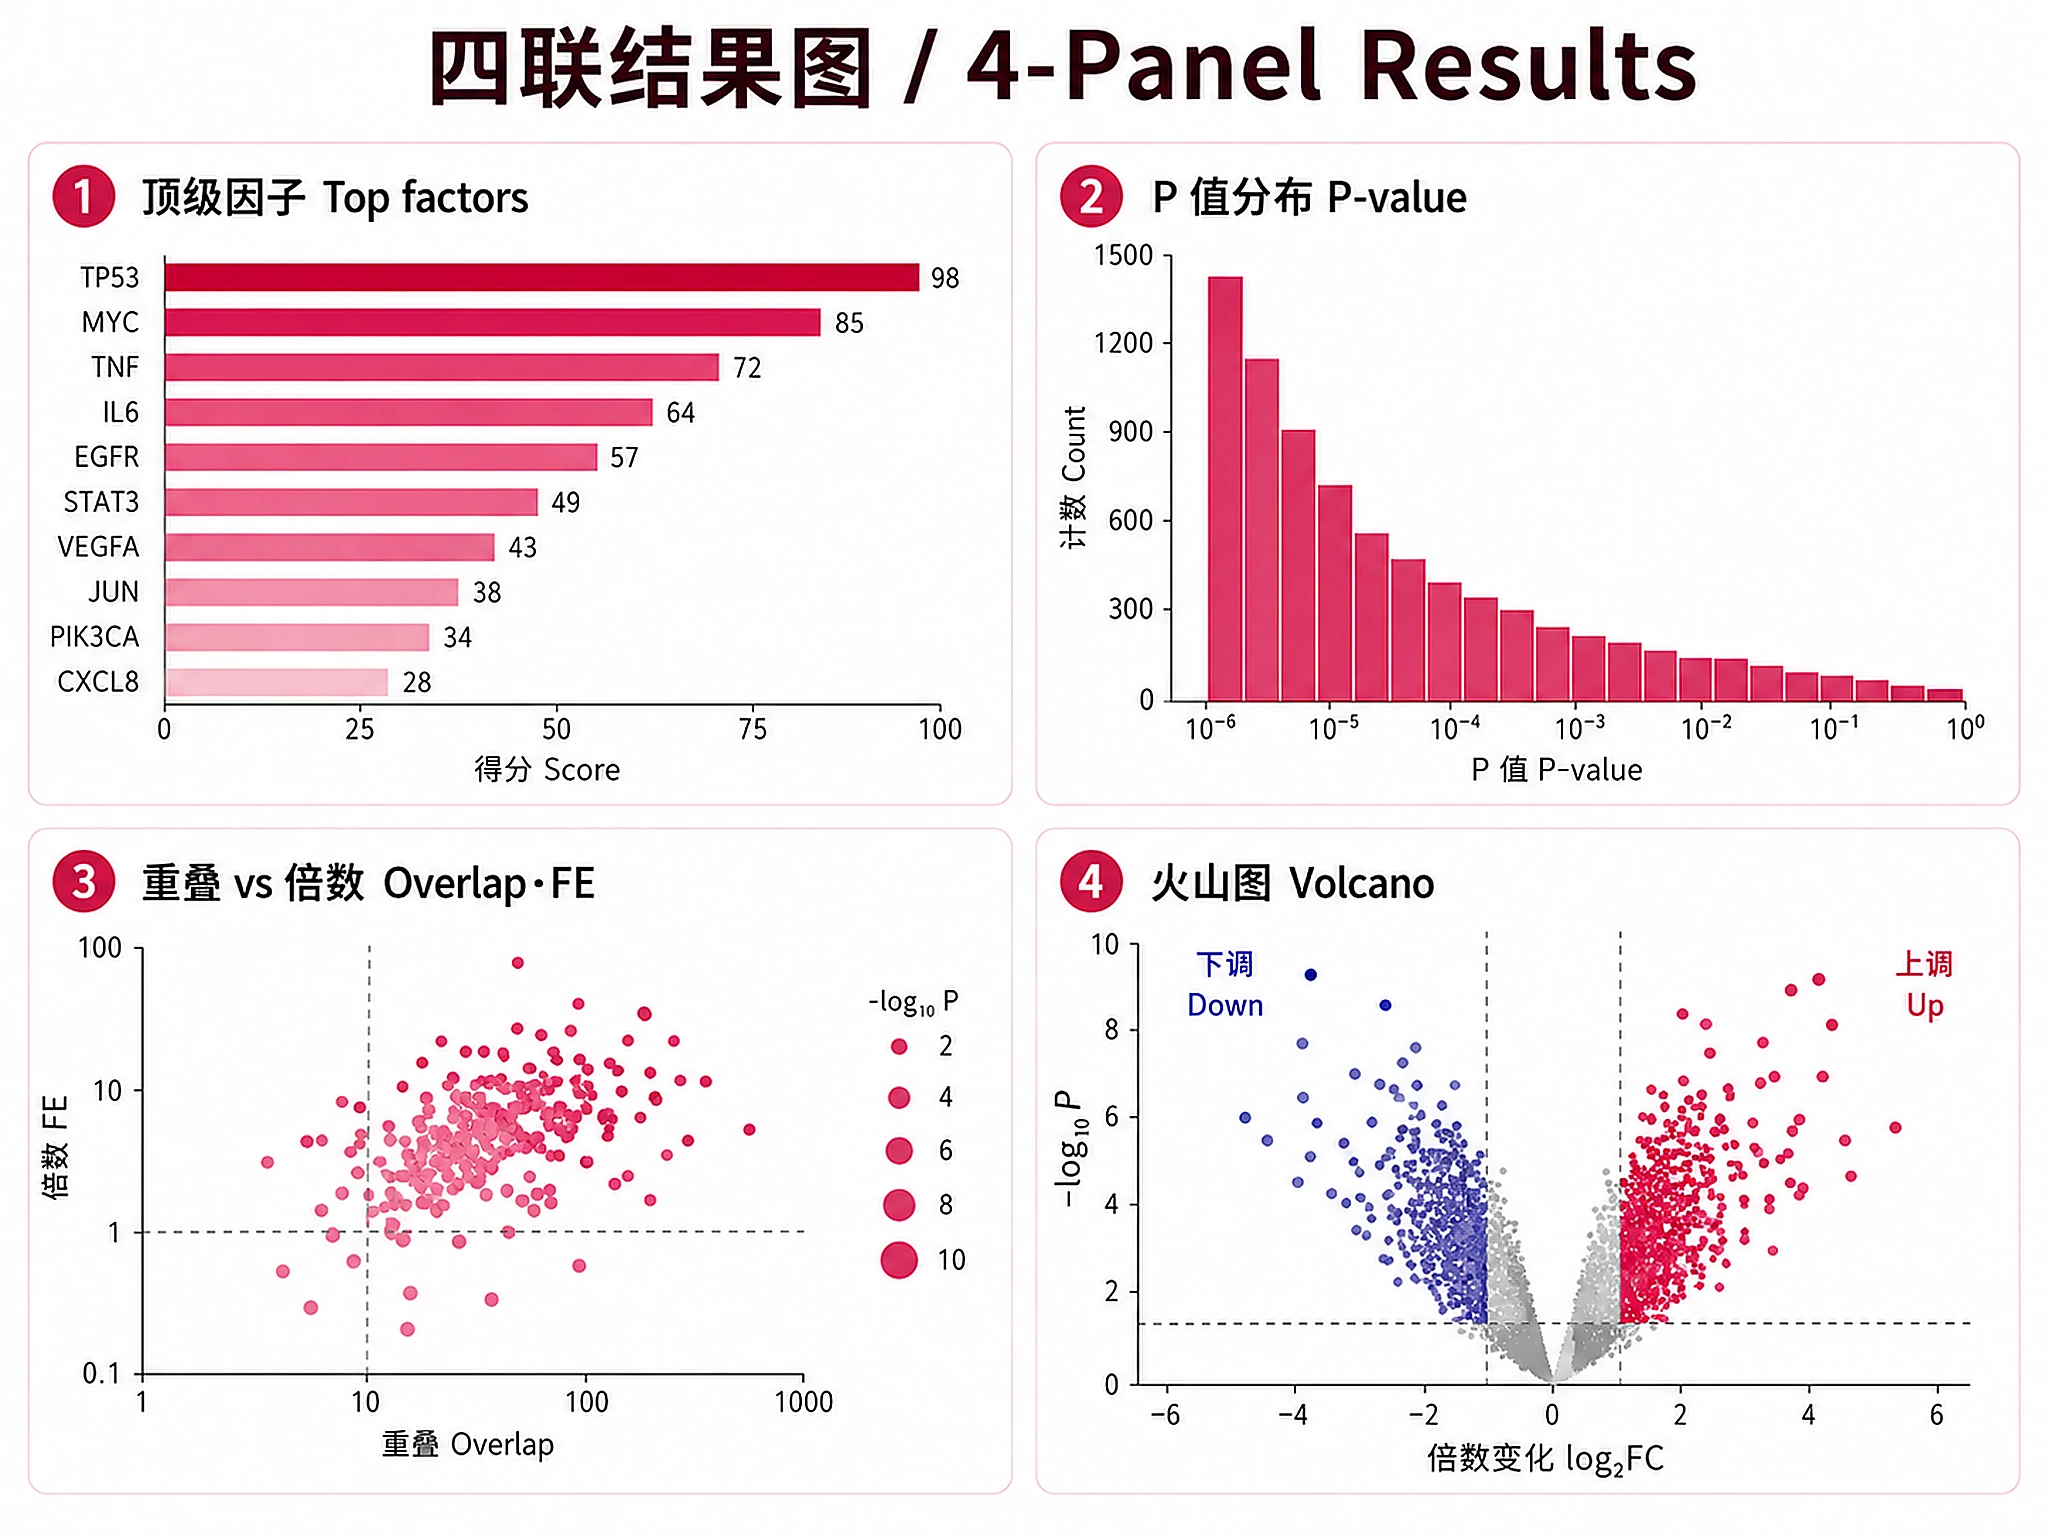
chipatlas_enrichment.png/.svg- 4-panel summary figure: top factors by significance, p-value distribution, overlap vs fold enrichment scatter, volcano plot (300 DPI)
Reports:
summary_report.md- Human-readable analysis summary
Clarification Questions
-
Input Files (ASK THIS FIRST):
- Do you have a gene list to analyze?
- Expected formats: Plain text (one gene per line), CSV with gene column, or DE results file
- Or use example data?
tp53_targets(5 genes, fast test) orimmune_response(20 genes)
-
Analysis parameters:
- Species/genome? Human hg38 (default), hg19, mouse mm10/mm9, rat rn6, fly, worm, yeast
- Experiment type? "TFs and others" (default), "Histone", "ATAC-Seq"
- Cell type class? "All cell types" (default), or specific: "Blood", "Neural", "Breast", etc.
- Peak threshold? 50 (default, balanced), 100 (stringent), 200 (very stringent)
- TSS window? 5000bp up/down (default), or custom distance_up/distance_down
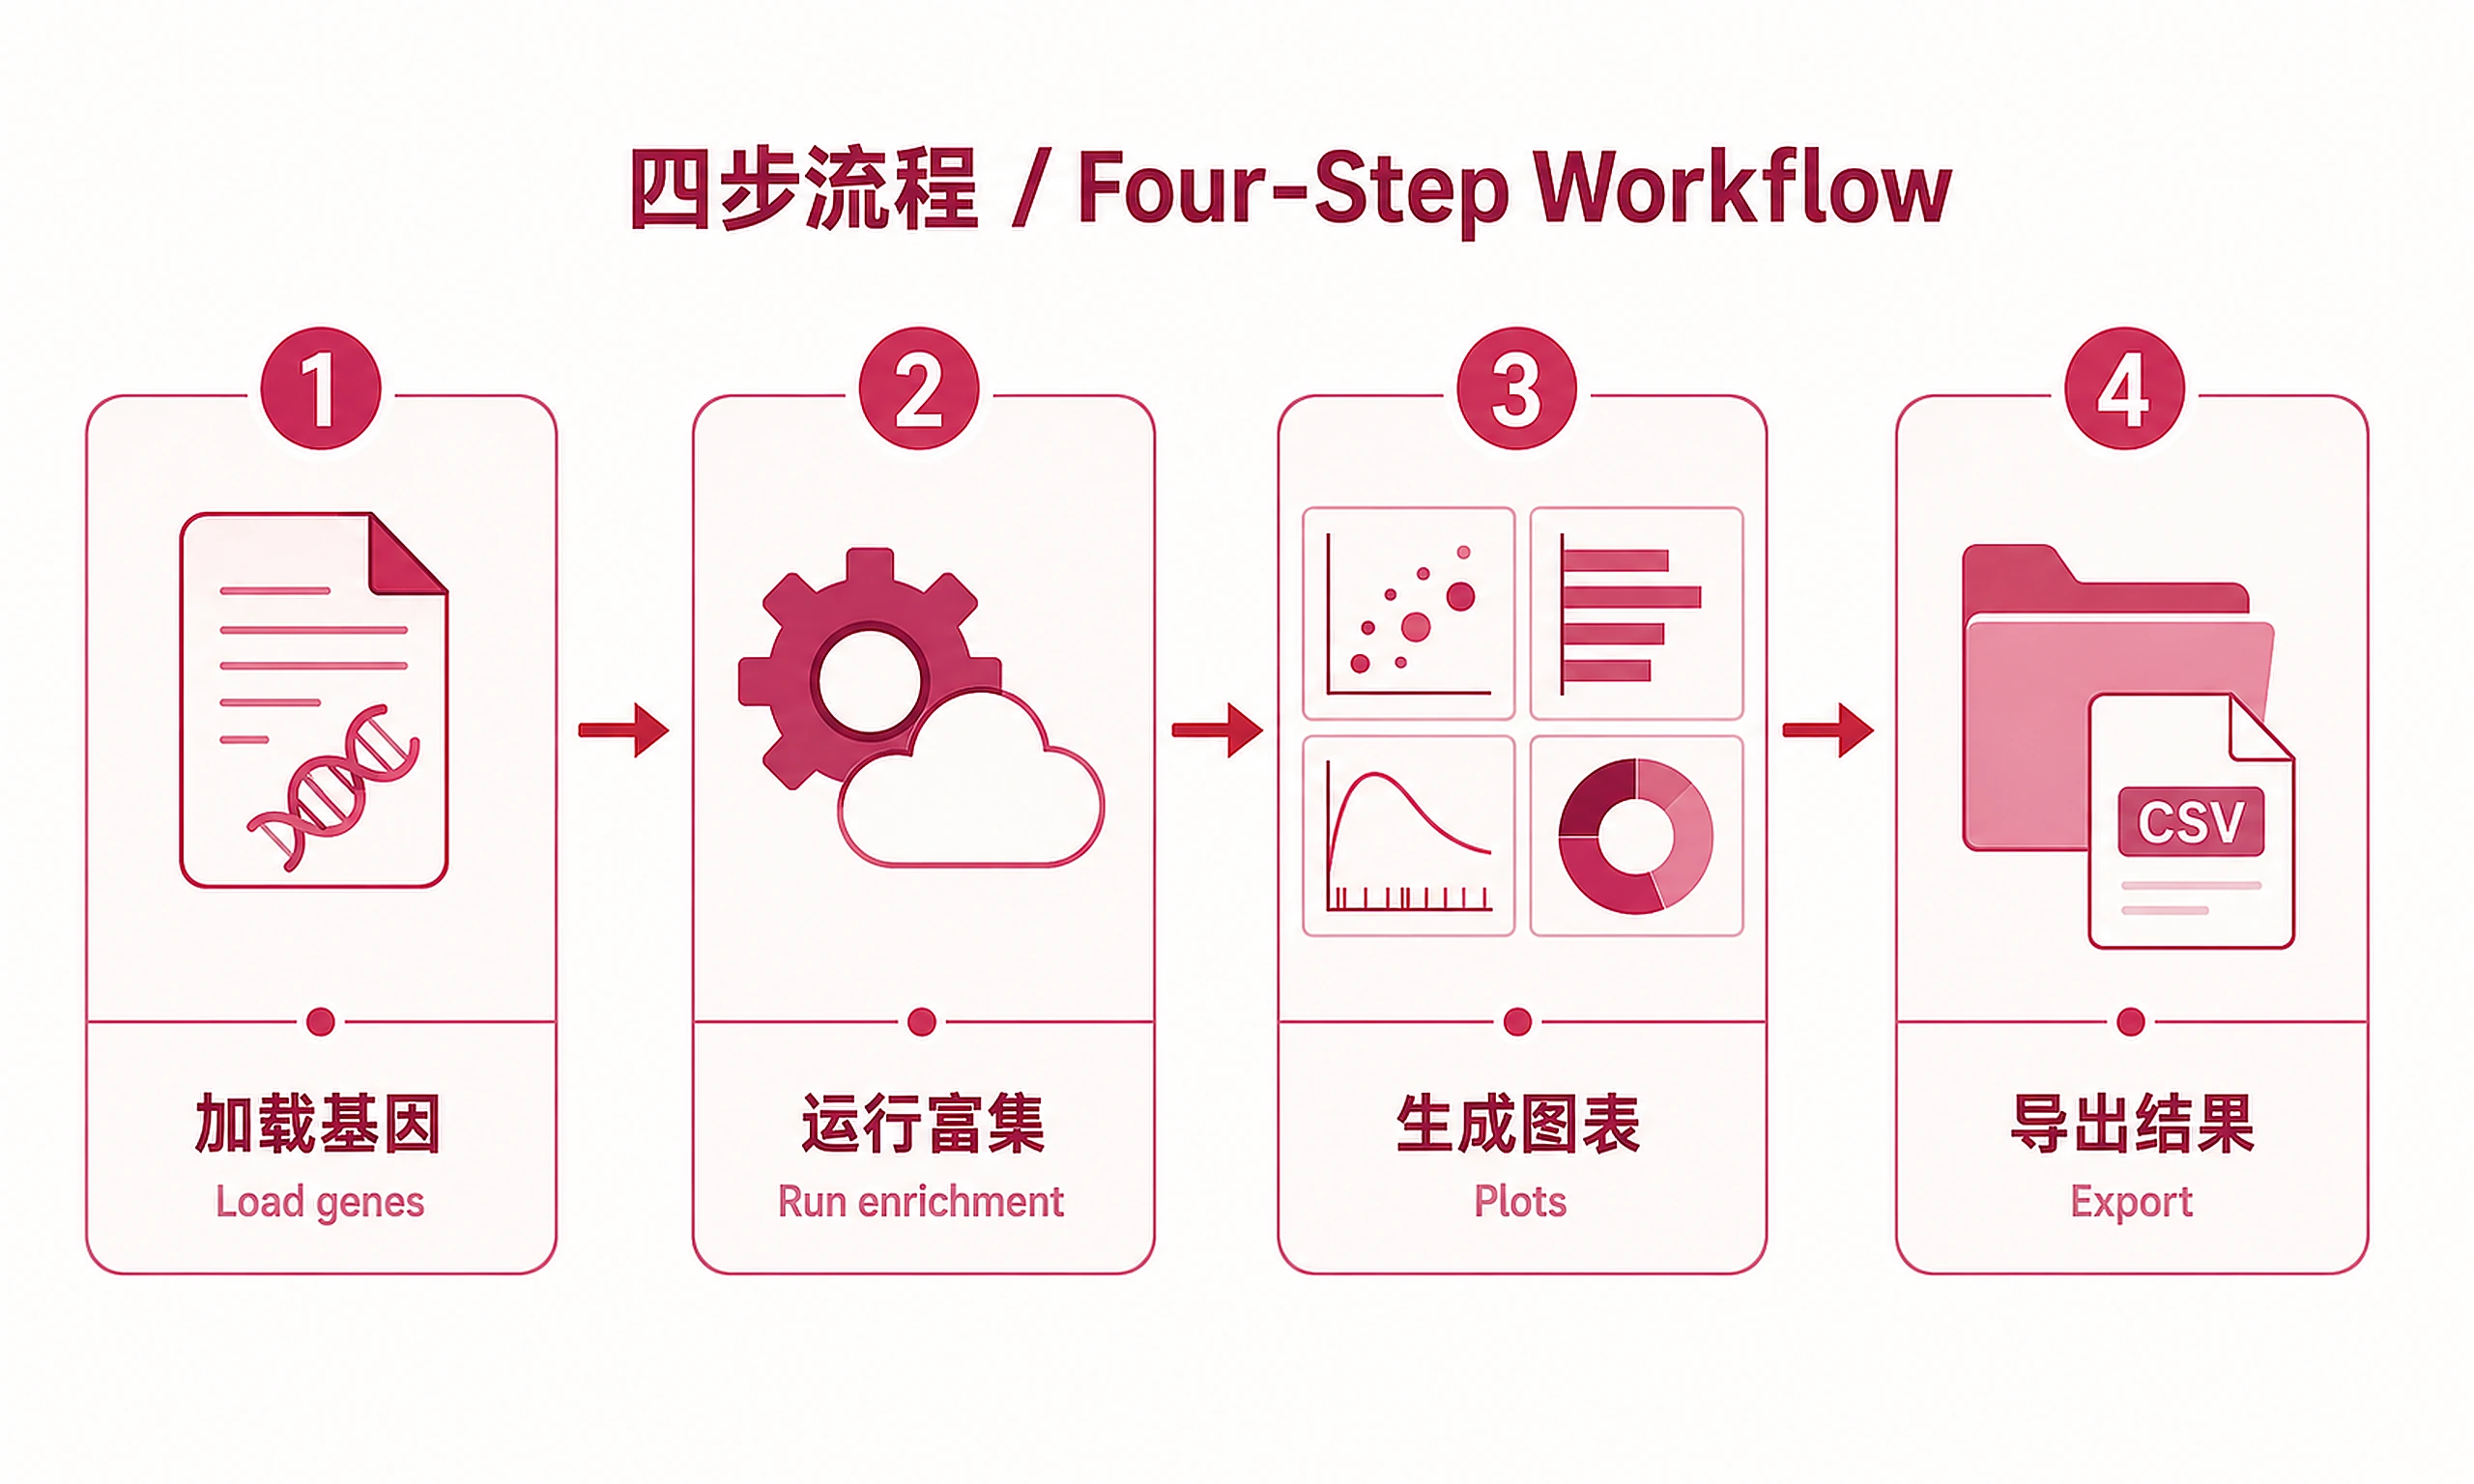
Standard Workflow
Step 1 - Load data:
# Option 1: Example data
from scripts.load_example_data import load_example_data
data = load_example_data("tp53_targets")
gene_list = data['genes']

# Option 2: Your own genes
# from scripts.load_user_data import load_user_data
# gene_list = load_user_data("my_genes.txt")
✅ VERIFICATION: "Data loaded successfully: {N} genes"
Step 2 - Run enrichment analysis:
from scripts.run_enrichment_workflow import run_enrichment_workflow

results = run_enrichment_workflow(
    gene_list=gene_list,
    genome="hg38",
    antigen_class="TFs and others",
    cell_class="All cell types",
    threshold=50,
    output_dir="chipatlas_results"
)
DO NOT write inline API query code. Just use the script.
✅ VERIFICATION: "Enrichment analysis completed successfully!"
Step 3 - Generate visualizations:
from scripts.generate_all_plots import generate_all_plots
generate_all_plots(results, output_dir="chipatlas_results", top_n=15)
DO NOT write inline plotting code. The script handles PNG + SVG with graceful fallback.
✅ VERIFICATION: "All visualizations generated successfully!"
Step 4 - Export results:
from scripts.export_all import export_all
export_all(results, output_dir="chipatlas_results")
DO NOT write custom export code. Use export_all().
✅ VERIFICATION: "=== Export Complete ==="
IF SCRIPTS FAIL - Hierarchy:
- Fix and Retry (90%) - Install missing package, check internet, re-run
- Modify Script (5%) - Edit the script, document changes
- Use as Reference (4%) - Read script, adapt approach
- Write from Scratch (1%) - Only if impossible, explain why
Common Issues
| Error | Cause | Solution |
|---|---|---|
| API 400 error | Invalid parameters | Both antigenClass and cellClass must be non-empty. Use "All cell types" for all cells. See references/chipatlas_metadata_format.md for valid values. |
| API timeout (>10 min) | Large analysis or server load | Normal for "All cell types" with many experiments. Wait up to 10 minutes. Reduce scope by selecting specific cell_class. |
| Ensembl API timeout | Network or rate limiting | The workflow script automatically retries once after 60 seconds. If it still fails, the Ensembl step is skipped — enrichment results are unaffected but lack coordinate verification. Report this to the user (see interpretation rules). |
| Gene not found | Retired symbol or typo | Script auto-retries with known aliases (e.g., IL8→CXCL8). Check HGNC (genenames.org) for current symbol. Only affects input_regions, not enrichment results. |
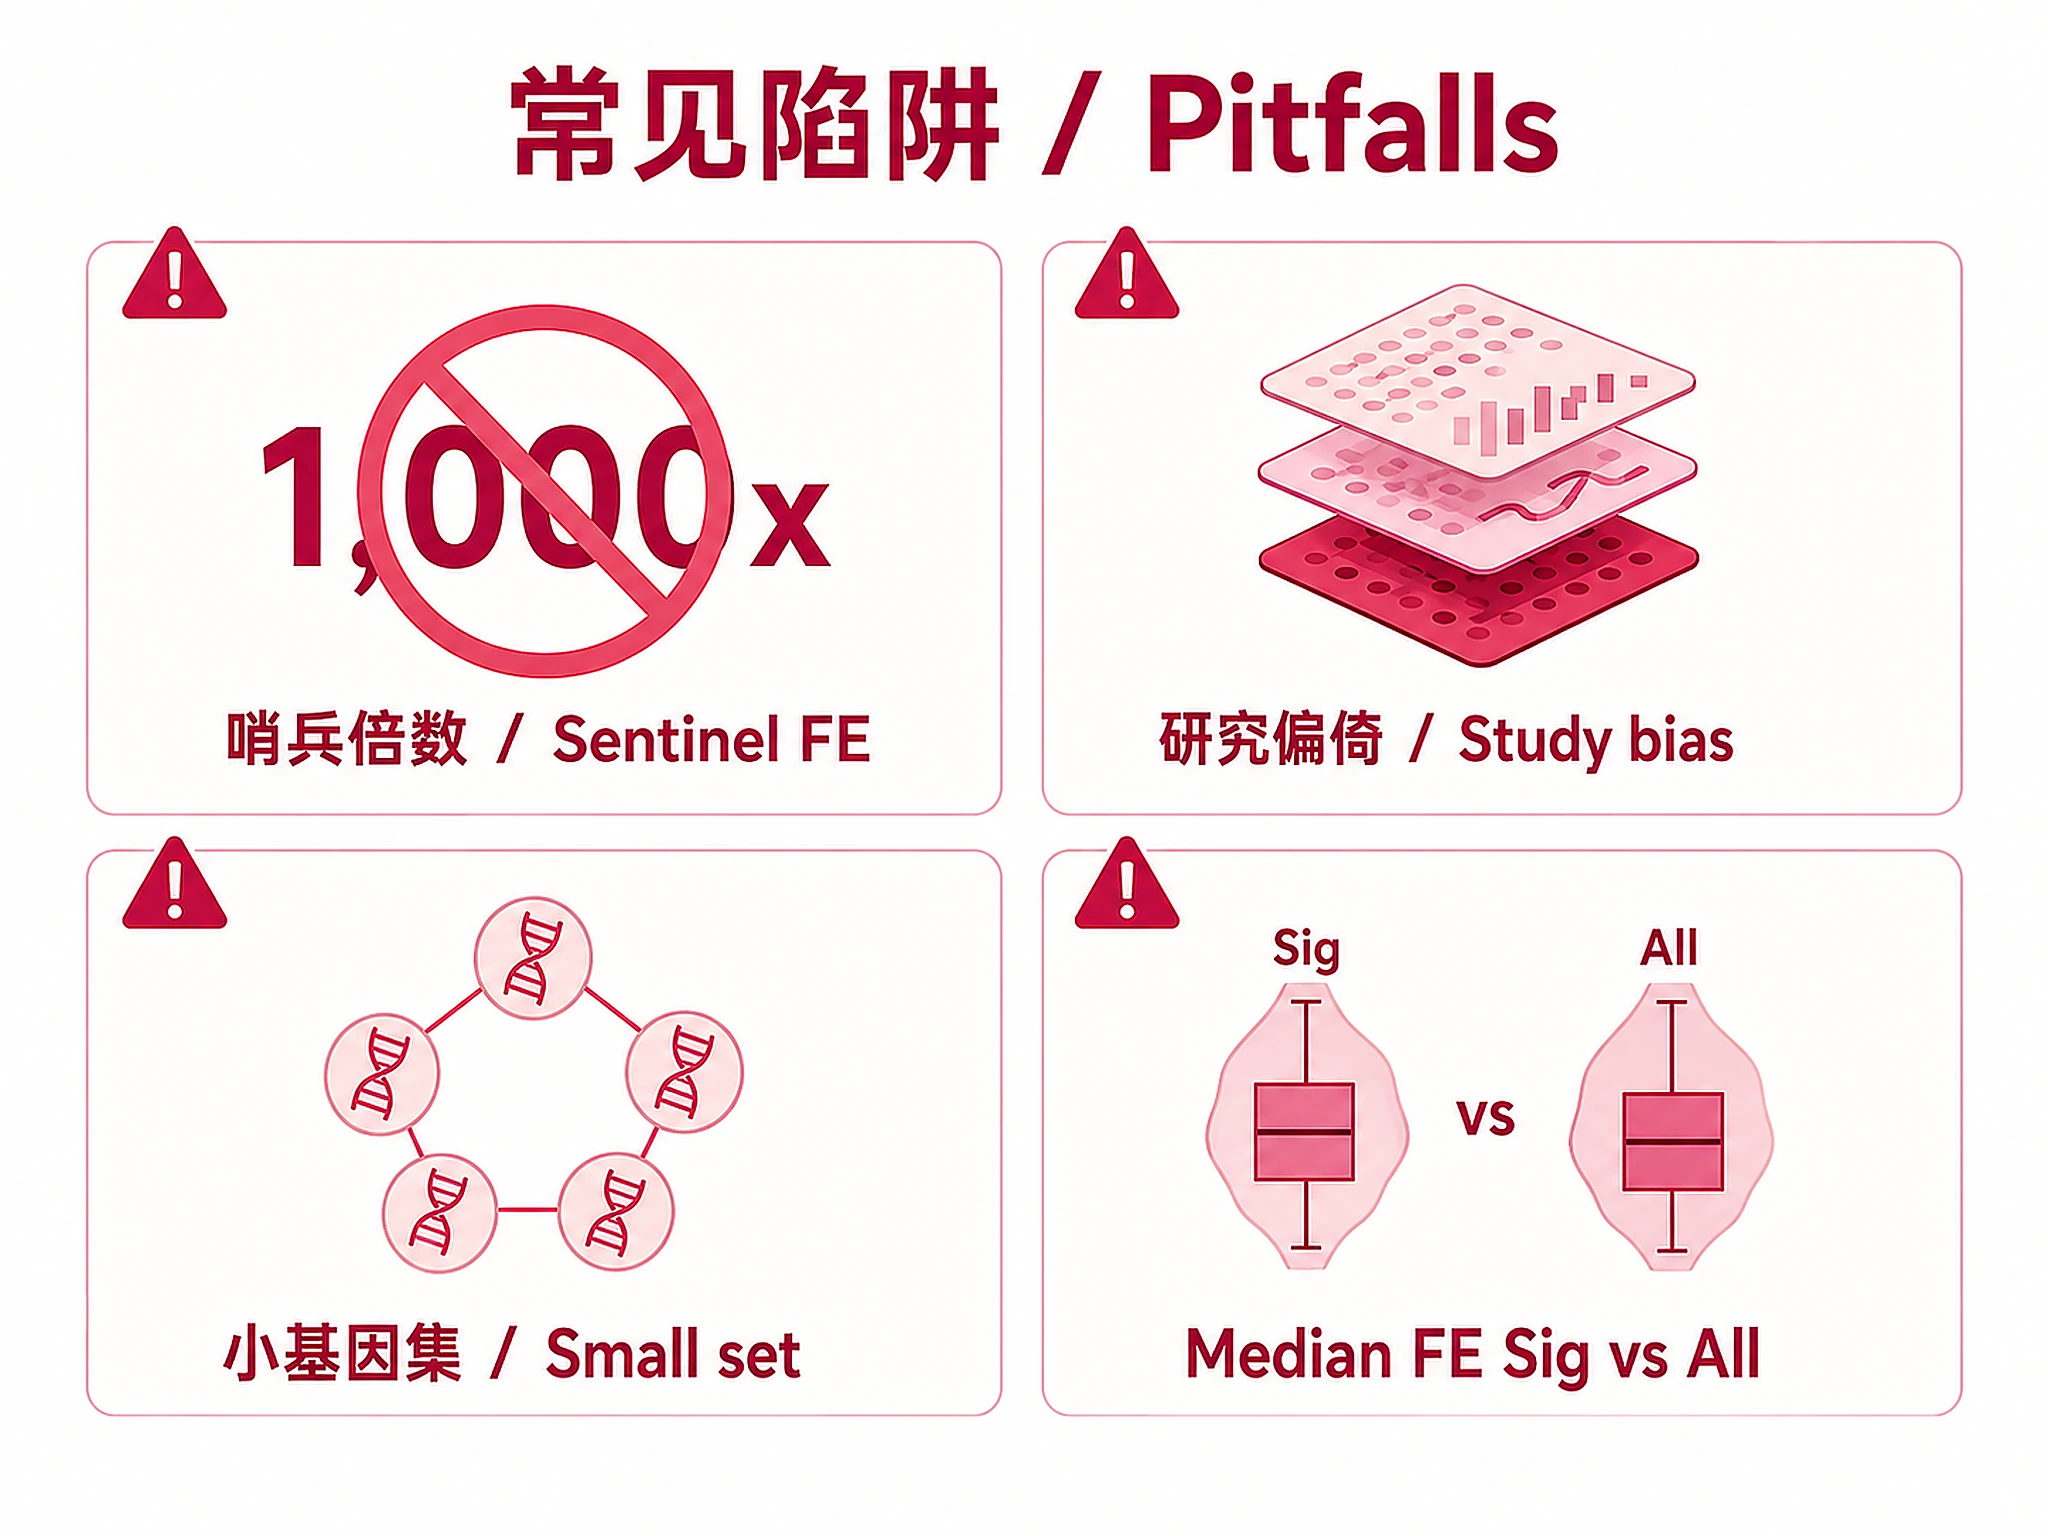
| Fold enrichment >100,000x | Sentinel value (zero background overlap) | Not a real enrichment. Results are ranked by Q-value so these are deprioritized. Check overlap count — genuine hits have ≥2 gene overlaps. |
| No significant enrichments | Gene set not enriched | Try: (1) Lower threshold (50), (2) Widen TSS window, (3) Check if genes are regulatory targets. |
| SVG export error | Missing optional dependency | Normal - generate_all_plots() handles fallback automatically. Both PNG and SVG attempted; PNG always created. |
Interpretation Guidelines
Q-value (BH-corrected, primary ranking): <0.001 highly significant, <0.01 significant, <0.05 genome-wide significant Fold Enrichment: >10x very strong, 5-10x strong, 2-5x moderate, <2x weak, >100,000x likely sentinel value (zero background overlap) Overlap Rate: >50% core regulon, 20-50% key targets, <20% subset/indirect Threshold: Controls MACS2 peak-calling stringency. Default 50 ≈ p<1e-5. See references/peak_thresholds.md.
⚠️ CRITICAL — When summarizing results to the user:
- Explain threshold meaning on first mention. When first discussing the threshold in your interpretation, state what it means in practical terms (e.g., "threshold=50 corresponds to MACS2 peak-calling at approximately p < 1e-5, balancing sensitivity and specificity"). Do not defer this explanation to a caveats section only.
- Cite overlap rates from
summary_report.md. Use the "Overlap Rate Summary" section for aggregate statistics. Do NOT round up or generalize (e.g., do not say "70–95%" if the report shows median 53%). - Distinguish experiments from factors. Multiple experiments for the same TF are independent datasets, not independent regulators. Use the "Top Factors (aggregated)" table when reporting unique factor counts.
- Acknowledge data availability bias. If a factor has many experiments (>20), note that its prominence partly reflects being well-studied. Cite the experiment count from the aggregated table.
- Use Median FE (Sig), not Median FE (All), to judge enrichment strength. The aggregated table has two FE columns: "Median FE (Sig)" uses only significant experiments (q < 0.05), while "Median FE (All)" averages across all experiments with ≥2 overlaps including non-significant ones. For factors with many experiments but few significant (e.g., Experiments=137, Sig=5), the "All" median is diluted by non-significant experiments and will dramatically understate actual enrichment. Do not conclude "weak enrichment" from a low Median FE (All) when Median FE (Sig) shows strong enrichment. Always cite Median FE (Sig) when discussing a factor's enrichment strength.
- Flag high experiment count with few significant. If a factor has many experiments (>20) but few are significant (Sig column), note that most experiments for this factor do not show enrichment near these genes — only a subset of cell types/conditions do. Compare the Sig vs Experiments columns across factors to illustrate specificity differences.
- Report gene discrepancies. If the summary report shows the API used fewer regions than genes submitted, mention this to the user with possible causes. Do NOT speculate about which specific gene was dropped — the API does not report this information.
- Report Ensembl vs API region count discrepancies prominently. The Ensembl coordinate lookup and the ChIP-Atlas API use different gene databases (Ensembl vs RefSeq). Discrepancies are expected and should be explained clearly:
- If Ensembl mapped 0 genes while the API analyzed N: explain that these are independent systems; enrichment results are valid but lack independent coordinate verification. Do not dismiss this as merely "optional."
- If Ensembl mapped fewer genes than the API (e.g., 4/5 vs 5/5): explain that the discrepancy reflects different database coverage — a gene may exist in RefSeq but have a failed/timed-out Ensembl lookup, or vice versa. State which system mapped how many genes and that the enrichment results use the API's own RefSeq mapping (not Ensembl).
- In both cases, the enrichment results themselves are valid. The Ensembl step provides independent verification only.
- Distinguish data-derived findings from background knowledge. If citing known biology to interpret results, explicitly flag it as "from prior knowledge" or "based on known biology," not a conclusion from this analysis. Examples requiring explicit flagging: "TP63 and TP73 share the same DNA-binding domain as TP53" (protein family knowledge), "BRD4 is a bromodomain protein that binds acetylated histones at active promoters" (general factor biology), "these are canonical NF-κB targets" (pathway knowledge). Every such claim needs a phrase like "from prior knowledge of p53 family biology" — do not let background claims blend implicitly with data-derived findings.
- Report the total count of significant factors, not just the top 10. The aggregated table shows the top 10, but the summary report header states the total count (e.g., "Top 10 of 29 significantly enriched factors"). Always report this total — do not say "10 factors were identified" when more exist. Mention notable omissions if biologically relevant factors appear in the full
enrichment_results_significant.csv. - Discuss all factors in the aggregated top table. Every factor in the "Top Factors (aggregated)" table should be mentioned or briefly acknowledged. Do not silently omit factors — if one is less biologically interpretable, note that rather than skipping it.
- Note multiple testing across aggregated factors. The Q-values in the aggregated table are BH-corrected across experiments, not across factors. Each factor's "best Q-value" is cherry-picked from its most significant experiment. Interpreting all 10 top factors as independent discoveries overstates confidence — note this when presenting the aggregated table (e.g., "these per-experiment Q-values do not account for testing across multiple factors").
- Small gene sets (≤10 genes): Lead with exploratory framing and connect every moderate-enrichment discussion to this caveat. Frame the analysis as exploratory/demonstrative, not a powered study. Your opening summary MUST lead with the exploratory nature (e.g., "As an exploratory analysis with only 5 genes..." or "This demonstration-scale analysis with N genes identified...") rather than leading with the count of significant enrichments, which sounds more impressive than warranted at small N. Each gene contributes a large fraction of the overlap rate, so individual gene inclusion/exclusion substantially changes results. State this limitation prominently — do not bury it in a caveats section at the end. Every time you discuss a factor with moderate fold enrichment (2–10x), you MUST explicitly note that with only N input genes, a single gene's inclusion/exclusion could eliminate the signal entirely (e.g., "with only 5 input genes, this moderate enrichment should be interpreted with extra caution — removing a single gene could eliminate the signal").
- Cite ChIP-Atlas publications. When presenting results, cite the database: Zou et al. (2024) for ChIP-Atlas 3.0 and Oki et al. (2018) for the original ChIP-Atlas. Include these in any written summary or report to acknowledge the data source.
Caveats (MUST include in any results summary):
- Results biased toward well-studied factors and common cell types. Heavily studied TFs may appear enriched partly due to data availability (more experiments = more chances to be significant).
- Multiple experiments per factor are independent datasets, not independent biological signals. Use the aggregated factor table for deduplicated counts.
- Results depend on the peak-calling threshold used. Discuss the threshold chosen and note that results may differ at other stringencies.
- Validate key findings with orthogonal methods (expression, perturbation, motif analysis).
Suggested Next Steps
- Threshold sensitivity check — Re-run at threshold=100 or 200 to test whether top factors remain significant at more stringent peak-calling cutoffs. Offer this to the user as a robustness check (e.g., "Would you like me to re-run at threshold=100 to confirm these findings are robust?").
- Validate top factors with literature, expression correlation, perturbation data
- Cell-type-specific analysis with
cell_classmatching your experimental system - Motif analysis of promoter regions for top factor binding motifs
- Regulatory network construction with top factors and target genes
Related Skills
- gene-correlation-archs4 - Co-expression across 600K RNA-seq samples
- grn-pyscenic - Gene regulatory networks from single-cell data
References
- Zou et al. (2024). ChIP-Atlas 3.0: a data-mining suite to explore chromosome architecture. Nucleic Acids Research. doi:10.1093/nar/gkad884
- Zou et al. (2022). ChIP-Atlas 2021 update. Nucleic Acids Research. doi:10.1093/nar/gkab933
- Oki et al. (2018). ChIP-Atlas: a data-mining suite. EMBO Reports 19(12):e46255. doi:10.15252/embr.201846255
- ChIP-Atlas: https://chip-atlas.org
- API documentation: See references/chipatlas_metadata_format.md
- Enrichment statistics: See references/enrichment_statistics.md
Code preview
scripts/__init__.py
# chip-atlas-peak-enrichment scripts packagescripts/convert_genes_to_regions.py
"""
Convert gene symbols to promoter regions using Ensembl REST API.

Supports batch lookup (POST /lookup/symbol) for all genes in one request,
with sequential fallback for robustness.

Includes rate limiting and error handling for robust API queries.
"""

import requests
import time


# Common gene symbol renames (retired → current HGNC symbol)
# Source: HGNC (genenames.org) approved symbol changes
GENE_ALIASES = {
    # Interleukins/chemokines
    'IL8': 'CXCL8',
    'IL8A': 'CXCL8',
    'GRO1': 'CXCL1',
    'GRO2': 'CXCL2',
    'GRO3': 'CXCL3',
    'SDF1': 'CXCL12',
    'MIG': 'CXCL9',
    'IP10': 'CXCL10',
    'MCP1': 'CCL2',
    'MIP1A': 'CCL3',
    'MIP1B': 'CCL4',
    'RANTES': 'CCL5',
    # Apoptosis/signaling
    'TNFSF6': 'FASLG',
    'APO1': 'FAS',
    'TRAIL': 'TNFSF10',
    # Epigenetic regulators
    'MLL': 'KMT2A',
    'MLL2': 'KMT2D',
    'MLL3': 'KMT2C',
    # Other common renames
    'P53': 'TP53',
    'ERK1': 'MAPK3',
    'ERK2': 'MAPK1',
    'P38': 'MAPK14',
}


def convert_genes_to_regions(gene_list, genome="hg38", upstream=2000, downstream=500):
    """
    Convert gene symbols to promoter regions via Ensembl API.

    Parameters:
    -----------
    gene_list : list of str
        Gene symbols (e.g., ['TP53', 'MYC'])
    genome : str
        Genome assembly ('hg38', 'hg19', 'mm10', 'mm9')
    upstream : int
        Bases upstream of TSS
    downstream : int
        Bases downstream of TSS

    Returns:
    --------
    tuple: (successful_regions, failed_genes)
        successful_regions: list of tuples (chr, start, end, gene, strand)
        failed_genes: list of str (genes that couldn't be mapped)

    Notes:
    ------
    - Rate limited to 0.5s between requests
    - Retries on timeout (max 3 attempts)
    - Skips genes not found in Ensembl
    """

    # Map genome assembly prefix to Ensembl species name
    _GENOME_TO_SPECIES = {
        'hg': 'human', 'mm': 'mouse', 'rn': 'rat',
        'dm': 'drosophila_melanogaster', 'ce': 'caenorhabditis_elegans',
        'sacCer': 'saccharomyces_cerevisiae',
    }
    prefix = next((k for k in _GENOME_TO_SPECIES if genome.startswith(k)), None)
scripts/export_all.py
"""
Export all ChIP-Atlas enrichment results (Step 4).

Exports:
1. analysis_object.pkl - Complete results for downstream use
2. enrichment_results_all.csv - All experiments analyzed
3. enrichment_results_significant.csv - Significant results (q < 0.05)
4. enrichment_results_top20.csv - Top 20 by significance (q-value)
5. failed_genes.txt - Genes that couldn't be mapped
6. summary_report.md - Human-readable summary
"""

import os
import pickle
from datetime import datetime


def export_all(results, output_dir="chipatlas_results"):
    """
    Export all ChIP-Atlas enrichment results with pickle object.

    Parameters:
    -----------
    results : dict
        Results from run_enrichment_workflow()
    output_dir : str
        Output directory

    Returns:
    --------
    None
        Prints export messages and verification

    Verification:
    -------------
    Prints "=== Export Complete ===" when done
    """

    os.makedirs(output_dir, exist_ok=True)

    print("\n" + "="*70)
    print("EXPORTING RESULTS")
    print("="*70 + "\n")

    # 1. Save analysis object as pickle (CRITICAL for downstream skills)
    print("1. Saving analysis objects for downstream use...")

    analysis_object = {
        'enrichment_results': results['enrichment_results'],
        'input_genes': results['input_genes'],
        'input_regions': results['input_regions'],
        'failed_genes': results.get('failed_genes', []),
        'metadata': results['metadata'],
        'parameters': results['parameters'],
        'n_genes': len(results['input_genes']),
        'n_regions': len(results['input_regions']),
        'n_experiments': len(results['enrichment_results']),
        'n_significant': len(results['enrichment_results'][
            results['enrichment_results']['q_value'] < 0.05
        ]),
        'timestamp': datetime.now().isoformat()
    }

    pickle_path = os.path.join(output_dir, "analysis_object.pkl")
    with open(pickle_path, 'wb') as f:
        pickle.dump(analysis_object, f)

    print(f"   Saved: {pickle_path}")
    print(f"   (Load with: import pickle; obj = pickle.load(open('analysis_object.pkl', 'rb')))")

    # 2. Export all results to CSV
    print("\n2. Exporting enrichment results...")

    all_results_path = os.path.join(output_dir, "enrichment_results_all.csv")
    results['enrichment_results'].to_csv(all_results_path, index=False)
    print(f"   Saved: {all_results_path} ({len(results['enrichment_results'])} experiments)")

    # 3. Export significant results (q < 0.05, BH-corrected)
    significant = results['enrichment_results'][
        results['enrichment_results']['q_value'] < 0.05
Companion files
| Type | Path | Bytes |
|---|---|---|
| Markdown | references/chipatlas_metadata_format.md | 3,664 |
| Markdown | references/enrichment_statistics.md | 4,652 |
| Markdown | references/peak_thresholds.md | 2,139 |
| Markdown | references/promoter_definitions.md | 1,963 |
| Python | scripts/__init__.py | 45 |
| Python | scripts/convert_genes_to_regions.py | 8,274 |
| Python | scripts/export_all.py | 24,893 |
| Python | scripts/filter_experiments.py | 3,926 |
| Python | scripts/generate_all_plots.py | 9,807 |
| Python | scripts/load_example_data.py | 3,512 |
| Python | scripts/load_user_data.py | 5,224 |
| Python | scripts/query_chipatlas_api.py | 10,238 |
| Python | scripts/run_enrichment_workflow.py | 9,952 |
| Markdown | SKILL.md | 16,399 |
| JSON | skill.meta.json | 2,807 |