Pooled CRISPR Screens
Analyse pooled CRISPR screens with scRNA-seq readout.
Overview
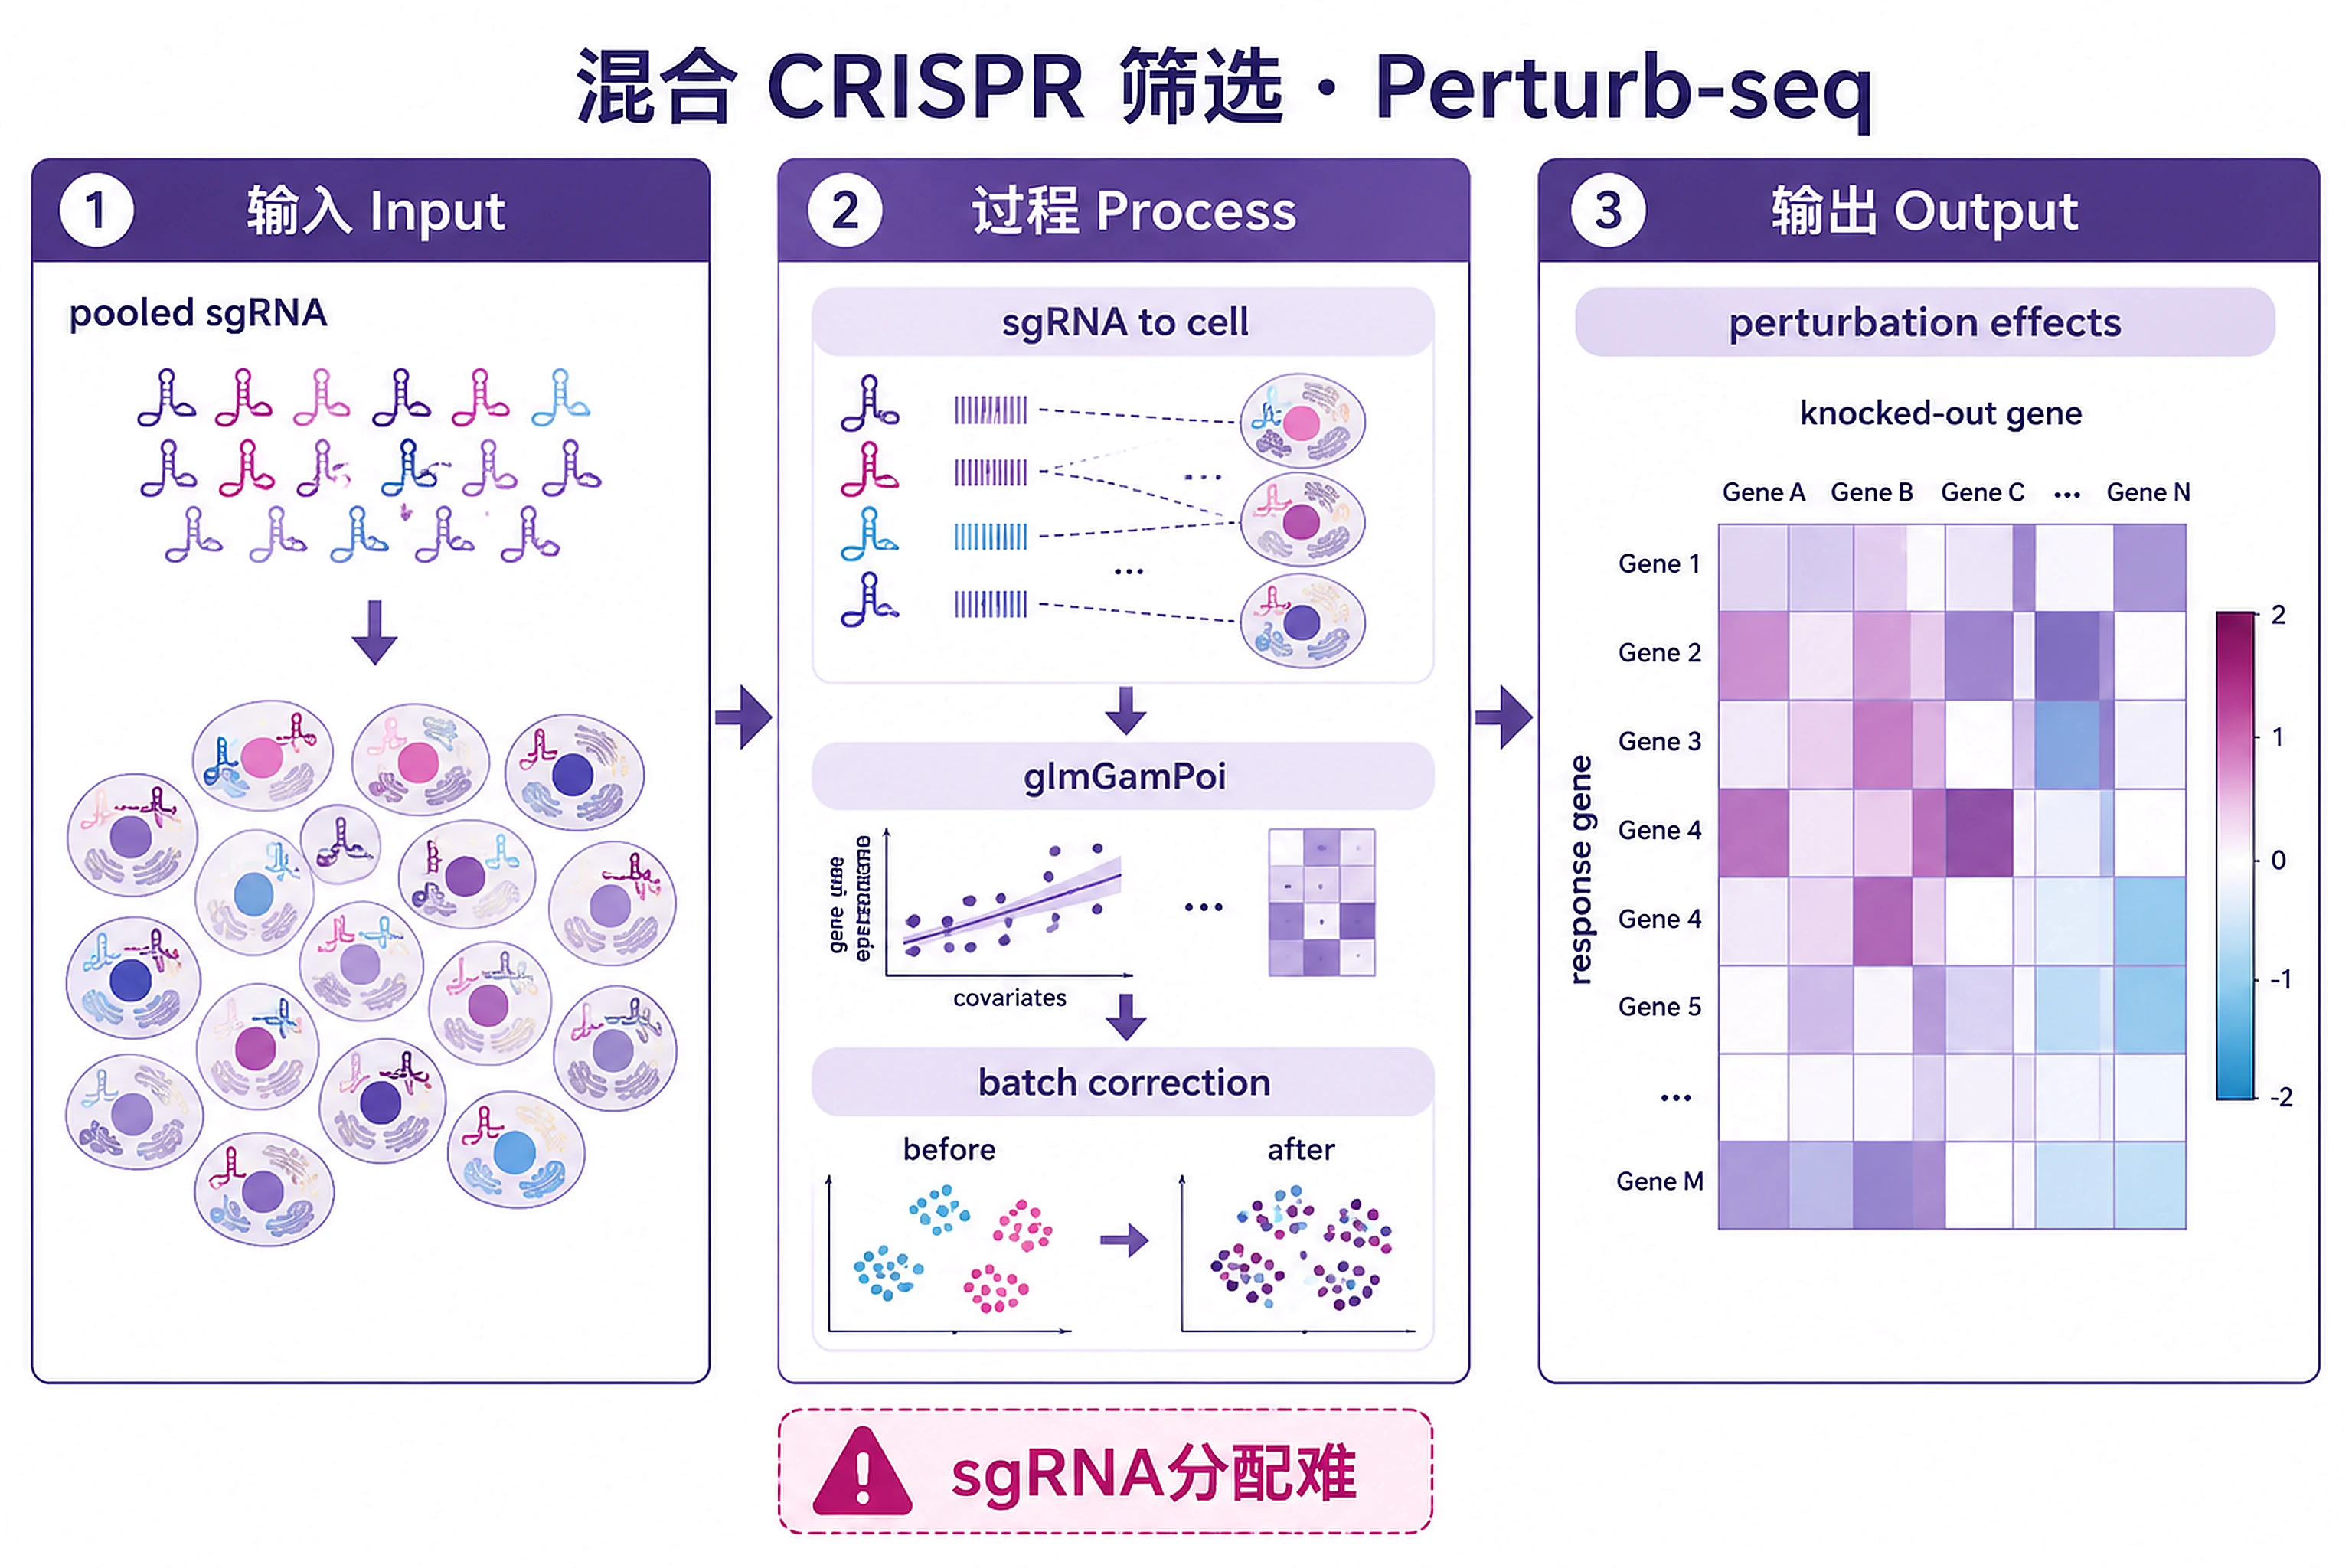
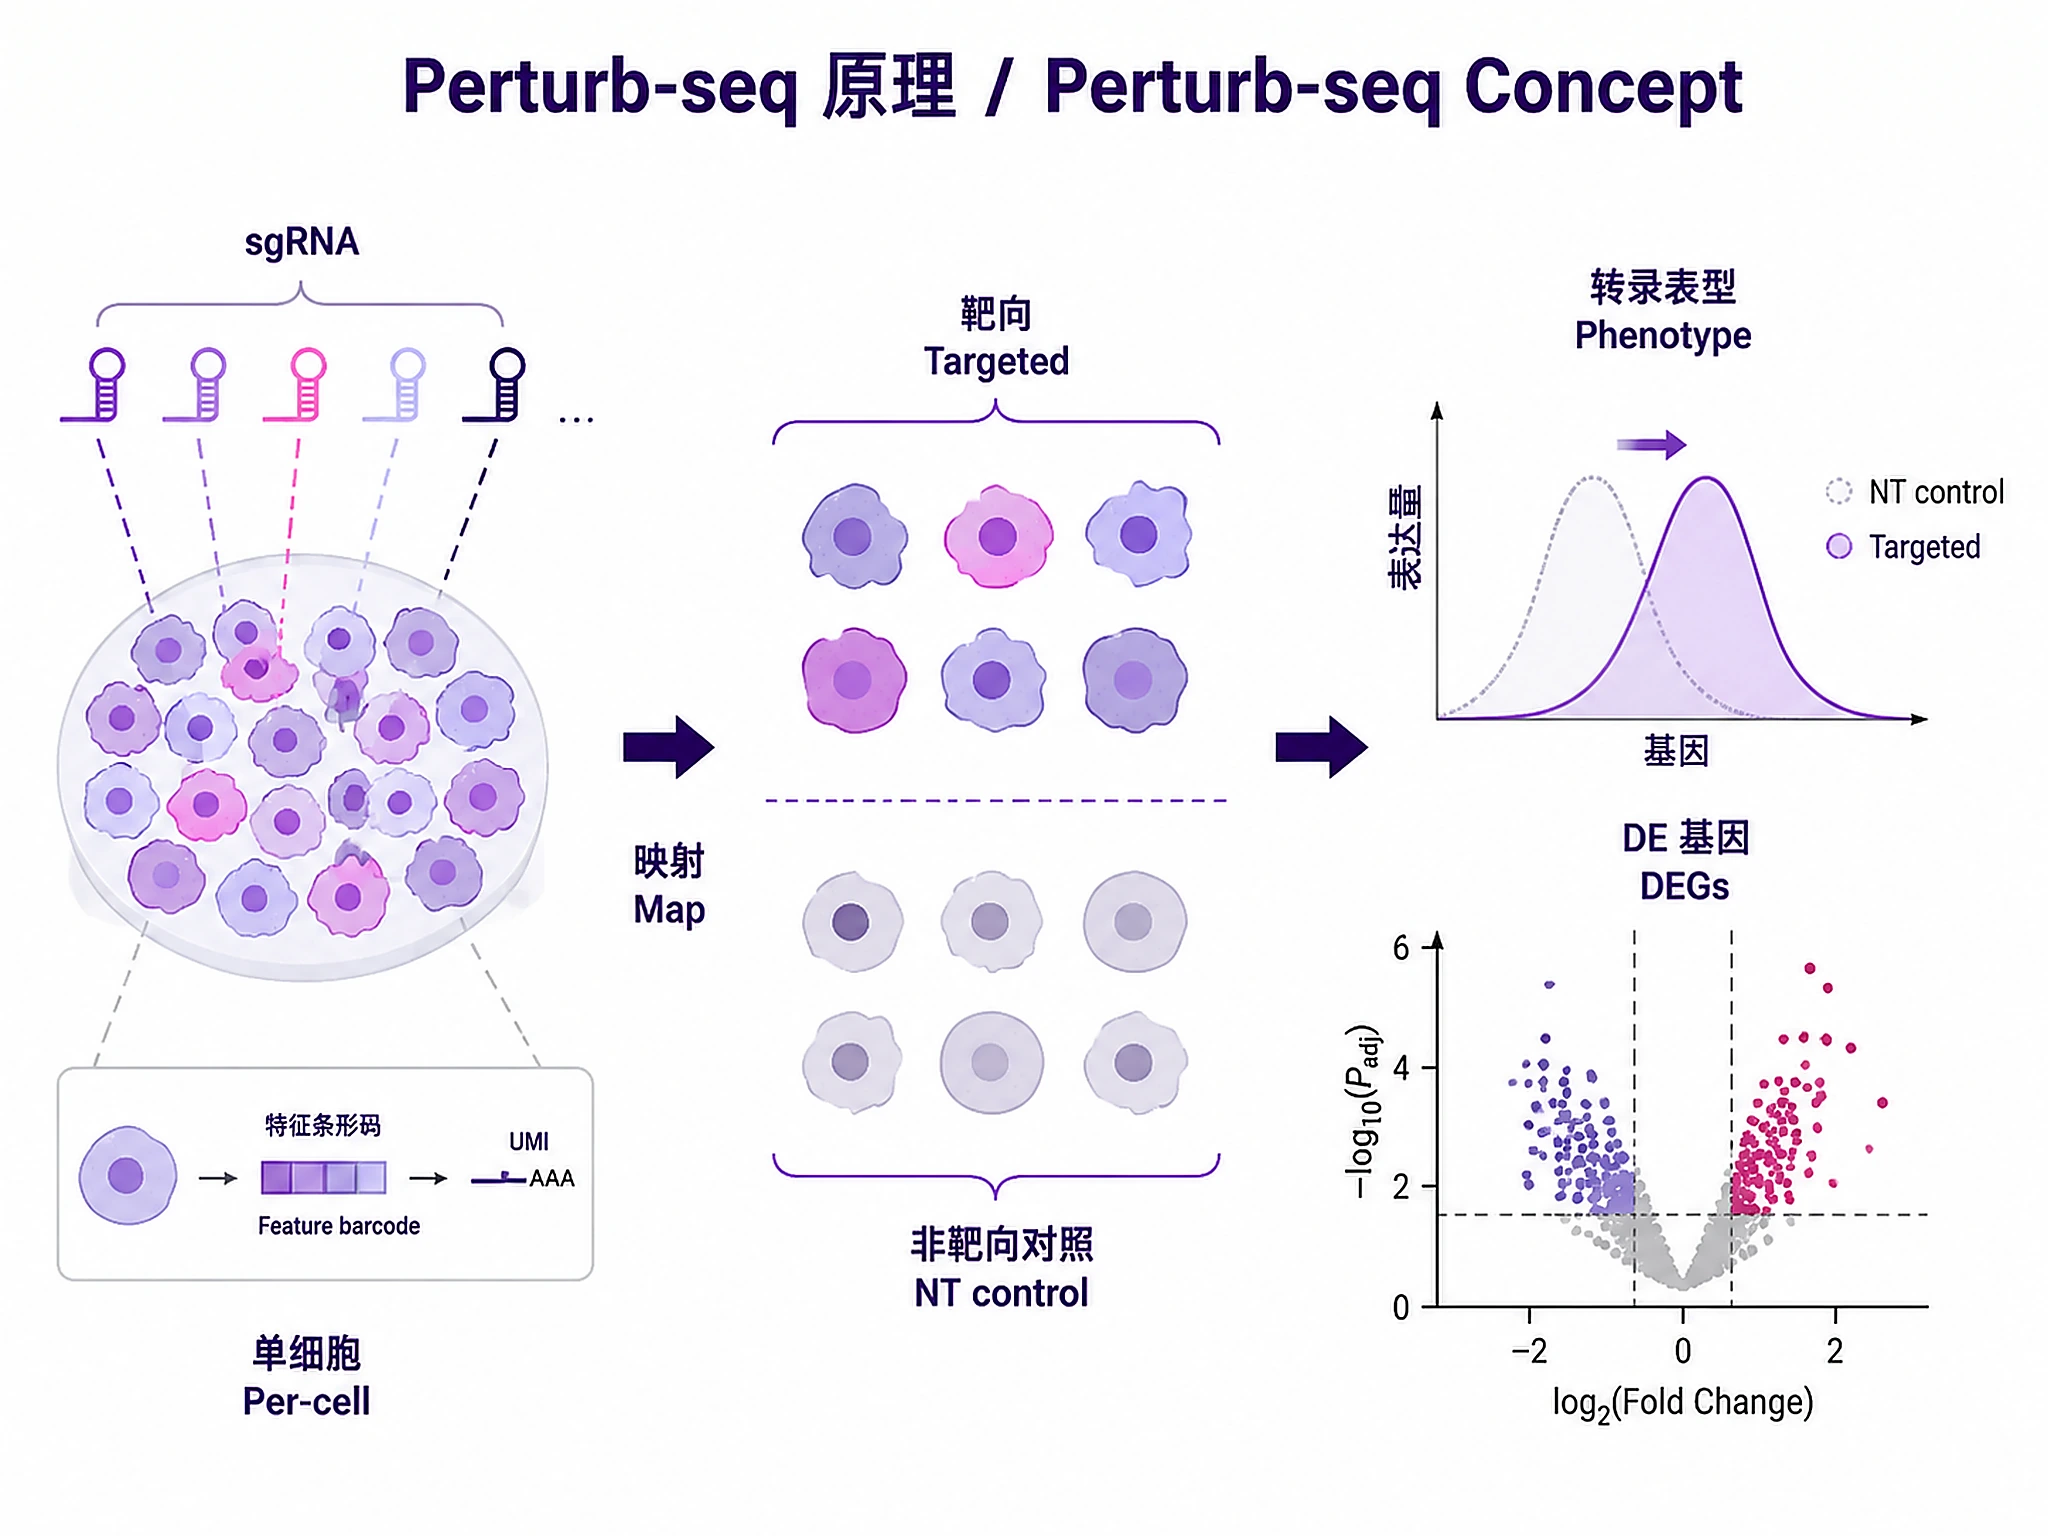
Problem. Perturb many genes; read each effect transcriptomically.
Learning goals
- Functional genomics: perturb and observe
- Assigning guides to cells is the hard part
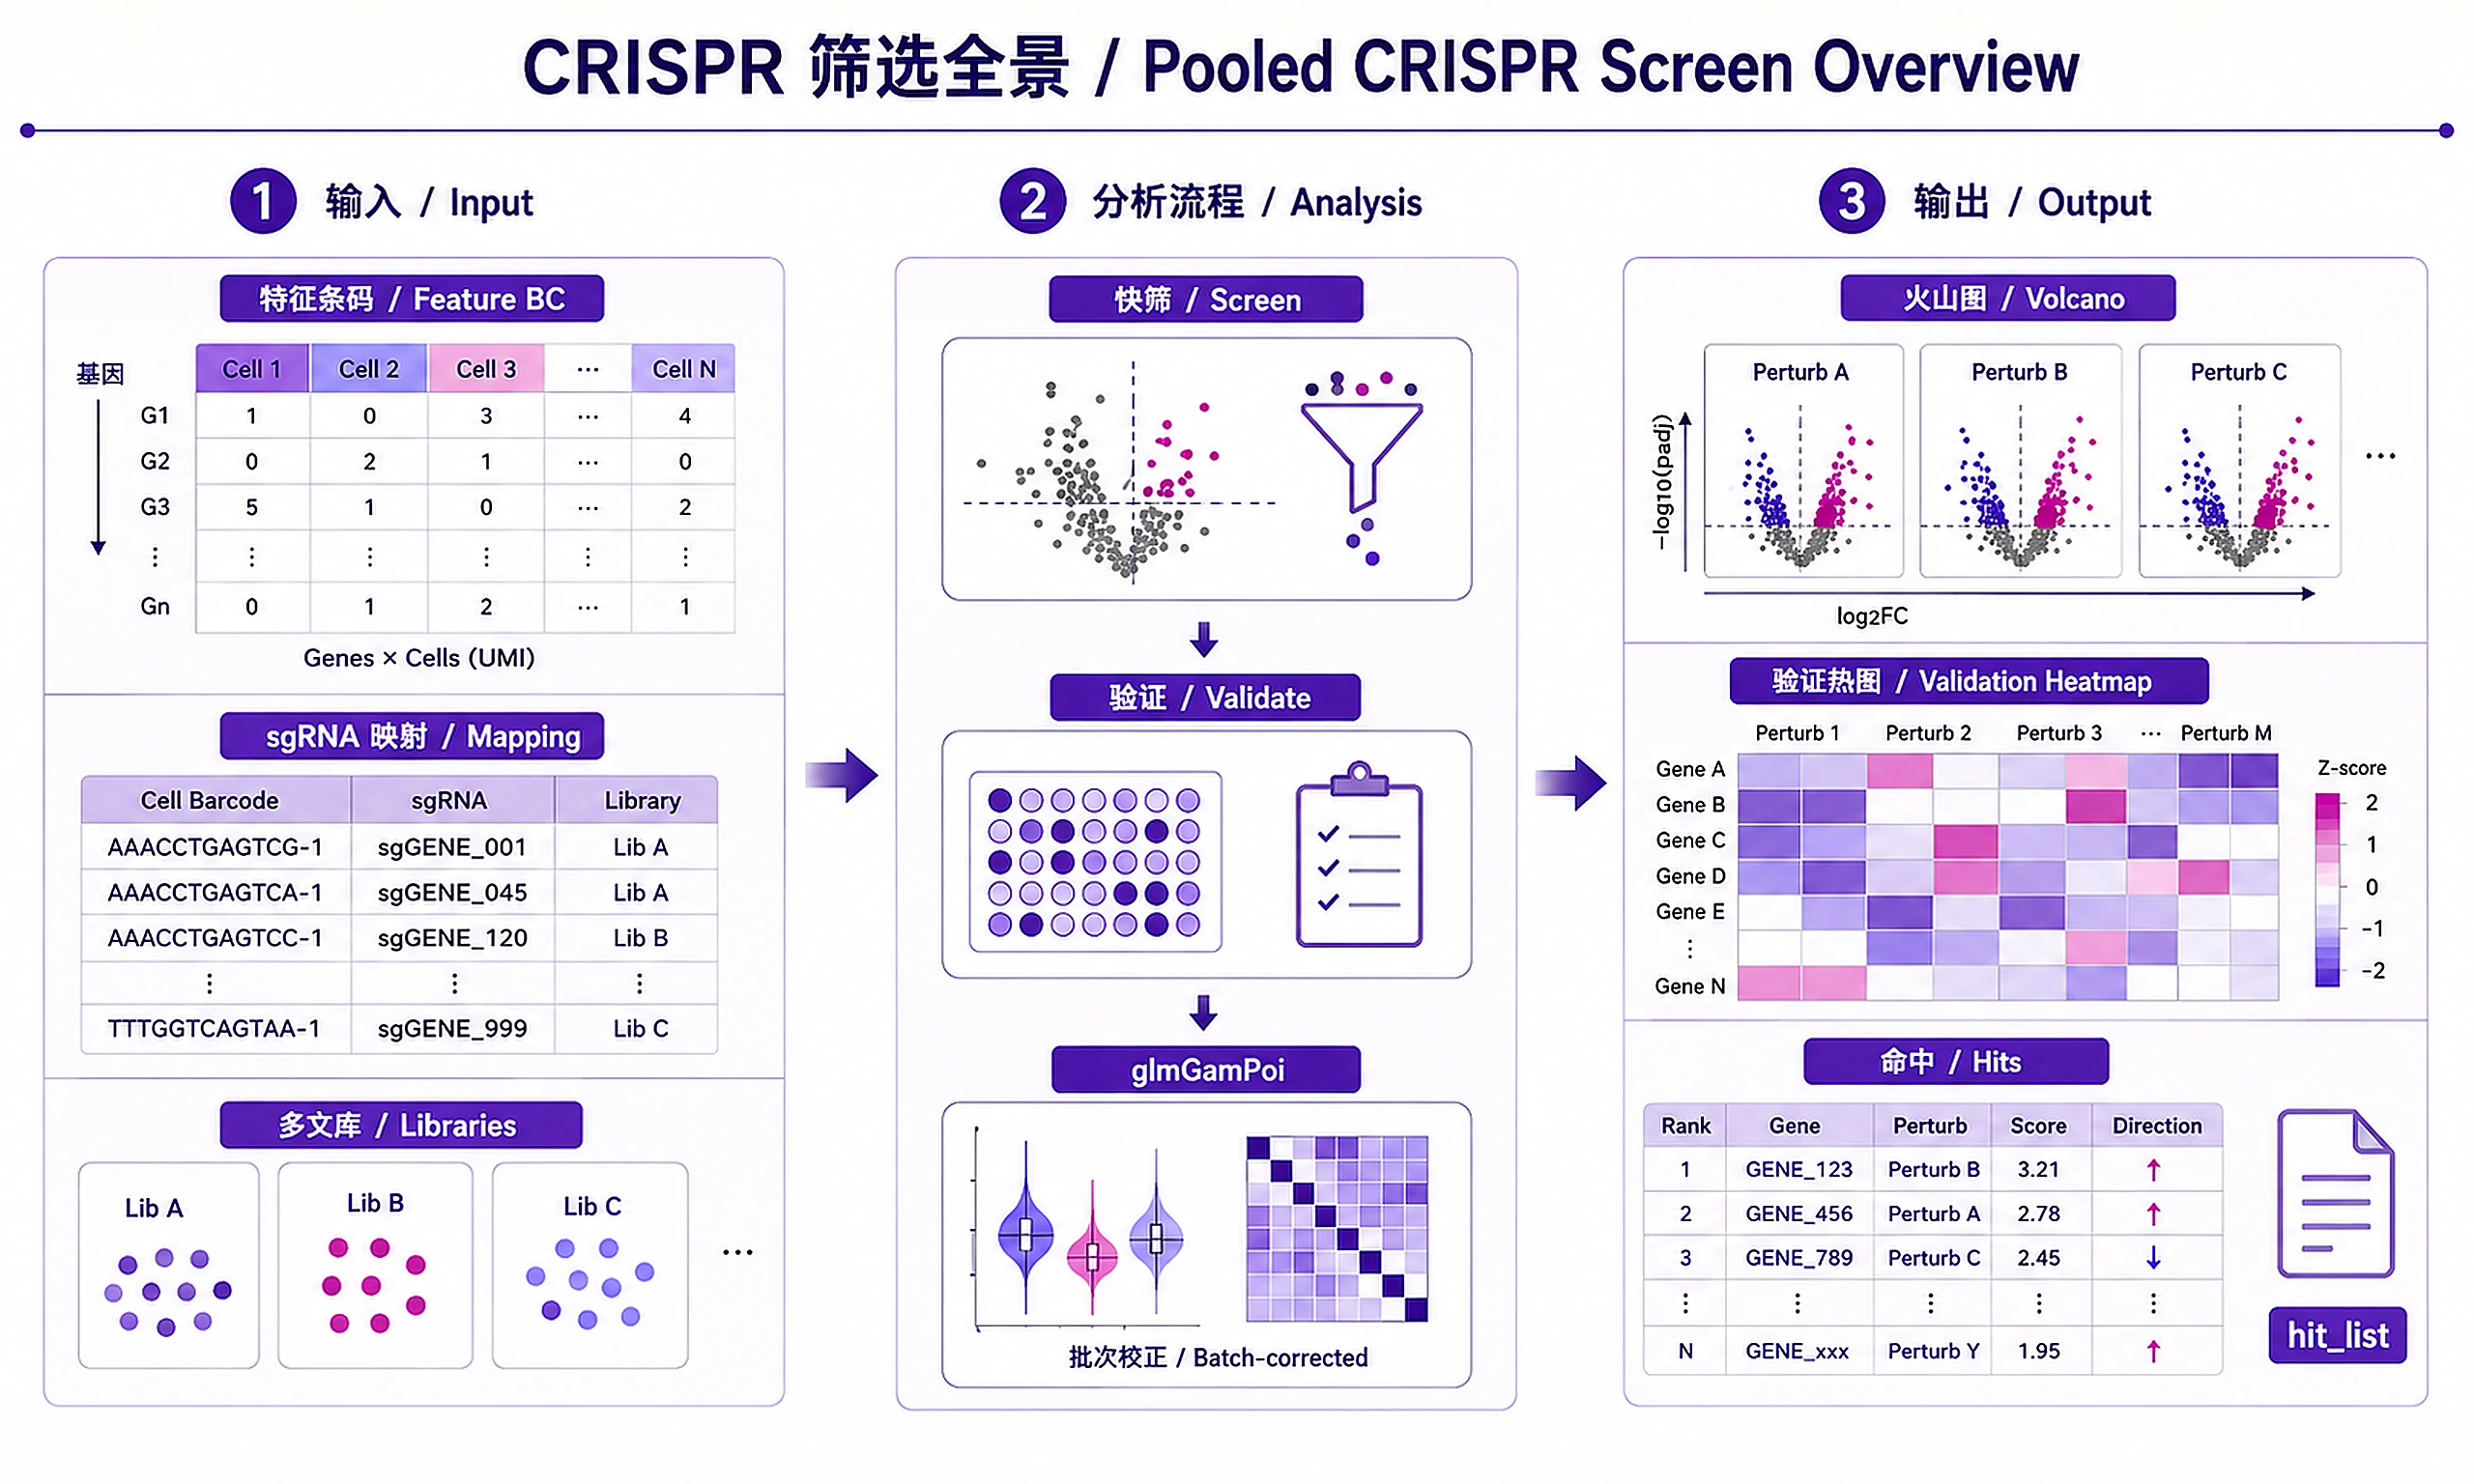
Figures
Tutorial
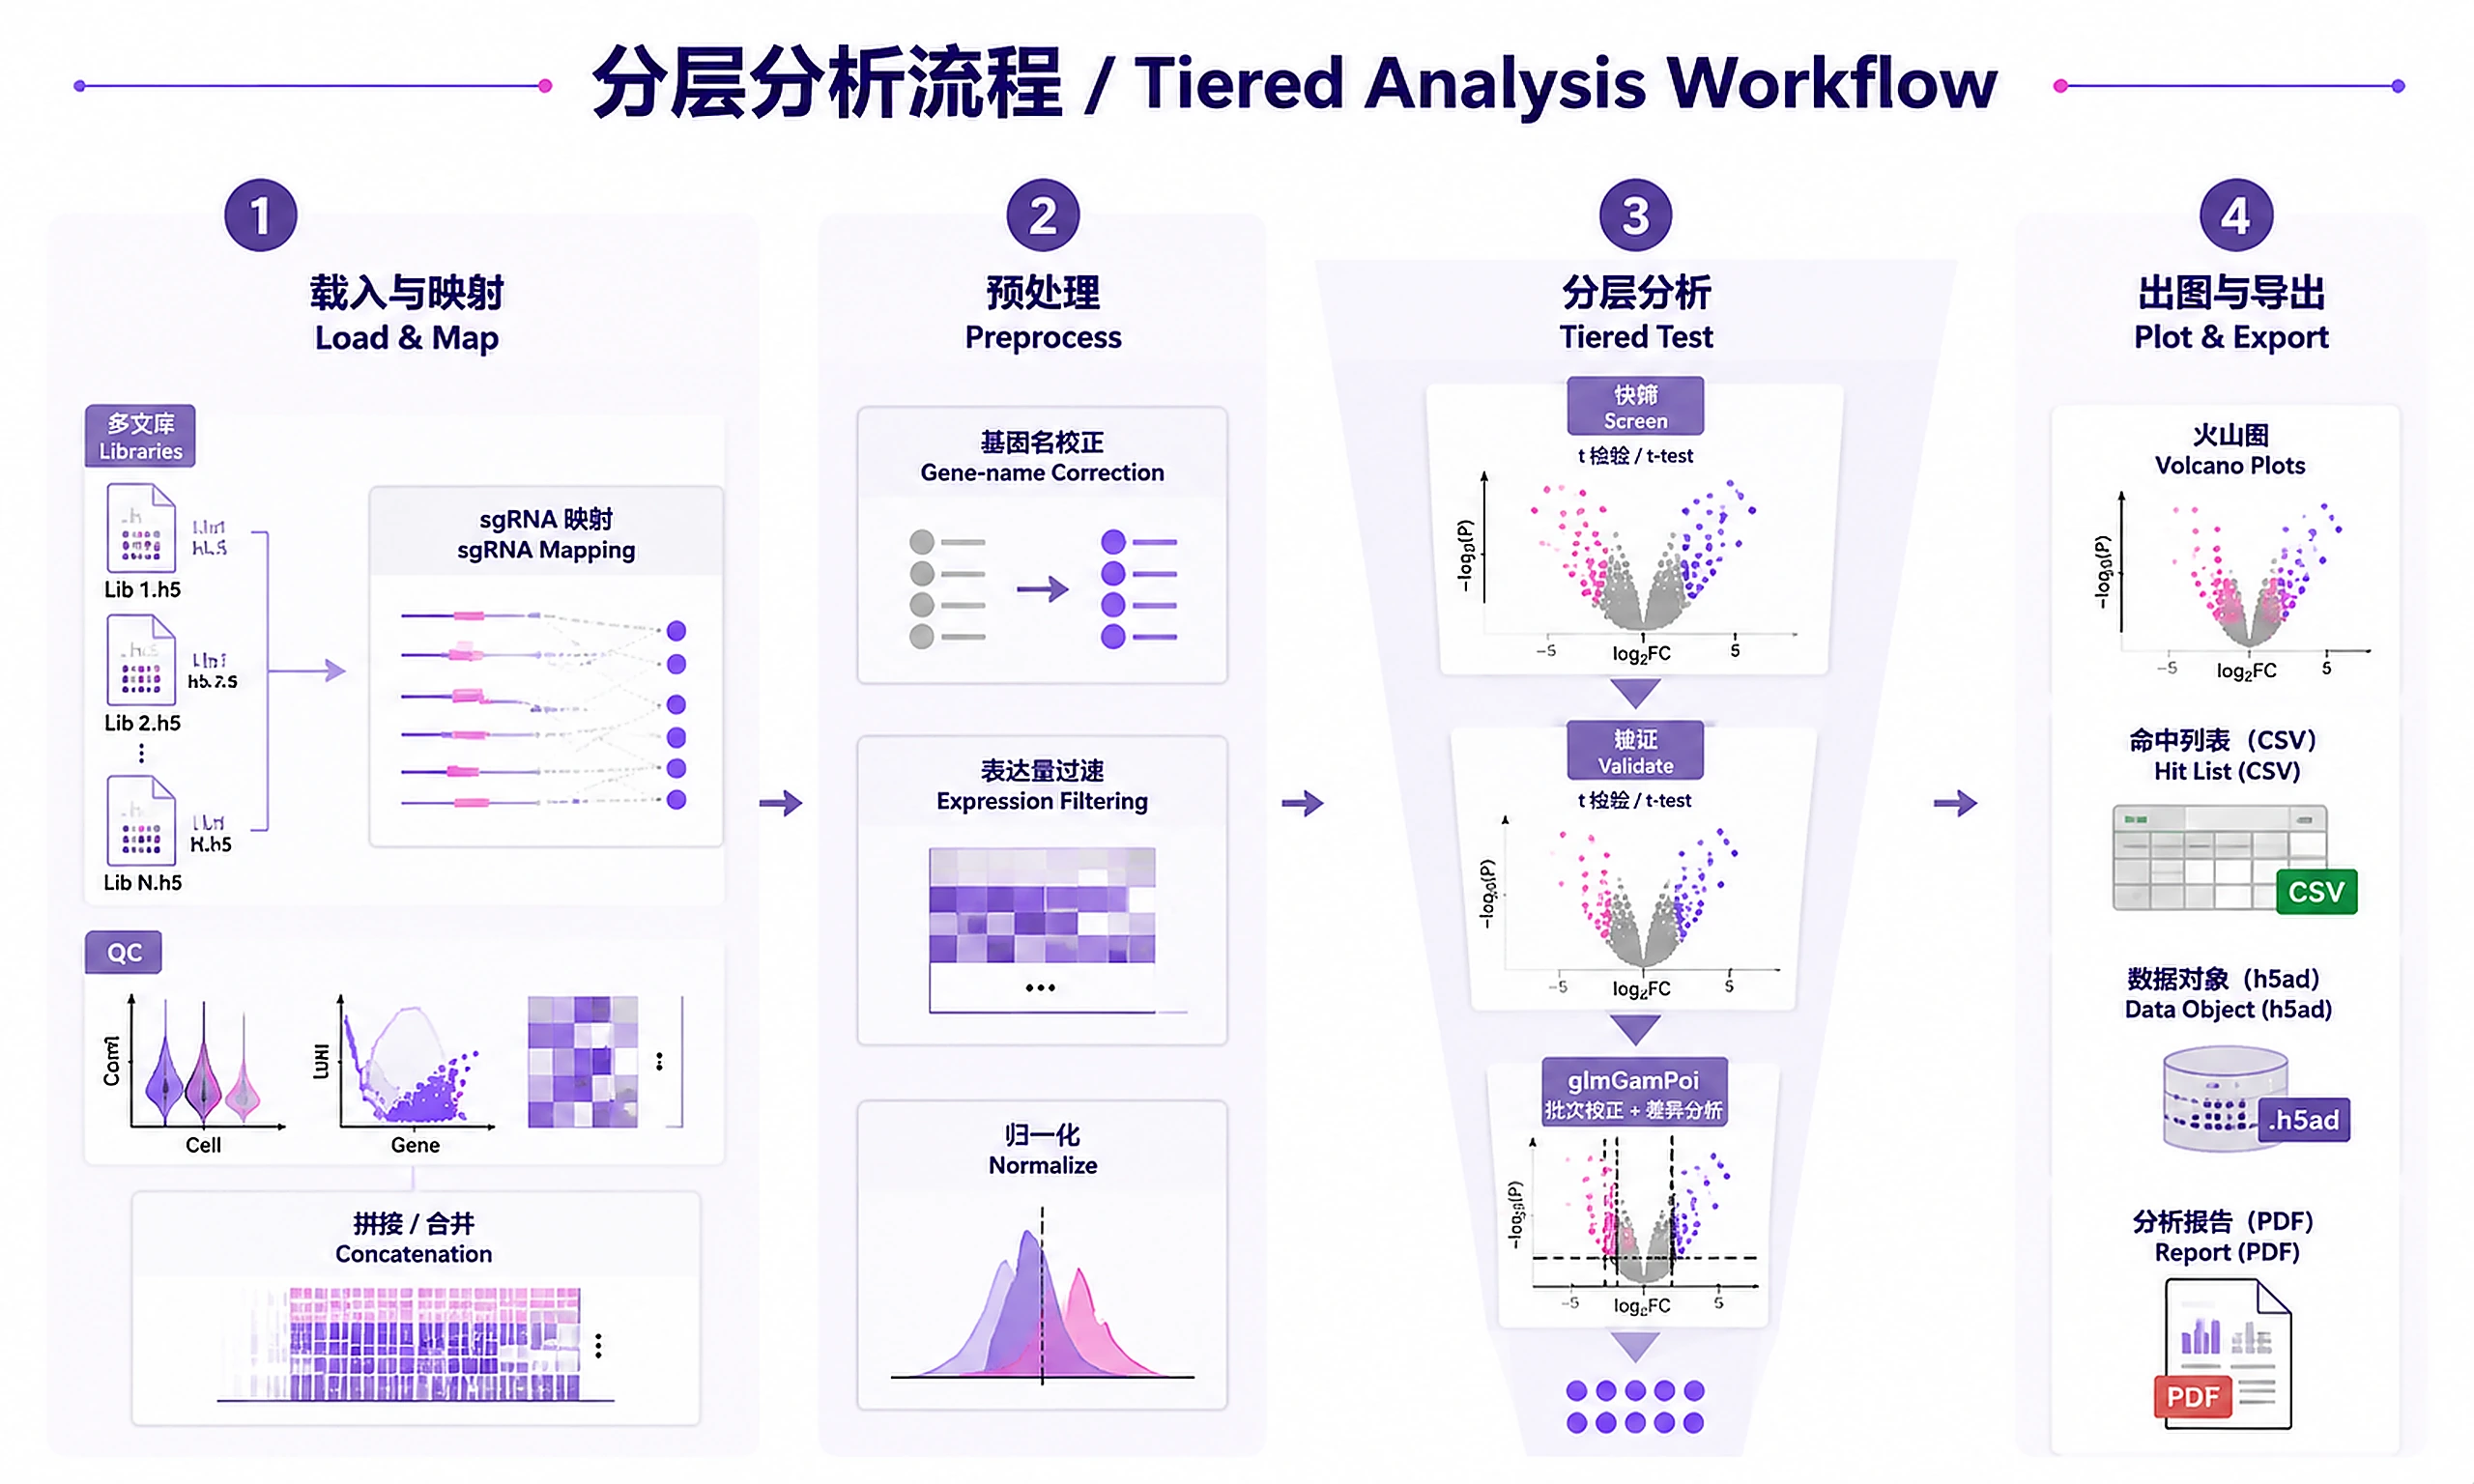
Analyze pooled CRISPR screens with single-cell RNA-seq readout using a tiered workflow: fast screening → target validation → rigorous differential expression.
When to Use This Skill
Use this skill when you have:
- ✅ Pooled CRISPR screens with scRNA-seq (Perturb-seq, CROP-seq, CRISPRi/a)
- ✅ 10X Feature Barcoding data (sgRNA captured as feature barcodes)
- ✅ Multi-library experiments with biological replicates
- ✅ sgRNA-to-cell mapping files (already assigned)
Don't use this skill for:
- ❌ Arrayed CRISPR screens (separate wells per perturbation) → use bulk RNA-seq DE skills
- ❌ Non-transcriptional readouts (e.g., protein, flow cytometry)
- ❌ Data without sgRNA assignments → use CellRanger or CROP-seq pipeline first
Quick Start (Example Data)
Test this skill with a real CRISPRi Perturb-seq dataset (~10 minutes):
from scripts.load_example_data import load_example_data
data = load_example_data()  # Downloads Papalexi 2021 (~140MB, cached after first run)

adata_list = data['adata_list']  # List of AnnData objects (one per batch)
mapping_files = data['mapping_files']  # sgRNA mapping files
What you get:
- Dataset: Papalexi & Satija 2021 ECCITE-seq CRISPRi screen (THP-1 cells)
- Size: ~20,700 cells x 18,649 genes across 4 batches
- Perturbations: 25 target genes (~4 guides each) targeting immune checkpoint regulators + non-targeting controls
- Screen type: CRISPRi (expected knockdown direction: down)
- Reference: Papalexi et al. (2021) Nature Genetics 53:322-331
For offline testing: Use load_example_data(dataset='demo') for a small synthetic dataset.
For your own data: Replace with your 10X feature-barcode matrices and sgRNA mapping files (see Inputs).
Installation
Core packages (required):
# Create conda environment
conda create -n crispr-screen python=3.8
conda activate crispr-screen

# Install packages
pip install scanpy==1.9+ anndata==0.8+ pandas numpy scipy
pip install scikit-learn  # For outlier detection
pip install diffxpy  # For differential expression
Visualization packages (required):
pip install matplotlib seaborn
Optional packages:
# For glmGamPoi (requires R ≥4.0)
# Install R, then:
# install.packages("BiocManager")
# BiocManager::install("glmGamPoi")
pip install rpy2  # Python-R interface

# For PDF report generation (optional, recommended)
pip install reportlab
Version requirements:
| Software | Version | License | Commercial Use | Install |
|---|---|---|---|---|
| scanpy | ≥1.9 | BSD-3 | ✅ Permitted | pip install scanpy |
| anndata | ≥0.8 | BSD-3 | ✅ Permitted | pip install anndata |
| matplotlib | ≥3.5 | PSF | ✅ Permitted | pip install matplotlib |
| seaborn | ≥0.12 | BSD-3 | ✅ Permitted | pip install seaborn |
| scikit-learn | ≥1.0 | BSD-3 | ✅ Permitted | pip install scikit-learn |
| diffxpy | ≥0.7 | BSD-3 | ✅ Permitted | pip install diffxpy |
| reportlab | ≥3.6 | BSD | ✅ Permitted | pip install reportlab (optional) |
| rpy2 | ≥3.5 | GPL-2 | ✅ Permitted | pip install rpy2 (optional) |
Inputs
Required:
- 10X Feature-Barcode matrices (.h5 format, one per library)
- Contains gene expression + sgRNA counts
- From CellRanger with Feature Barcoding
- sgRNA mapping files (TSV with cell-sgRNA assignments)
- Format:
cell_barcode\tsgRNA_id - One file per library
- Should filter to single sgRNA assignments (doublets removed)
sgRNA naming conventions:
- With gene names:
GENE_sgRNA1,GENE_sgRNA2(delimiter:_) - Without gene names: Requires separate gene lookup table
Alternative inputs: CROP-seq pipeline output, custom sgRNA assignment files
See references/crispr_screen_best_practices.md for data format details.
Outputs
Primary results:
screening_summary.txt- Per-perturbation DE statistics from t-testvalidation_results.csv- Target gene knockdown/activation validationglmgampoi/- Batch-corrected DE results (top hits)hit_list.csv- Final validated hits with DE gene counts
Processed data:
adata_normalized.h5ad- Normalized AnnData object for downstream analysis- Load with:
adata = sc.read_h5ad('adata_normalized.h5ad') - Required for: Clustering, pseudotime, trajectory analysis
adata_processed.h5ad- Final processed data with all annotations
Analysis objects (pickle):
analysis_objects.pkl- Analysis results for downstream skills- Load with:
import pickle; objs = pickle.load(open('analysis_objects.pkl', 'rb')) - Contains: perturbation_summary, de_results, outlier_cells
- Required for: functional-enrichment-from-degs, coexpression-network
Report:
crispr_screen_report.pdf- Publication-quality PDF with Introduction, Methods, Results, Conclusions- Requires:
pip install reportlab(optional — text report generated regardless)
QC plots (PNG + SVG format):
qc_metrics/- Cell counts, mapping rates, doublet rates per libraryvolcano_plots/- Per-perturbation volcano plots (top hits)target_validation/- Target gene expression heatmaps
DE results (per perturbation):
initial_screening/- Fast t-test results (CSV per perturbation)glmgampoi/- Rigorous DE with batch correction (top 50-100 hits)
Clarification Questions
🚨 ALWAYS ask Question 1 FIRST. Do not ask about screen type, library details, or analysis goals before the user has answered Question 1.
1. Input Files (ASK THIS FIRST):
- Do you have 10X Feature-Barcode matrix files (.h5) to analyze?
- If uploaded: How many libraries/replicates?
- Expected format:
raw_feature_bc_matrix.h5from CellRanger
- Do you have sgRNA-to-cell mapping files?
- If yes: Format? (TSV with barcode-sgRNA pairs). Doublets already filtered?
- Or use example data for testing? (Papalexi 2021 CRISPRi dataset — real data, ~140MB download)
🚨 IF EXAMPLE DATA SELECTED: All parameters are pre-defined (CRISPRi, THP-1 immune cells, 25 target genes). DO NOT ask questions 2-6. Proceed directly to Step 1.
Questions 2-6 are ONLY for users providing their own data:
2. Screen Type: CRISPRi (knockdown), CRISPRa (activation), CRISPRko (knockout), or other?
3. Library Information: How many biological replicates? Non-targeting controls present? Approximate perturbations (10-100, 100-1000, 1000+)? sgRNAs per gene (1-2, 3-5, 5+)?
4. Cell Type: Primary neurons, iPSC-derived, immune cells, cancer cell lines, other? Expected phenotype (cell death, differentiation, activation, subtle)?
5. sgRNA Naming: Do sgRNA IDs include gene names (e.g., "GENE_sgRNA1")? If not, need gene lookup table?
6. Analysis Goals (skip for example data):
- Primary goal?
- a) Identify all hits with transcriptional phenotypes (standard)
- b) Compare specific perturbations against each other
- c) Focus on a known gene set
- Run downstream pathway enrichment?
- a) Yes (recommended)
- b) No, just hit identification
Typical Complete Workflow
This skill performs core Perturb-seq analysis: screening, validation, and hit identification. For a complete CRISPR screen workflow:
- This skill: Screen analysis → validated hits with transcriptional phenotypes (H5AD + hit lists)
- functional-enrichment-from-degs: Pathway enrichment on hit perturbations → biological interpretation
- coexpression-network: Network analysis from perturbed cells → regulatory relationships
- bulk-omics-clustering: Cluster perturbations by signature → functional groups
Quick start: "Analyze my pooled CRISPR screen and identify hits with pathway enrichment"
Why separate skills? Modular design works across screen types (CRISPRi/a/ko) and readouts (scRNA-seq, bulk). See Suggested Next Steps for details.
Standard Workflow
🚨 MANDATORY: USE SCRIPTS EXACTLY AS SHOWN - DO NOT WRITE INLINE CODE 🚨
This skill uses low-freedom script execution. Pooled CRISPR screen analysis requires careful multi-step processing with QC checkpoints. Scripts handle:
- Multi-library loading and concatenation
- sgRNA doublet filtering
- Cell-type specific QC thresholds
- Batch effect handling
- Target validation checks
Step 1 - Load data and map sgRNAs:
For example data:
from scripts.load_example_data import load_example_data
data = load_example_data()  # Papalexi 2021 CRISPRi (~140MB, cached)
adata_list = data['adata_list']
mapping_files = data['mapping_files']
For your own data:
from scripts.load_10x_libraries import load_multiple_libraries
from scripts.map_sgrna_to_cells import map_sgrna_to_adata
from scripts.qc_filtering import apply_qc_filters
from scripts.concatenate_libraries import concatenate_libraries

# Load, map, filter, concatenate
adata_list = load_multiple_libraries(["lib1.h5", "lib2.h5"])
adata_mapped = [map_sgrna_to_adata(ad, mf, sgrna_delimiter="_")
                for ad, mf in zip(adata_list, mapping_files)]
adata_filtered = [apply_qc_filters(ad, min_genes=2000, min_counts=8000, max_mito_pct=0.15)
                  for ad in adata_mapped]
adata = concatenate_libraries(adata_filtered, batch_labels=["lib1", "lib2"])
DO NOT write inline loading/QC code. Use the functions above.
✅ VERIFICATION: You should see "✓ sgRNA mapping complete: [N] cells retained" for each library, then "✓ Libraries concatenated: [N] total cells"
Step 2 - Preprocess and normalize:
from scripts.gene_name_corrections import correct_gene_names
from scripts.expression_filtering import filter_by_expression
from scripts.normalize_and_scale import normalize_only

# Preprocessing pipeline
adata = correct_gene_names(adata, corrections={}, gene_col='gene')
adata = filter_by_expression(adata, group_key='sgRNA', min_mean_expression=0.5)
adata = normalize_only(adata, target_sum=1e6, exclude_highly_expressed=True)
DO NOT write inline preprocessing code. Use the functions above.
✅ VERIFICATION: You should see "✓ Gene name corrections applied", then "✓ Expression filtering: [N] genes retained", then "✓ Normalization complete"
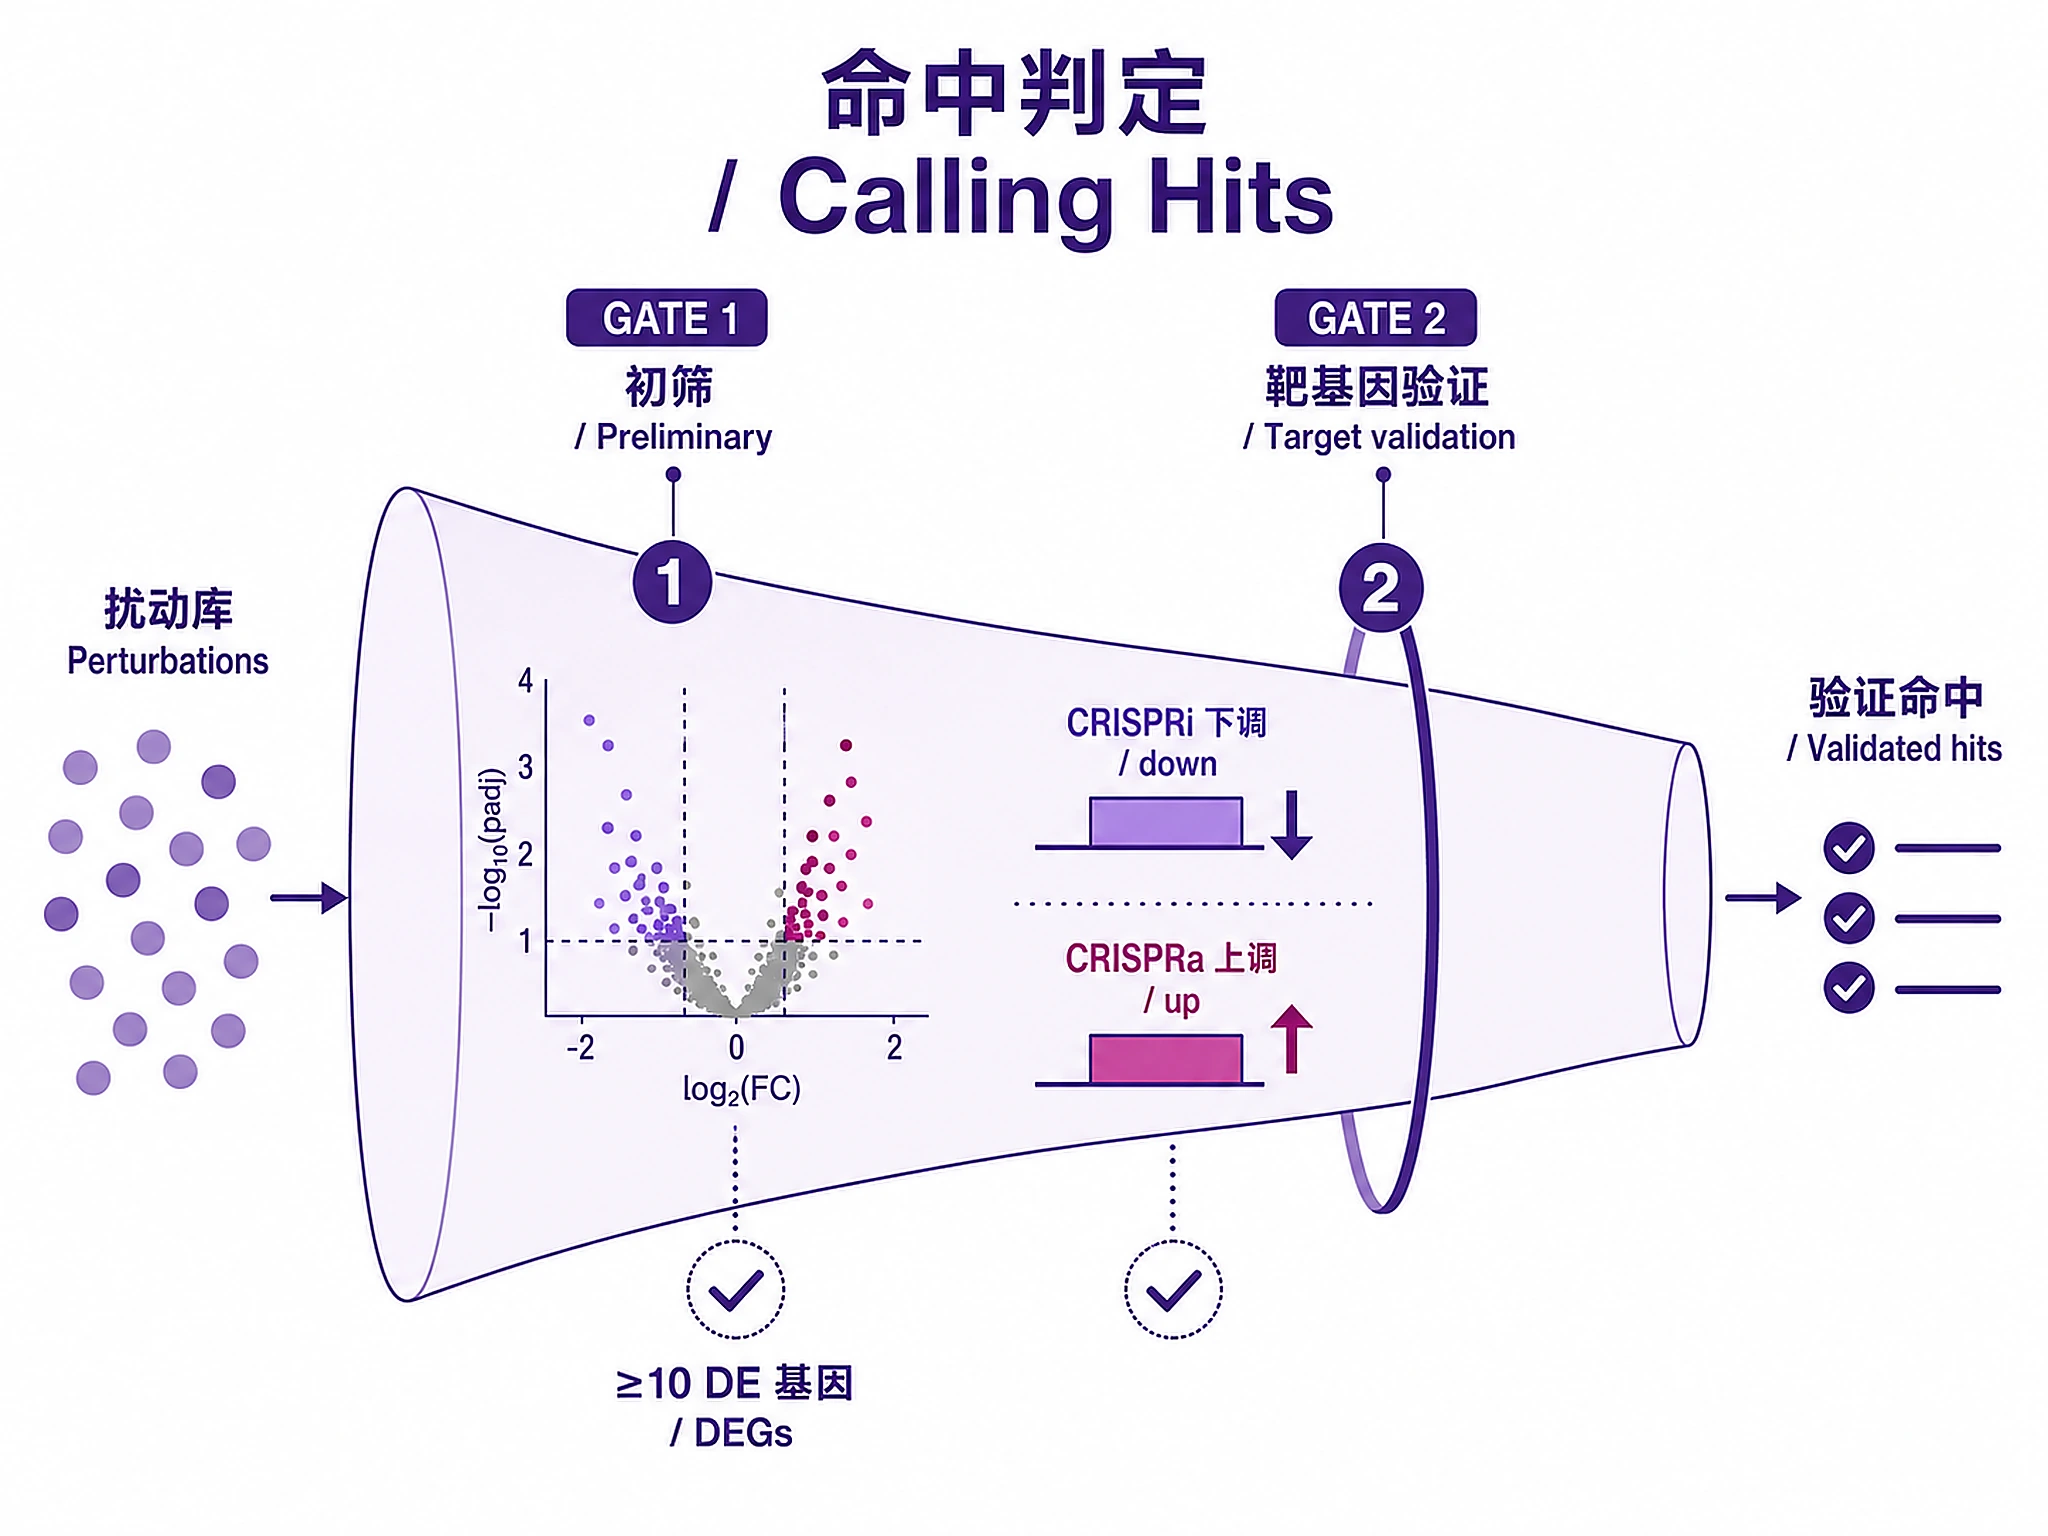
Step 3 - Run tiered analysis:
from scripts.screen_all_perturbations import screen_all_perturbations, call_hits
from scripts.validate_perturbations import validate_target_effect
from scripts.differential_expression_glmgampoi import run_glmgampoi_batch

# Fast screening → preliminary hits → validation
de_results = screen_all_perturbations(adata, control_group='non-targeting',
                                       gene_col='gene', test_method='t-test',
                                       output_dir='results/initial_screening/')
preliminary_hits = call_hits(de_results, min_de_genes=10)
validation = validate_target_effect(de_results, expected_direction='down',  # 'up' for CRISPRa
                                     min_log2fc=-0.5)
validated_hits = preliminary_hits[
    preliminary_hits['perturbation'].isin(
        validation[validation['target_affected']]['perturbation']
    )
]

# Rigorous DE for top hits (optional, requires R + glmGamPoi)
top_hits = validated_hits.head(50)
glmgampoi_results = run_glmgampoi_batch(adata, perturbations=top_hits['perturbation'].tolist(),
                                         donor_col='batch', output_dir='results/glmgampoi/')
DO NOT write inline DE code. Use the functions above.
✅ VERIFICATION: You should see "✓ Screening complete: [N] perturbations tested", then "Validated hits: [N]/[M]", then (if glmGamPoi runs) "✓ glmGamPoi complete"
Step 4 - Visualize and export:
from scripts.visualize_perturbations import create_volcano_plots
from scripts.export_results import export_all_results

# Volcano plots for top hits
for gene in top_hits['perturbation'].head(10):
    create_volcano_plots(de_results[gene], perturbation=gene, output_dir='figures/')

# Export all results (CSV, H5AD, pickle, PDF report, hit lists)
export_all_results(adata=adata, perturbation_summary=validated_hits,
                   de_results=de_results, output_dir='results/')
DO NOT write custom export code. Use export_all_results().
✅ VERIFICATION: You should see "✓ Volcano plots generated: [N] perturbations", then "=== Export Complete ===" with list of files saved
❌ IF YOU DON'T SEE VERIFICATION MESSAGES: You wrote inline code instead of using the functions. Stop and use the provided functions.
⚠️ CRITICAL - DO NOT:
- ❌ Write inline data loading code → STOP: Use load_multiple_libraries() and map_sgrna_to_adata()
- ❌ Write inline QC/filtering code → STOP: Use apply_qc_filters() and filter_by_expression()
- ❌ Write inline DE screening code → STOP: Use screen_all_perturbations() and validate_target_effect()
- ❌ Write custom export code → STOP: Use export_all_results()
⚠️ IF SCRIPTS FAIL - Script Failure Hierarchy:
- Fix and Retry (90%) - Install missing package, re-run script
- Modify Script (5%) - Edit the script file itself, document changes
- Use as Reference (4%) - Read script, adapt approach, cite source
- Write from Scratch (1%) - Only if genuinely impossible, explain why
NEVER skip directly to writing inline code without trying the script first.
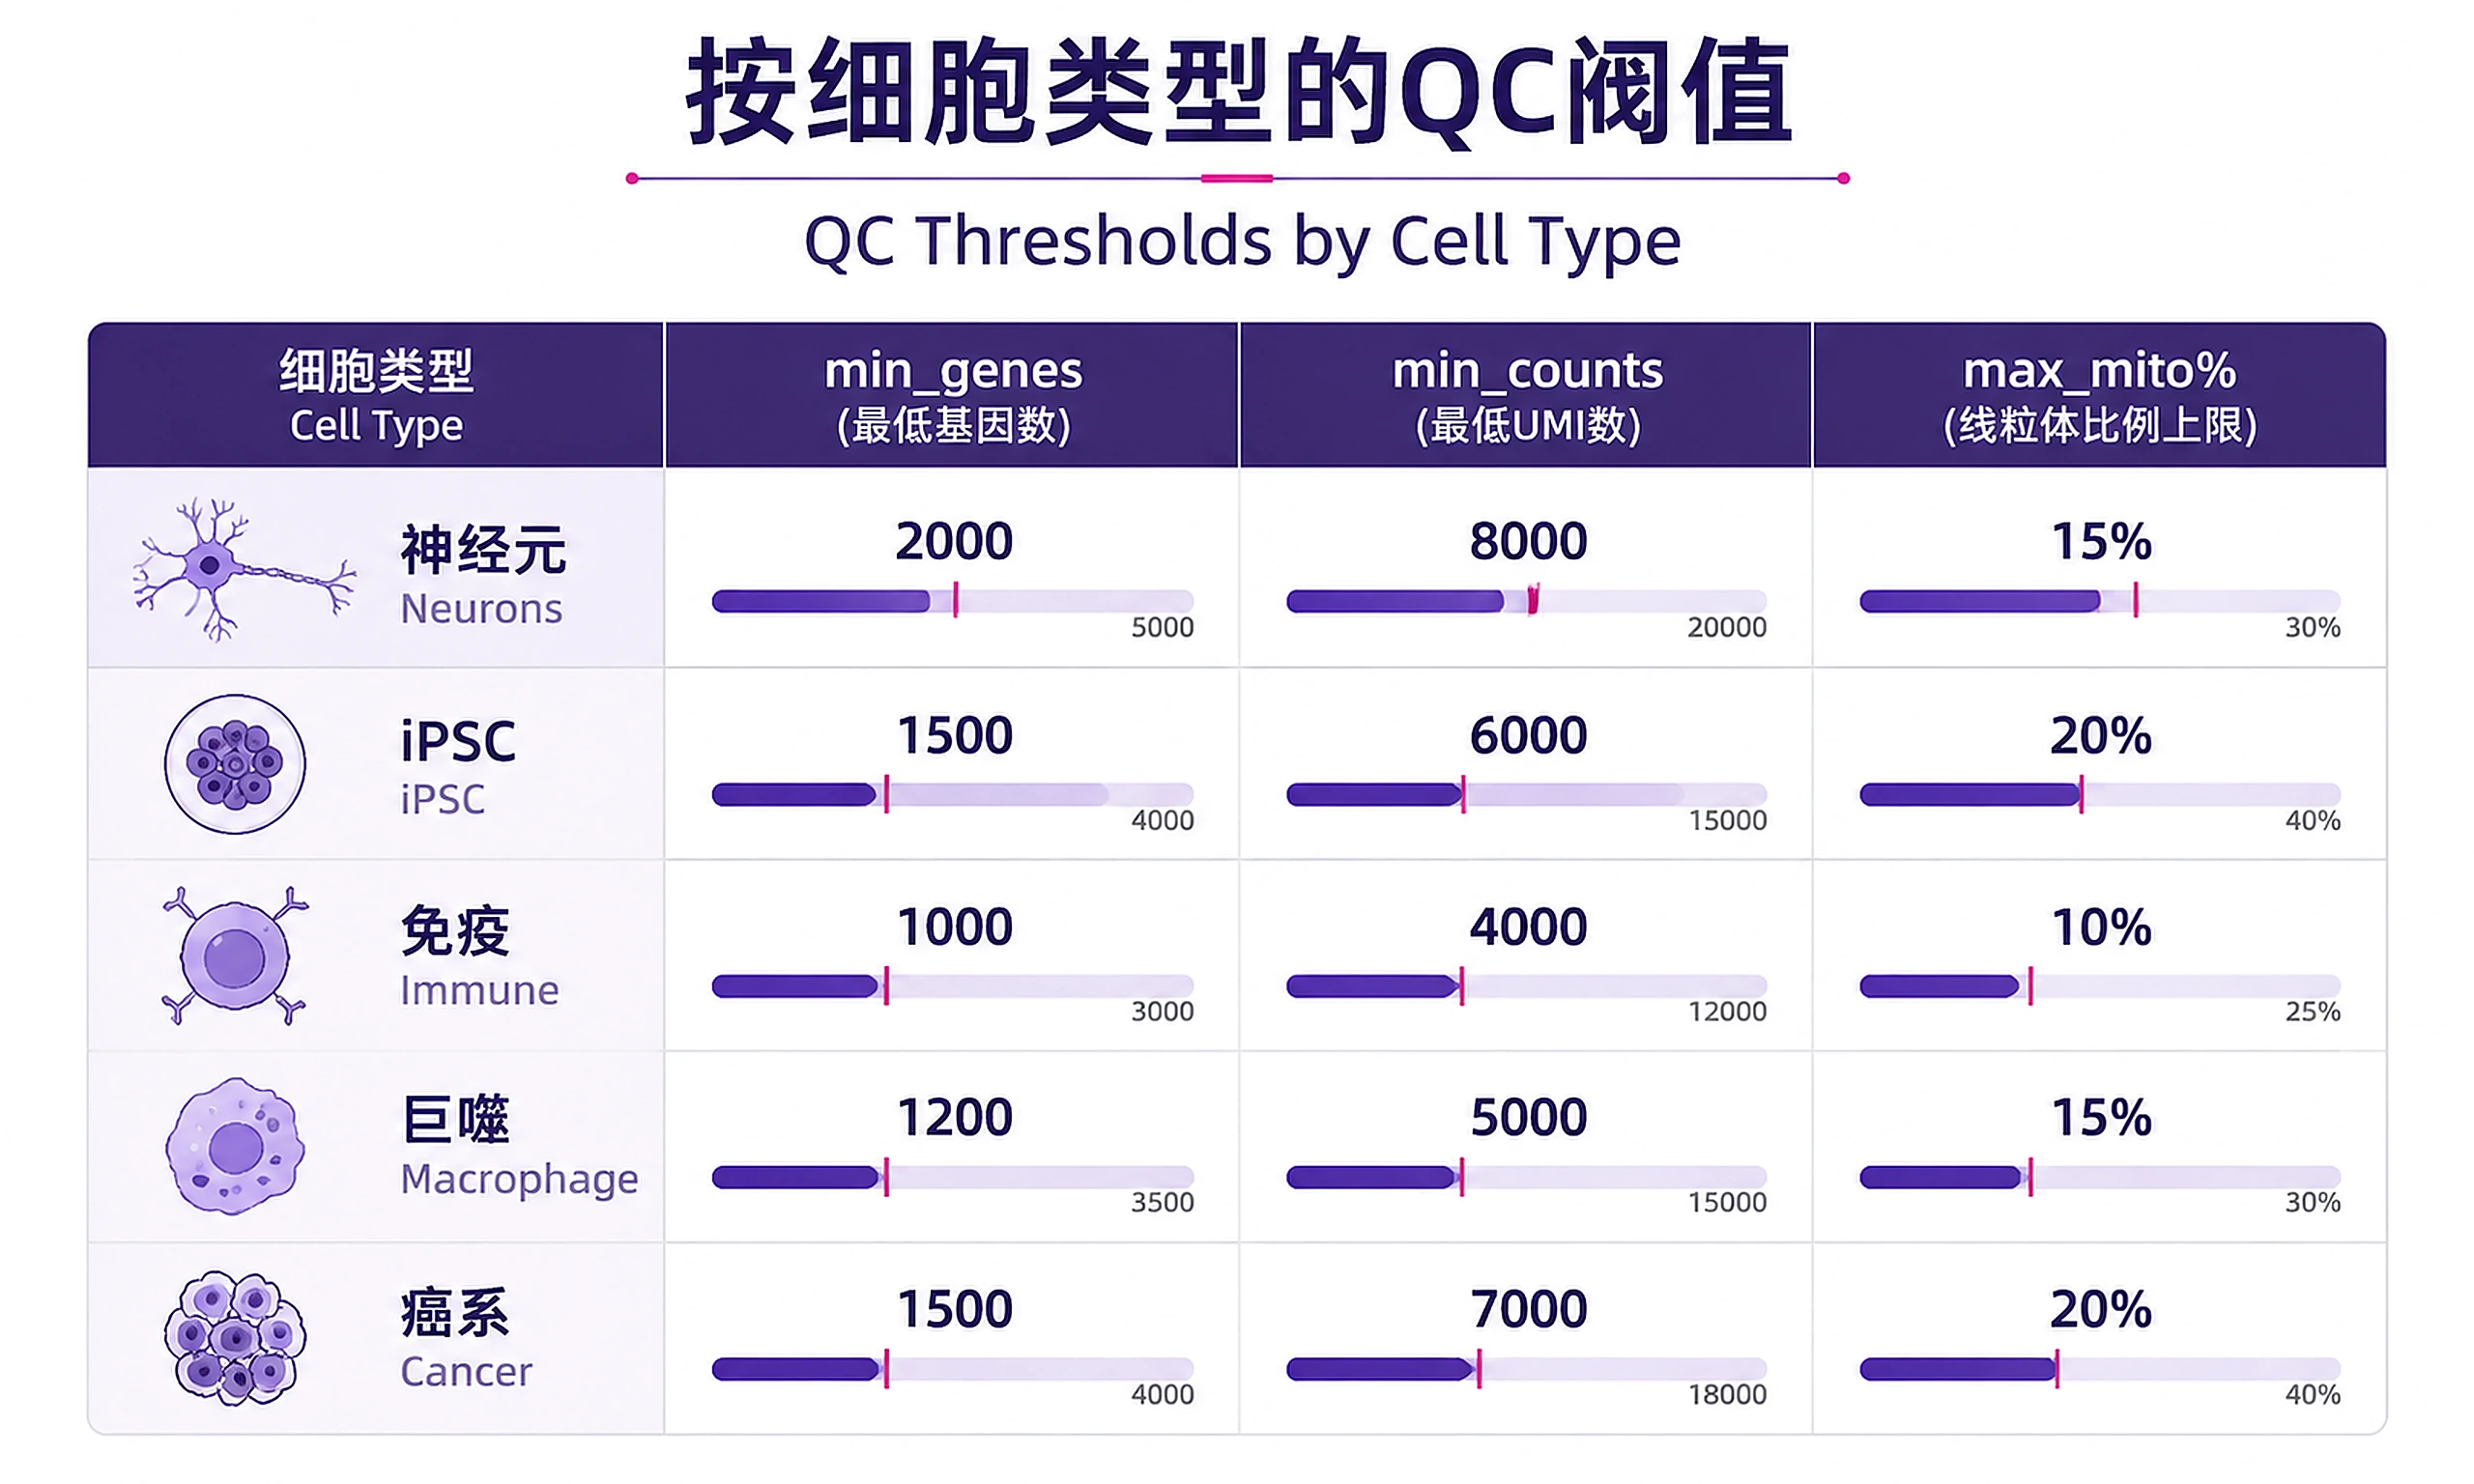
📁 QC Thresholds by Cell Type:
| Cell Type | min_genes | min_counts | max_mito_pct |
|---|---|---|---|
| Primary neurons | 2000-3000 | 8000-10000 | 0.10-0.15 |
| iPSC-derived | 1500-2500 | 5000-8000 | 0.15-0.20 |
| Immune cells | 1000-1500 | 3000-5000 | 0.15-0.20 |
| Macrophages | 1000 | 3000-5000 | 0.18-0.20 |
| Cancer cell lines | 1500-2500 | 5000-8000 | 0.15-0.25 |
See references/qc_guidelines.md for detailed thresholds.
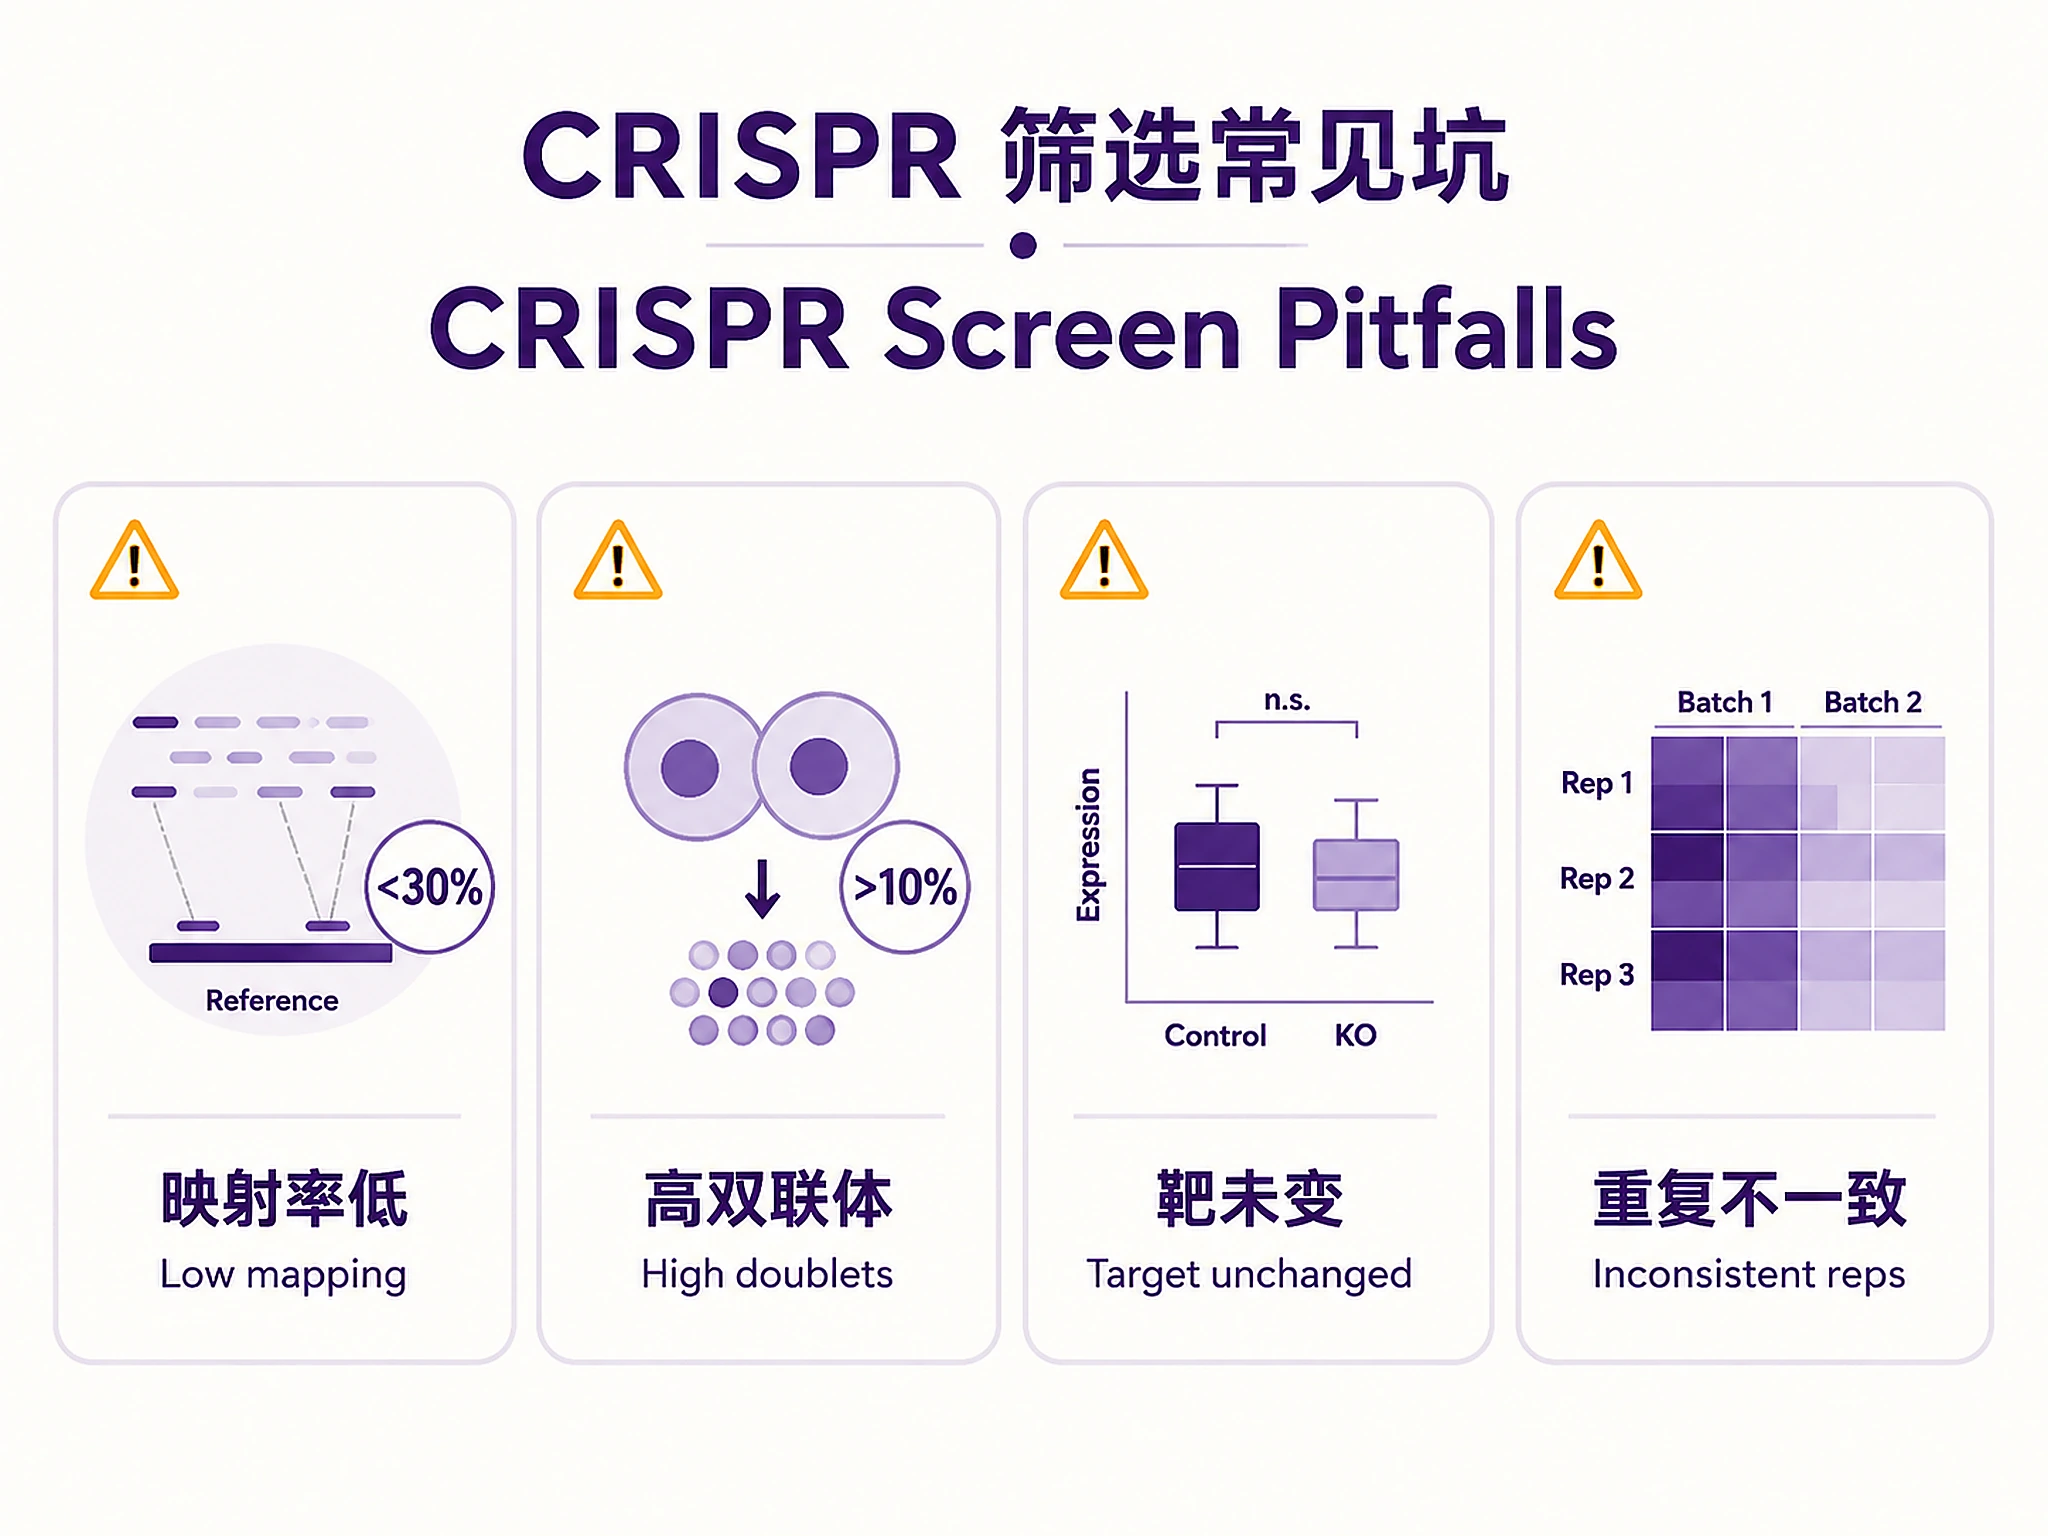
Common Issues
| Issue | Cause | Solution |
|---|---|---|
| Low sgRNA mapping rate (<30%) | Poor capture efficiency, wrong mapping file | Check feature barcode library prep, verify sgRNA reference matches |
| High doublet rate (>10%) | High MOI, barcode collisions | Lower viral MOI in future screens, filter doublets computationally |
| Target gene not DE | Incomplete knockdown, ineffective sgRNA, compensation | Check sgRNA design, validate with protein, check for paralogs |
| Low validation rate (<50%) | Weak perturbations, wrong expected direction | Check CRISPRi vs CRISPRa, adjust log2fc threshold, check positive controls |
| Memory errors | Large dataset (>100k cells) | Process libraries separately, use backed mode (adata = sc.read_h5ad('file.h5ad', backed='r')) |
| Inconsistent replicates | Batch effects, population drift | Check batch balance, perform batch correction, analyze replicates separately first |
| glmGamPoi fails | R not installed, missing package | Install R ≥4.0 and glmGamPoi, or skip and use t-test results |
| SVG export failed | Missing SVG backend | Normal — script falls back automatically. Both PNG and SVG attempted. |
See references/troubleshooting_guide.md for detailed solutions.
Suggested Next Steps
After running this skill:
- functional-enrichment-from-degs - Pathway enrichment on hit perturbations
- coexpression-network - Build gene regulatory networks from perturbed cells
- bulk-omics-clustering - Cluster perturbations by transcriptional signature
Related analyses:
- Compare hit genes to GWAS loci (genetic-variant-annotation)
- Investigate heterogeneous responses (use Step 12 optional heterogeneity analysis in references/statistical_methods.md)
Related Skills
- functional-enrichment-from-degs - Pathway enrichment on DE genes
- de-results-to-plots - Advanced visualization (heatmaps, custom plots)
- coexpression-network - Gene regulatory network inference
- bulk-omics-clustering - Cluster samples/perturbations by expression
References
Key Papers:
- Dixit et al. (2016) "Perturb-Seq" Cell 167:1853-1866
- Datlinger et al. (2017) "Pooled CRISPR screening with single-cell readout" Nature Methods 14:297-301
- Papalexi et al. (2021) "Characterizing the molecular regulation of inhibitory immune checkpoints" Nature Genetics 53:322-331 (example dataset)
- Replogle et al. (2020) "Direct guide RNA capture" Nature Biotechnology 38:954-961
- Peidli et al. (2024) "scPerturb: harmonized single-cell perturbation data" Nature Methods 21:531-540 (data source)
Online Resources:
- 10X Feature Barcoding: https://support.10xgenomics.com/single-cell-gene-expression/software/pipelines/latest/algorithms/crispr
- CROP-seq pipeline: https://github.com/argschwind/CROP-seq-pipeline
- Alector Perturb-seq analysis: https://github.com/Alector-BIO/CRISPR_PerturbSeq_pHM_publication
See references/crispr_screen_best_practices.md for comprehensive guidelines.
Code preview
scripts/concatenate_libraries.py
"""
Concatenate Multiple Libraries

Merge filtered libraries into a single AnnData object with batch labels.
"""

import scanpy as sc
import anndata as ad
from typing import List, Optional
import warnings


def concatenate_libraries(
    adata_list: List[ad.AnnData],
    batch_labels: Optional[List[str]] = None,
    batch_key: str = 'batch'
) -> ad.AnnData:
    """
    Concatenate multiple AnnData objects (libraries) into one.

    Parameters
    ----------
    adata_list : list of AnnData
        List of filtered AnnData objects to concatenate
    batch_labels : list of str, optional
        Labels for each batch (e.g., ["lib1", "lib2", "lib3"])
        If None, uses numeric labels (0, 1, 2, ...)
    batch_key : str, default='batch'
        Column name for batch labels in obs

    Returns
    -------
    adata_combined : AnnData
        Concatenated AnnData object with batch labels

    Example
    -------
    >>> adata_combined = concatenate_libraries(
    ...     [adata1_filtered, adata2_filtered, adata3_filtered, adata4_filtered],
    ...     batch_labels=["lib1", "lib2", "lib3", "lib4"]
    ... )
    """
    print(f"Concatenating {len(adata_list)} libraries...")

    # Print summary of each library
    for i, adata in enumerate(adata_list):
        label = batch_labels[i] if batch_labels else f"batch_{i}"
        print(f"  {label}: {adata.n_obs} cells x {adata.n_vars} genes")

        # Check for required columns
        if 'gene' in adata.obs.columns:
            n_genes = adata.obs['gene'].nunique()
            print(f"    Unique perturbations: {n_genes}")

    # Concatenate using modern anndata.concat (not deprecated concatenate method)
    if batch_labels:
        # Add batch labels to each AnnData
        for i, adata in enumerate(adata_list):
            adata.obs[batch_key] = batch_labels[i]

        adata_combined = ad.concat(
            adata_list,
            join='outer',
            label=None,  # We already added batch labels above
            keys=None,
            index_unique=None
        )
    else:
        # Simple concatenation without batch labels
        adata_combined = ad.concat(
            adata_list,
            join='outer'
        )

    print(f"\nCombined dataset:")
    print(f"  Total cells: {adata_combined.n_obs}")
    print(f"  Total genes: {adata_combined.n_vars}")

    if 'gene' in adata_combined.obs.columns:
        n_unique_genes = adata_combined.obs['gene'].nunique()
scripts/detect_perturbed_cells.py
"""
Detect Perturbed Cells Using Outlier Detection

For each perturbation, identify cells with significant phenotypic changes using
outlier detection methods in PCA space computed on differentially expressed genes.
"""

import numpy as np
import pandas as pd
import scanpy as sc
import anndata as ad
from sklearn.svm import OneClassSVM
from sklearn.neighbors import LocalOutlierFactor
from sklearn.ensemble import IsolationForest
import diffxpy.api as de
from typing import Dict, List, Optional, Literal


def detect_perturbed_cells(
    adata: ad.AnnData,
    control_group: str = 'non-targeting',
    gene_col: str = 'gene',
    sgrna_col: str = 'sgRNA',
    n_pcs: int = 4,
    method: Literal['LocalOutlierFactor', 'IsolationForest', 'OneClassSVM'] = 'LocalOutlierFactor',
    min_de_genes: int = 10,
    min_outliers: int = 10,
    pval_threshold: float = 0.05,
    save_plots: bool = True,
    plot_dir: str = 'figures/'
) -> Dict:
    """
    Detect perturbed cells with significant phenotypes using outlier detection.

    For each perturbation vs control:
    1. Run differential expression (t-test)
    2. Select top DE genes (p < pval_threshold)
    3. If ≥min_de_genes found, compute PCA on DE genes
    4. Train outlier detector on control cells
    5. Predict outliers in perturbed cells
    6. If ≥min_outliers detected, flag as "hit"

    Parameters
    ----------
    adata : AnnData
        Log-normalized AnnData (not scaled)
    control_group : str, default='non-targeting'
        Label for non-targeting control
    gene_col : str, default='gene'
        Column in obs with gene/perturbation labels
    sgrna_col : str, default='sgRNA'
        Column in obs with sgRNA labels
    n_pcs : int, default=4
        Number of PCs to compute on DE genes
    method : str, default='LocalOutlierFactor'
        Outlier detection method: 'LocalOutlierFactor', 'IsolationForest', 'OneClassSVM'
    min_de_genes : int, default=10
        Minimum DE genes required to proceed with outlier detection
    min_outliers : int, default=10
        Minimum outliers to call perturbation as "hit"
    pval_threshold : float, default=0.05
        P-value threshold for calling DE genes
    save_plots : bool, default=True
        Generate UMAP/PCA plots for each perturbation
    plot_dir : str, default='figures/'
        Directory to save plots

    Returns
    -------
    results : dict
        Dictionary containing:
        - 'outlier_cells': list of cell barcodes flagged as outliers
        - 'perturbation_summary': DataFrame with hit calls per perturbation
        - 'de_results': dict of DE results per perturbation
        - 'adata_dict': dict of per-perturbation AnnData objects with classifications

    Example
    -------
    >>> results = detect_perturbed_cells(
    ...     adata,
scripts/differential_expression.py
"""
Differential Expression Analysis per Perturbation

For each perturbation, perform differential expression analysis comparing
perturbed cells to non-targeting controls.
"""

import os
import pandas as pd
import anndata as ad
import diffxpy.api as de
from typing import Dict, Optional, Literal


def run_de_analysis(
    adata: ad.AnnData,
    control_group: str = 'non-targeting',
    gene_col: str = 'gene',
    test_method: Literal['t-test', 'wilcoxon', 'negative_binomial'] = 't-test',
    use_outliers_only: bool = True,
    outlier_cells: Optional[list] = None,
    top_n_genes: int = 50,
    output_dir: str = 'DEG/rank_test/',
    is_logged: bool = True
) -> Dict[str, pd.DataFrame]:
    """
    Run differential expression analysis for each perturbation vs control.

    Parameters
    ----------
    adata : AnnData
        Log-normalized AnnData (use adata.raw or normalized data)
    control_group : str, default='non-targeting'
        Label for control group
    gene_col : str, default='gene'
        Column in obs with perturbation labels
    test_method : str, default='t-test'
        Statistical test: 't-test', 'wilcoxon', 'negative_binomial'
    use_outliers_only : bool, default=True
        If True and outlier_cells provided, use only outlier cells for DE
    outlier_cells : list, optional
        List of cell barcodes identified as outliers (from detect_perturbed_cells)
    top_n_genes : int, default=50
        Number of top genes to highlight in output
    output_dir : str, default='DEG/rank_test/'
        Directory to save per-perturbation DE results
    is_logged : bool, default=True
        Whether data is log-transformed

    Returns
    -------
    de_results : dict
        Dictionary mapping gene -> DE results DataFrame

    Example
    -------
    >>> de_results = run_de_analysis(
    ...     adata,
    ...     control_group='non-targeting',
    ...     test_method='t-test',
    ...     use_outliers_only=True,
    ...     outlier_cells=results['outlier_cells'],
    ...     top_n_genes=50
    ... )
    """
    os.makedirs(output_dir, exist_ok=True)

    # Subset to outliers + controls if requested
    if use_outliers_only and outlier_cells is not None:
        print(f"Subsetting to outlier cells + controls...")
        control_cell_barcodes = adata[adata.obs[gene_col] == control_group].obs_names.tolist()
        kept_cells = list(set(outlier_cells + control_cell_barcodes))
        adata_selected = adata[adata.obs_names.isin(kept_cells)].copy()
        print(f"  Using {len(outlier_cells)} outlier cells + {len(control_cell_barcodes)} control cells")
    else:
        adata_selected = adata.copy()
        print("Using all cells for DE analysis")

    # Get unique perturbations
    genes = adata_selected.obs[gene_col].unique().tolist()